Mga Batayang Estadistika
| Pemilik Institusional | 296 total, 296 long only, 0 short only, 0 long/short - change of 12.98% MRQ |
| Alokasi Portofolio Rata-rata | 0.8477 % - change of -2.26% MRQ |
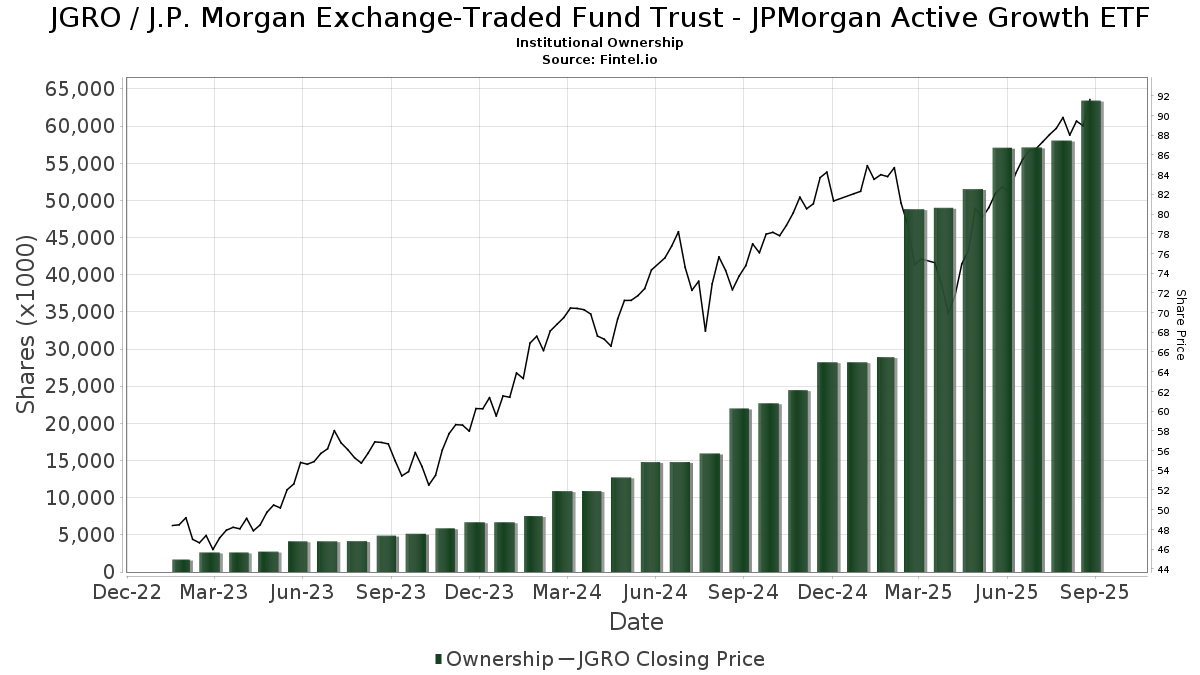
| Saham Institusional (Jangka Panjang) | 63,434,180 (ex 13D/G) - change of 6.34MM shares 11.11% MRQ |
| Nilai Institusional (Jangka Panjang) | $ 5,046,295 USD ($1000) |
Kepemilikan Institusional dan Pemegang Saham
J.P. Morgan Exchange-Traded Fund Trust - JPMorgan Active Growth ETF (US:JGRO) memiliki 296 pemilik institusional dan pemegang saham yang telah mengajukan formulir 13D/G atau 13F kepada Komisi Bursa Efek (Securities Exchange Commission/SEC). Lembaga-lembaga ini memegang total 63,434,180 saham. Pemegang saham terbesar meliputi Jpmorgan Chase & Co, LPL Financial LLC, Ameriprise Financial Inc, Captrust Financial Advisors, ADVANCED SERIES TRUST - AST T. Rowe Price Growth Opportunities Portfolio, Advanced Series Trust - Ast J.p. Morgan Strategic Opportunities Portfolio, Jones Financial Companies Lllp, Bank Of America Corp /de/, ADVANCED SERIES TRUST - AST J.P. Morgan Global Thematic Portfolio, and Raymond James Financial Inc .
Struktur kepemilikan institusional J.P. Morgan Exchange-Traded Fund Trust - JPMorgan Active Growth ETF (ARCA:JGRO) menunjukkan posisi terkini di perusahaan oleh institusi dan dana, serta perubahan terbaru dalam ukuran posisi. Pemegang saham utama dapat mencakup investor individu, reksa dana, dana lindung nilai, atau institusi. Jadwal 13D menunjukkan bahwa investor memegang (atau pernah memegang) lebih dari 5% saham perusahaan dan bermaksud (atau pernah bermaksud) untuk secara aktif mengejar perubahan strategi bisnis. Jadwal 13G menunjukkan investasi pasif lebih dari 5%.
The share price as of September 5, 2025 is 89.81 / share. Previously, on September 6, 2024, the share price was 70.67 / share. This represents an increase of 27.08% over that period.
Skor Sentimen Dana
Skor Sentimen Dana (sebelumnya dikenal sebagai Skor Akumulasi Kepemilikan) menemukan saham-saham yang paling banyak dibeli oleh dana. Ini adalah hasil dari model kuantitatif multi-faktor yang canggih yang mengidentifikasi perusahaan dengan tingkat akumulasi institusional tertinggi. Model penilaian menggunakan kombinasi dari total peningkatan pemilik yang diungkapkan, perubahan dalam alokasi portofolio pada pemilik tersebut, dan metrik lainnya. Angka berkisar dari 0 hingga 100, dengan angka yang lebih tinggi menunjukkan tingkat akumulasi yang lebih tinggi dibandingkan dengan perusahaan sejenisnya, dan 50 adalah rata-ratanya.
Frekuensi Pembaruan: Setiap Hari
Lihat Ownership Explorer, yang menyediakan daftar perusahaan dengan peringkat tertinggi.
Rasio Put/Call Institusional
Selain melaporkan isu ekuitas dan utang standar, institusi dengan aset di bawah manajemen lebih dari 100 juta dolar AS juga harus mengungkapkan kepemilikan opsi put dan call mereka. Karena opsi put umumnya menunjukkan sentimen negatif, dan opsi call menunjukkan sentimen positif, kita dapat mengetahui sentimen institusional secara keseluruhan dengan memplot rasio put terhadap call. Grafik di sebelah kanan memplot rasio put/call historis untuk instrumen ini.
Menggunakan Rasio Put/Call sebagai indikator sentimen investor mengatasi salah satu kekurangan utama dari penggunaan total kepemilikan institusional, yaitu sejumlah besar aset yang dikelola diinvestasikan secara pasif untuk melacak indeks. Dana yang dikelola secara pasif biasanya tidak membeli opsi, sehingga indikator rasio put/call lebih akurat dalam melacak sentimen dana yang dikelola secara aktif.
Pengajuan 13F dan NPORT
Detail pada pengajuan 13F tersedia gratis. Detail pada pengajuan NP memerlukan keanggotaan premium. Baris berwarna hijau menunjukkan posisi baru. Baris berwarna merah menunjukkan posisi yang sudah ditutup. Klik tautan ini ikon untuk melihat riwayat transaksi selengkapnya.
Tingkatkan
untuk membuka data premium dan mengekspor ke Excel ![]() .
.
| Tanggal File | Sumber | Investor | Ketik | Presyo ng Avg (Silangan) |
Saham | Δ Saham (%) |
Dilaporkan Nilai ($1000) |
Nilai Δ (%) |
Alokasi Port (%) |
|
|---|---|---|---|---|---|---|---|---|---|---|
| 2025-08-13 | 13F | Gateway Wealth Partners, LLC | 8,410 | 11.30 | 724 | 29.80 | ||||
| 2025-08-08 | 13F | Good Life Advisors, LLC | 99,003 | 12.71 | 8,521 | 31.48 | ||||
| 2025-08-12 | 13F | Wayfinding Financial, LLC | 15,143 | 21.59 | 1 | |||||
| 2025-08-14 | 13F | Aqr Capital Management Llc | 2,593 | 223 | ||||||
| 2025-08-14 | 13F | Benjamin Edwards Inc | 15,122 | 0.62 | 1,302 | 17.42 | ||||
| 2025-07-31 | 13F | MN Wealth Advisors, LLC | 117,637 | 4.15 | 10,125 | 21.49 | ||||
| 2025-08-12 | 13F | Jpmorgan Chase & Co | 9,351,704 | 8.93 | 804,901 | 27.05 | ||||
| 2025-08-14 | 13F | Glen Eagle Advisors, LLC | 105 | 0.00 | 9 | 28.57 | ||||
| 2025-08-11 | 13F | Semus Wealth Partners LLC | 23,269 | 1.47 | 2,003 | 18.32 | ||||
| 2025-07-17 | 13F | Worth Financial Advisory Group, LLC | 3,876 | 1.36 | 334 | 18.09 | ||||
| 2025-07-31 | 13F | Gill Capital Partners, Llc | 2,353 | 203 | ||||||
| 2025-08-05 | 13F | Sigma Planning Corp | 17,591 | 7.87 | 1,514 | 25.85 | ||||
| 2025-08-06 | 13F | Centerpoint Advisory Group | 64,239 | -6.69 | 5,529 | 8.84 | ||||
| 2025-08-11 | 13F | Private Advisor Group, LLC | 247,015 | 36.92 | 21,261 | 59.71 | ||||
| 2025-08-12 | 13F | Global Retirement Partners, LLC | 23,753 | 151.38 | 2,044 | 167.19 | ||||
| 2025-07-17 | 13F | Sound Income Strategies, LLC | 53 | 0.00 | 5 | 33.33 | ||||
| 2025-07-30 | 13F | Crewe Advisors LLC | 1,771 | 103.56 | 152 | 137.50 | ||||
| 2025-08-13 | 13F | Correct Capital Wealth Management | 954,568 | 14.52 | 82,160 | 33.58 | ||||
| 2025-07-31 | 13F | Schneider Downs Wealth Management Advisors, LP | 19,865 | -5.72 | 1,710 | 9.97 | ||||
| 2025-08-04 | 13F | IFG Advisory, LLC | 49,781 | 163.74 | 4,285 | 207.76 | ||||
| 2025-08-11 | 13F | Citigroup Inc | 0 | -100.00 | 0 | |||||
| 2025-08-13 | 13F | Continuum Advisory, LLC | 0 | -100.00 | 0 | |||||
| 2025-08-12 | 13F | Tradition Wealth Management, LLC | 173,036 | 3.41 | 14,893 | 20.62 | ||||
| 2025-08-12 | 13F | AlphaCore Capital LLC | 308,986 | 68.81 | 26,594 | 96.91 | ||||
| 2025-07-30 | 13F | LGT Financial Advisors LLC | 347 | 3.27 | 30 | 20.83 | ||||
| 2025-07-31 | 13F | Oppenheimer & Co Inc | 3,880 | 27.88 | 334 | 49.33 | ||||
| 2025-08-11 | 13F | Synergy Investment Management, LLC | 0 | -100.00 | 0 | |||||
| 2025-08-14 | 13F | D. E. Shaw & Co., Inc. | 30,477 | 346.42 | 2,623 | 421.47 | ||||
| 2025-08-06 | 13F | Vestmark Advisory Solutions, Inc. | 1,100,250 | 162.10 | 94,699 | 205.71 | ||||
| 2025-07-09 | 13F | Fermata Advisors, LLC | 20,692 | -2.42 | 1,781 | 13.81 | ||||
| 2025-07-18 | 13F | Truist Financial Corp | 62,601 | 6.59 | 5,388 | 24.35 | ||||
| 2025-07-22 | 13F | DAVENPORT & Co LLC | 4,276 | 12.38 | 368 | 31.43 | ||||
| 2025-08-14 | 13F | Synovus Financial Corp | 9,192 | 106.75 | 791 | 141.16 | ||||
| 2025-08-14 | 13F | Two Sigma Investments, Lp | 462,300 | 39,790 | ||||||
| 2025-07-14 | 13F | Opal Wealth Advisors, LLC | 733 | 29.05 | 63 | 53.66 | ||||
| 2025-07-17 | 13F | LexAurum Advisors, LLC | 50,919 | 24.60 | 4,383 | 45.34 | ||||
| 2025-04-17 | 13F | Dynamic Advisor Solutions LLC | 0 | -100.00 | 0 | |||||
| 2025-05-15 | 13F/A | Orion Portfolio Solutions, LLC | 3,018 | 223 | ||||||
| 2025-08-14 | 13F | Mercer Global Advisors Inc /adv | 2,555 | 220 | ||||||
| 2025-07-25 | 13F | Envestnet Portfolio Solutions, Inc. | 17,964 | 19.89 | 1,546 | 39.91 | ||||
| 2025-08-05 | 13F | GPS Wealth Strategies Group, LLC | 3,288 | -39.91 | 283 | -30.02 | ||||
| 2025-08-05 | 13F | Bank of New York Mellon Corp | 509,168 | 0.89 | 43,824 | 17.68 | ||||
| 2025-08-08 | 13F | Kingsview Wealth Management, LLC | 33,842 | 11.43 | 2,913 | 29.94 | ||||
| 2025-07-30 | 13F | Advantage Trust Co | 272,979 | 0.32 | 23,495 | 17.01 | ||||
| 2025-08-04 | 13F | Arkadios Wealth Advisors | 3,277 | 282 | ||||||
| 2025-08-13 | 13F | Cary Street Partners Financial Llc | 460,101 | 10.87 | 39,601 | 29.33 | ||||
| 2025-08-01 | 13F | Ashton Thomas Private Wealth, LLC | 25,560 | 0.53 | 2,200 | 17.22 | ||||
| 2025-08-12 | 13F | Proequities, Inc. | 0 | 0 | ||||||
| 2025-07-29 | 13F | Stratos Wealth Partners, LTD. | 477,584 | 7.78 | 41,106 | 25.72 | ||||
| 2025-07-21 | 13F | Ascent Group, LLC | 18,988 | 19.75 | 1,634 | 39.66 | ||||
| 2025-07-07 | 13F | Trust Co | 402,834 | -0.08 | 34,672 | 16.55 | ||||
| 2025-08-11 | 13F | Brown Brothers Harriman & Co | 2,737 | 236 | ||||||
| 2025-07-30 | 13F | D.a. Davidson & Co. | 144,104 | -3.07 | 12,403 | 13.06 | ||||
| 2025-07-16 | 13F | Stephenson National Bank & Trust | 480,283 | 0.67 | 41,338 | 17.43 | ||||
| 2025-08-12 | 13F/A | Cozad Asset Management Inc | 9,173 | -10.61 | 790 | 4.23 | ||||
| 2025-08-14 | 13F | Heritage Wealth Management, Inc. | 12,817 | 157.68 | 1,103 | 200.54 | ||||
| 2025-07-23 | 13F | True Vision MN LLC | 5,466 | -29.93 | 470 | -18.26 | ||||
| 2025-07-10 | 13F | Exchange Traded Concepts, Llc | 71,280 | 24.53 | 6,135 | 45.28 | ||||
| 2025-08-19 | 13F | National Asset Management, Inc. | 14,059 | 90.22 | 1,210 | 102.34 | ||||
| 2025-07-02 | 13F | Crumly & Associates Inc. | 336,112 | 18.74 | 28,929 | 38.51 | ||||
| 2025-07-25 | 13F | Cwm, Llc | 1,434,707 | 7.50 | 123 | 25.51 | ||||
| 2025-07-22 | 13F | Confluence Wealth Services, Inc. | 7,968 | 4.40 | 686 | 25.23 | ||||
| 2025-08-14 | 13F | Bank Of America Corp /de/ | 1,610,252 | 9.54 | 138,594 | 27.76 | ||||
| 2025-08-01 | 13F | Private Wealth Partners, LLC | 21,350 | -43.75 | 1,838 | -34.39 | ||||
| 2025-08-04 | 13F | Assetmark, Inc | 398 | -0.50 | 34 | 17.24 | ||||
| 2025-08-12 | 13F | Gladstone Institutional Advisory LLC | 5,851 | 25.67 | 504 | 46.65 | ||||
| 2025-08-13 | 13F | Renaissance Technologies Llc | 10,100 | -37.65 | 869 | -27.28 | ||||
| 2025-07-16 | 13F | Beaumont Financial Advisors, LLC | 344,487 | 35.72 | 29,650 | 58.31 | ||||
| 2025-08-14 | 13F | Guardian Wealth Advisors, Llc / Nc | 91 | 0.00 | 8 | 16.67 | ||||
| 2025-08-11 | 13F | Principal Securities, Inc. | 2,365 | 36.86 | 204 | 45.00 | ||||
| 2025-08-08 | 13F | Larson Financial Group LLC | 150 | 0.00 | 13 | 9.09 | ||||
| 2025-08-14 | 13F | Qube Research & Technologies Ltd | 32,806 | 36.91 | 2,824 | 59.67 | ||||
| 2025-08-12 | 13F | Argent Trust Co | 51,313 | 11.86 | 4,417 | 30.50 | ||||
| 2025-08-12 | 13F | Steward Partners Investment Advisory, Llc | 8,767 | 12.92 | 755 | 31.82 | ||||
| 2025-07-18 | 13F | Cooper Financial Group | 4,297 | -1.20 | 370 | 15.31 | ||||
| 2025-07-18 | 13F | Foundry Financial Group, Inc. | 63,512 | -0.15 | 5,466 | 16.47 | ||||
| 2025-08-12 | 13F | Change Path, LLC | 71,188 | 14.38 | 6,127 | 33.43 | ||||
| 2025-08-14 | 13F | Arete Wealth Advisors, LLC | 4,249 | 0 | ||||||
| 2025-07-14 | 13F | Strategic Planning Group, Llc | 164,823 | -7.98 | 14,186 | 7.33 | ||||
| 2025-08-12 | 13F | Founders Financial Alliance, LLC | 1,617 | -49.74 | 139 | -41.35 | ||||
| 2025-07-25 | 13F | Yarger Wealth Strategies, Llc | 56,783 | 6.33 | 4,887 | 24.04 | ||||
| 2025-08-14 | 13F | Goldman Sachs Group Inc | 4,687 | 403 | ||||||
| 2025-07-22 | 13F | Firethorn Wealth Partners, Llc | 6,811 | 33.50 | 586 | 55.85 | ||||
| 2025-08-05 | 13F | Westside Investment Management, Inc. | 3,627 | 0.00 | 308 | 14.50 | ||||
| 2025-08-06 | 13F | AE Wealth Management LLC | 934 | 240.88 | 80 | 300.00 | ||||
| 2025-07-09 | 13F | Massmutual Trust Co Fsb/adv | 25,525 | 17.63 | 2,197 | 37.16 | ||||
| 2025-07-16 | 13F | Cambridge Advisors Inc. | 15,478 | -4.96 | 1,332 | 10.91 | ||||
| 2025-07-30 | 13F | Strategic Blueprint, LLC | 96,902 | 3.42 | 8,340 | 20.64 | ||||
| 2025-08-14 | 13F | Susquehanna International Group, Llp | 8,632 | -92.60 | 743 | -91.38 | ||||
| 2025-08-05 | 13F | Aurdan Capital Management, LLC | 38,095 | 25.12 | 3,279 | 45.95 | ||||
| 2025-07-11 | 13F | SILVER OAK SECURITIES, Inc | 2,518 | -45.83 | 217 | -36.84 | ||||
| 2025-07-29 | 13F | Empirical Asset Management, LLC | 2,594 | 223 | ||||||
| 2025-08-01 | 13F | Brookwood Investment Group LLC | 0 | -100.00 | 0 | |||||
| 2025-08-29 | 13F | Total Investment Management Inc | 345 | 30 | ||||||
| 2025-08-12 | 13F | BlackRock, Inc. | 226 | 0.00 | 19 | 18.75 | ||||
| 2025-08-15 | 13F | Captrust Financial Advisors | 3,634,474 | 7.80 | 312,819 | 25.74 | ||||
| 2025-08-15 | 13F | Provenance Wealth Advisors, LLC | 173,389 | -53.33 | 14,924 | -45.56 | ||||
| 2025-07-16 | 13F | ORG Partners LLC | 12,977 | 1,103 | ||||||
| 2025-07-09 | 13F | Christopher J. Hasenberg, Inc | 128 | 11 | ||||||
| 2025-07-10 | 13F | High Net Worth Advisory Group LLC | 8,006 | -0.44 | 689 | 16.19 | ||||
| 2025-07-14 | 13F | AdvisorNet Financial, Inc | 6,715 | 56.24 | 578 | 82.02 | ||||
| 2025-08-08 | 13F | Nixon Peabody Trust Co | 29,053 | 45.19 | 2,501 | 69.38 | ||||
| 2025-08-13 | 13F | Capital Analysts, Inc. | 2,120 | 202.86 | 0 | |||||
| 2025-08-07 | 13F | Resources Investment Advisors, LLC. | 11,289 | 4.48 | 972 | 21.83 | ||||
| 2025-08-08 | 13F | Pnc Financial Services Group, Inc. | 169,217 | 11.63 | 14,565 | 30.21 | ||||
| 2025-08-18 | 13F | Geneos Wealth Management Inc. | 129,751 | 24.72 | 11,168 | 45.48 | ||||
| 2025-08-13 | 13F | Trustmark National Bank Trust Department | 3,000 | 258 | ||||||
| 2025-07-08 | 13F | Parallel Advisors, LLC | 1,300 | 0.00 | 112 | 16.84 | ||||
| 2025-08-13 | 13F | Colonial Trust Co / SC | 1,418 | 0.00 | 122 | 17.31 | ||||
| 2025-08-14 | 13F | Mml Investors Services, Llc | 212,241 | 11.81 | 18 | 28.57 | ||||
| 2025-08-14 | 13F | UBS Group AG | 1,308,437 | 14.32 | 112,617 | 33.34 | ||||
| 2025-08-14 | 13F | Stifel Financial Corp | 393,129 | 22.48 | 33,837 | 42.86 | ||||
| 2025-08-19 | 13F | Advisory Services Network, LLC | 4,844 | -0.33 | 428 | 19.27 | ||||
| 2025-08-08 | 13F | Fortis Group Advisors, LLC | 17,611 | -6.98 | 1,556 | 11.39 | ||||
| 2025-07-23 | 13F | Valmark Advisers, Inc. | 9,116 | 785 | ||||||
| 2025-08-12 | 13F | Resolute Wealth Strategies, LLC | 40,547 | 8.09 | 3,490 | 26.05 | ||||
| 2025-08-14 | 13F | Marshall Investment Management, Llc | 0 | -100.00 | 0 | |||||
| 2025-08-27 | NP | JNL SERIES TRUST - JNL iShares Tactical Moderate Fund (A) | 70,333 | -0.01 | 6,054 | 16.63 | ||||
| 2025-07-09 | 13F | Keystone Wealth Services, LLC | 21,438 | -14.00 | 1,845 | 0.33 | ||||
| 2025-09-03 | 13F | American Trust | 455,183 | 6.56 | 39,178 | 24.30 | ||||
| 2025-09-04 | 13F/A | Advisor Group Holdings, Inc. | 850,587 | 47.12 | 73,216 | 71.60 | ||||
| 2025-08-14 | 13F | Coppell Advisory Solutions LLC | 0 | -100.00 | 0 | |||||
| 2025-08-11 | 13F/A | Purus Wealth Management, LLC | 31,990 | 1.03 | 2,753 | 17.85 | ||||
| 2025-08-01 | 13F | Rossby Financial, LCC | 424 | 0.00 | 36 | 16.13 | ||||
| 2025-08-08 | 13F | Hartland & Co., LLC | 10,038 | 0.00 | 864 | 16.62 | ||||
| 2025-04-23 | 13F | Mascagni Wealth Management, Inc. | 0 | -100.00 | 0 | -100.00 | ||||
| 2025-08-05 | 13F | Bank Of Montreal /can/ | 17,378 | 1,496 | ||||||
| 2025-07-18 | 13F | PFG Investments, LLC | 2,492 | 214 | ||||||
| 2025-08-01 | 13F | Winebrenner Capital Management Llc | 2,366 | 204 | ||||||
| 2025-08-15 | 13F | Morgan Stanley | 7,543 | 97.31 | 649 | 130.14 | ||||
| 2025-07-18 | 13F | New Wave Wealth Advisors Llc | 9,661 | 39.49 | 832 | 62.62 | ||||
| 2025-07-25 | 13F | Northwest Capital Management Inc | 495 | 28.24 | 43 | 50.00 | ||||
| 2025-08-14 | 13F | GWM Advisors LLC | 86,738 | -9.63 | 7,466 | 5.41 | ||||
| 2025-08-12 | 13F | Trexquant Investment LP | 2,335 | 201 | ||||||
| 2025-07-11 | 13F | Orrstown Financial Services Inc | 199,937 | 2.07 | 17,209 | 19.06 | ||||
| 2025-08-06 | 13F | Prospera Financial Services Inc | 42,910 | 3.16 | 3,693 | 20.33 | ||||
| 2025-08-11 | 13F | Wealthspire Advisors, LLC | 3,668 | -2.26 | 316 | 14.13 | ||||
| 2025-07-15 | 13F | Axis Wealth Partners, LLC | 12,742 | 4.17 | 1,097 | 21.51 | ||||
| 2025-08-07 | 13F | Lakeridge Wealth Management LLC | 7,433 | 3.80 | 640 | 21.02 | ||||
| 2025-08-11 | 13F | Nations Financial Group Inc, /ia/ /adv | 14,586 | 24.35 | 1,255 | 45.09 | ||||
| 2025-08-07 | 13F | Nwam Llc | 5,192 | 8.28 | 457 | 29.46 | ||||
| 2025-08-07 | 13F | Allworth Financial LP | 1,118 | 0.00 | 96 | 17.07 | ||||
| 2025-08-14 | 13F | Menora Mivtachim Holdings Ltd. | 75,791 | 55.08 | 6,523 | 80.89 | ||||
| 2025-08-15 | 13F | Kestra Advisory Services, LLC | 184,197 | -14.99 | 15,854 | -0.84 | ||||
| 2025-07-14 | 13F | Cobblestone Asset Management LLC | 11,019 | 6.68 | 948 | 24.41 | ||||
| 2025-05-14 | 13F | Blue Investment Partners LLC | 0 | -100.00 | 0 | |||||
| 2025-08-12 | 13F | Cornerstone Wealth Management, LLC | 16,621 | 1,431 | ||||||
| 2025-05-12 | 13F | Sandy Spring Bank | 3 | 0.00 | 0 | |||||
| 2025-08-14 | 13F | Integrated Investment Consultants, LLC | 2,582 | 222 | ||||||
| 2025-07-17 | 13F | Nelson, Van Denburg & Campbell Wealth Management Group, LLC | 849,065 | 7.86 | 73,079 | 25.81 | ||||
| 2025-07-28 | 13F | WealthPlan Investment Management, LLC | 15,621 | 1,344 | ||||||
| 2025-08-13 | 13F | VestGen Advisors, LLC | 8,949 | -5.44 | 790 | 13.18 | ||||
| 2025-08-04 | 13F | Daymark Wealth Partners, Llc | 356,989 | 9.86 | 30,726 | 28.14 | ||||
| 2025-08-06 | 13F | Commonwealth Equity Services, Llc | 1,434,332 | 21.20 | 123 | 41.38 | ||||
| 2025-07-22 | 13F | Echo Wealth Management, LLC | 50,365 | 6.90 | 4,335 | 24.68 | ||||
| 2025-08-11 | 13F | Platform Technology Partners | 6,500 | 0.00 | 559 | 16.70 | ||||
| 2025-07-10 | 13F | YHB Investment Advisors, Inc. | 4,282 | 4.39 | 369 | 21.85 | ||||
| 2025-08-11 | 13F | Perennial Investment Advisors, LLC | 24,891 | 15.47 | 2,142 | 34.72 | ||||
| 2025-07-11 | 13F | Sprinkle Financial Consultants LLC | 129,759 | 26.66 | 11,169 | 47.74 | ||||
| 2025-07-25 | 13F | Bill Few Associates, Inc. | 15,913 | 1,370 | ||||||
| 2025-08-13 | 13F | Twin Peaks Wealth Advisors, LLC | 8,946 | 2.11 | 806 | 28.34 | ||||
| 2025-07-28 | 13F | Arlington Financial Advisors, LLC | 182,309 | 6.99 | 15,691 | 24.80 | ||||
| 2025-08-27 | NP | JNL SERIES TRUST - JNL iShares Tactical Moderate Growth Fund (I) | 164,907 | -0.24 | 14,194 | 16.36 | ||||
| 2025-07-24 | 13F | 3Chopt Investment Partners, LLC | 14,969 | 0.70 | 1,288 | 17.52 | ||||
| 2025-08-01 | 13F/A | GGM Financials LLC | 556,436 | 4.44 | 47,892 | 21.82 | ||||
| 2025-08-26 | 13F | Nautilus Advisors LLC | 4,389 | 4.65 | 378 | 22.01 | ||||
| 2025-04-25 | 13F | TBH Global Asset Management, LLC | 0 | -100.00 | 0 | |||||
| 2025-07-29 | 13F | Stephens Inc /ar/ | 55,281 | 19.25 | 4,758 | 39.12 | ||||
| 2025-08-15 | 13F | CI Private Wealth, LLC | 22,814 | 454.14 | 1,964 | 547.85 | ||||
| 2025-07-31 | 13F | Carnegie Capital Asset Management, LLC | 16,003 | -5.44 | 1,377 | 21.75 | ||||
| 2025-07-10 | 13F | Sovran Advisors, LLC | 9,124 | 13.03 | 782 | 38.23 | ||||
| 2025-07-21 | 13F | Ameriflex Group, Inc. | 105 | -65.00 | 9 | -63.64 | ||||
| 2025-07-17 | 13F | Janney Montgomery Scott LLC | 1,487,290 | 16.04 | 128 | 36.17 | ||||
| 2025-07-16 | 13F | John W. Brooker & Co., CPAs | 17,410 | -83.39 | 1,502 | -80.58 | ||||
| 2025-07-24 | 13F | Robertson Stephens Wealth Management, LLC | 0 | -100.00 | 0 | |||||
| 2025-08-08 | 13F/A | Ignite Planners, LLC | 7,646 | 10.00 | 666 | 26.62 | ||||
| 2025-07-29 | 13F | Signature Estate & Investment Advisors Llc | 37,507 | 60.03 | 3,228 | 86.70 | ||||
| 2025-08-14 | 13F | TCG Advisory Services, LLC | 309,405 | 10.16 | 26,630 | 28.49 | ||||
| 2025-08-05 | 13F | Key FInancial Inc | 0 | -100.00 | 0 | |||||
| 2025-08-12 | 13F | J.w. Cole Advisors, Inc. | 17,427 | 2.89 | 1,500 | 20.02 | ||||
| 2025-08-13 | 13F | Northwestern Mutual Wealth Management Co | 3,268 | 143.34 | 281 | 183.84 | ||||
| 2025-08-05 | 13F | Fourth Dimension Wealth, LLC | 2,900 | 1.75 | 250 | 18.57 | ||||
| 2025-07-10 | 13F | Guided Capital Wealth Management, LLC | 87,618 | -0.73 | 7,541 | 15.80 | ||||
| 2025-07-23 | 13F | HMV Wealth Advisors, LLC | 0 | -100.00 | 0 | |||||
| 2025-08-08 | 13F | Keyvantage Wealth, Llc | 164,064 | 5.17 | 14,121 | 22.67 | ||||
| 2025-04-21 | 13F | Hartford Financial Management Inc. | 0 | -100.00 | 0 | |||||
| 2025-08-05 | 13F | 5T Wealth, LLC | 25,011 | -2.28 | 2,153 | 13.98 | ||||
| 2025-08-14 | 13F | Integrated Wealth Concepts LLC | 114,391 | 12.23 | 9,846 | 30.90 | ||||
| 2025-08-08 | 13F | Intrua Financial, LLC | 4,936 | 10.23 | 425 | 28.48 | ||||
| 2025-08-01 | 13F | Motco | 39,605 | 3,498 | ||||||
| 2025-07-31 | 13F | Cambridge Investment Research Advisors, Inc. | 137,680 | 12.61 | 12 | 22.22 | ||||
| 2025-08-13 | 13F | Allegheny Financial Group LTD | 11,869 | 1,022 | ||||||
| 2025-08-13 | 13F | Bare Financial Services, Inc | 118 | 10 | ||||||
| 2025-08-14 | 13F | Fmr Llc | 38,073 | 55,078.26 | 3,277 | 65,420.00 | ||||
| 2025-04-29 | 13F | Financial Network Wealth Management LLC | 1,828 | 0 | ||||||
| 2025-07-22 | 13F | Sutton Place Investors Llc | 11,074 | 0.02 | 953 | 16.65 | ||||
| 2025-07-30 | 13F | Drive Wealth Management, Llc | 10,546 | 93.90 | 908 | 126.18 | ||||
| 2025-08-12 | 13F | O'shaughnessy Asset Management, Llc | 190 | -70.95 | 16 | -66.67 | ||||
| 2025-08-13 | 13F | Smith, Moore & Co. | 29,998 | -61.25 | 2,582 | -54.81 | ||||
| 2025-08-14 | 13F | Mariner, LLC | 289,128 | -15.21 | 24,885 | -1.10 | ||||
| 2025-07-25 | 13F | Atria Wealth Solutions, Inc. | 12,849 | -52.15 | 1,106 | -44.22 | ||||
| 2025-07-02 | 13F | Capital Market Strategies LLC | 3,584 | 308 | ||||||
| 2025-07-10 | 13F | Sterling Financial Group, Inc. | 354,535 | 0.73 | 30,515 | 17.49 | ||||
| 2025-07-24 | 13F | Us Bancorp \de\ | 1,983 | 510.15 | 171 | 639.13 | ||||
| 2025-07-23 | 13F | Clear Creek Financial Management, LLC | 15,219 | 11.28 | 1,310 | 29.73 | ||||
| 2025-08-07 | 13F | Fagan Associates, Inc. | 4,652 | 4.77 | 400 | 22.32 | ||||
| 2025-08-14 | 13F | Jane Street Group, Llc | 64,698 | 5,569 | ||||||
| 2025-07-25 | 13F | Apollon Wealth Management, LLC | 7,872 | 0.00 | 678 | 16.72 | ||||
| 2025-08-13 | 13F | WCG Wealth Advisors LLC | 378,412 | 4.74 | 32,570 | 22.17 | ||||
| 2025-08-04 | 13F | Flagship Harbor Advisors, Llc | 20,614 | -77.60 | 1,774 | -73.88 | ||||
| 2025-08-13 | 13F | Cary Street Partner Investment Advisory Llc | 10,267 | -1.12 | 884 | 15.27 | ||||
| 2025-07-11 | 13F | First PREMIER Bank | 5,543 | 0 | ||||||
| 2025-07-28 | 13F | Harbour Investments, Inc. | 3,766 | -38.28 | 324 | -28.00 | ||||
| 2025-08-11 | 13F | HighTower Advisors, LLC | 268,109 | 4.86 | 23,076 | 22.31 | ||||
| 2025-08-06 | 13F | First Horizon Advisors, Inc. | 24 | -57.14 | 2 | -50.00 | ||||
| 2025-08-27 | NP | ADVANCED SERIES TRUST - AST T. Rowe Price Growth Opportunities Portfolio | 2,327,054 | -14.14 | 200,290 | 0.15 | ||||
| 2025-07-23 | 13F | Morey & Quinn Wealth Partners, LLC | 21,267 | 252.39 | 1,830 | 311.24 | ||||
| 2025-07-29 | 13F | Goldstein Advisors, LLC | 654,261 | -8.34 | 56,312 | 6.92 | ||||
| 2025-08-13 | 13F | Greenwich Wealth Management LLC | 0 | -100.00 | 0 | |||||
| 2025-08-14 | 13F | CoreCap Advisors, LLC | 449 | 39 | ||||||
| 2025-07-16 | 13F | Blue Oak Capital, LLC | 32,881 | 1.47 | 2,830 | 18.36 | ||||
| 2025-08-27 | NP | JNL SERIES TRUST - JNL iShares Tactical Growth Fund (A) | 270,878 | 0.59 | 23,314 | 17.33 | ||||
| 2025-08-18 | 13F | Tyler-Stone Wealth Management | 50,832 | -0.09 | 4,375 | 16.54 | ||||
| 2025-08-13 | 13F | Marshall Wace, Llp | 29,707 | 2,557 | ||||||
| 2025-07-16 | 13F | Perigon Wealth Management, LLC | 54,675 | 9.34 | 4,706 | 27.54 | ||||
| 2025-07-30 | 13F | Wbh Advisory Inc | 15,860 | 1,365 | ||||||
| 2025-08-14 | 13F | Wells Fargo & Company/mn | 174,998 | 19,025.46 | 15,062 | 22,380.60 | ||||
| 2025-07-17 | 13F | MBA Advisors LLC | 2,844 | 0.00 | 245 | 16.75 | ||||
| 2025-08-14 | 13F | Wiley Bros.-aintree Capital, Llc | 2,790 | 240 | ||||||
| 2025-05-07 | 13F | Objective Capital Management, LLC | 0 | -100.00 | 0 | |||||
| 2025-07-08 | 13F | Nbc Securities, Inc. | 95 | 0.00 | 0 | |||||
| 2025-07-21 | 13F | Ameritas Advisory Services, LLC | 2,488 | -72.90 | 214 | -69.38 | ||||
| 2025-08-04 | 13F | Spire Wealth Management | 199 | 14.37 | 17 | 41.67 | ||||
| 2025-07-21 | 13F | Patriot Financial Group Insurance Agency, LLC | 47,644 | -5.45 | 4,101 | 10.27 | ||||
| 2025-08-06 | 13F | Wedbush Securities Inc | 6,063 | 6.03 | 1 | |||||
| 2025-08-14 | 13F | Ameriprise Financial Inc | 4,144,956 | -3.65 | 356,676 | 12.36 | ||||
| 2025-08-01 | 13F | Ferguson Shapiro LLC | 0 | -100.00 | 0 | |||||
| 2025-08-11 | 13F | Aptus Capital Advisors, LLC | 768 | 0.00 | 66 | 17.86 | ||||
| 2025-08-12 | 13F | Riverstone Advisors, LLC | 3,198 | 275 | ||||||
| 2025-08-14 | 13F | Empire Life Investments Inc. | 33,000 | -30.67 | 2,841 | -19.04 | ||||
| 2025-07-17 | 13F | Park Place Capital Corp | 5,107 | 0.00 | 434 | 15.43 | ||||
| 2025-08-07 | 13F | Rollins Financial Advisors, LLC | 4,691 | 404 | ||||||
| 2025-08-14 | 13F | Citadel Advisors Llc | 26,717 | 44.71 | 2,300 | 68.80 | ||||
| 2025-08-06 | 13F | Nvwm, Llc | 4,015 | 0.38 | 346 | 16.95 | ||||
| 2025-08-14 | 13F | Snowden Capital Advisors LLC | 11,143 | -0.26 | 959 | 16.38 | ||||
| 2025-08-14 | 13F | Great Valley Advisor Group, Inc. | 540,013 | -17.80 | 46,479 | -4.12 | ||||
| 2025-08-14 | 13F | Fort Point Capital Partners LLC | 25,639 | 7.65 | 2,207 | 25.55 | ||||
| 2025-08-14 | 13F | Comerica Bank | 5,524 | 16.10 | 475 | 35.33 | ||||
| 2025-08-15 | 13F | Equitable Holdings, Inc. | 39,770 | 2.19 | 3,423 | 19.23 | ||||
| 2025-08-12 | 13F | LPL Financial LLC | 5,512,288 | 24.90 | 474,443 | 45.69 | ||||
| 2025-08-14 | 13F | Visionary Wealth Advisors | 53,965 | -13.46 | 4,645 | 0.93 | ||||
| 2025-08-01 | 13F | Envestnet Asset Management Inc | 912,802 | -14.02 | 78,565 | 0.29 | ||||
| 2025-07-22 | 13F | Wealthcare Advisory Partners LLC | 40,952 | 4.46 | 3,525 | 21.85 | ||||
| 2025-08-11 | 13F | Western Wealth Management, LLC | 4,303 | 8.58 | 370 | 26.71 | ||||
| 2025-08-27 | 13F | Barnes Wealth Management Group, Inc | 10,053 | 0.96 | 865 | 17.85 | ||||
| 2025-07-16 | 13F | Formidable Asset Management, LLC | 51,185 | 0.00 | 3,777 | 0.00 | ||||
| 2025-08-04 | 13F | Pensionmark Financial Group, Llc | 4,105 | 0.00 | 353 | 16.89 | ||||
| 2025-07-17 | 13F | Wagner Wealth Management, Llc | 184,640 | 9.04 | 15,892 | 27.18 | ||||
| 2025-08-06 | 13F | Summit Wealth & Retirement Planning, Inc. | 2,835 | 0.00 | 244 | 16.75 | ||||
| 2025-08-12 | 13F | Financial Advocates Investment Management | 172,395 | -7.27 | 14,838 | 8.17 | ||||
| 2025-08-08 | 13F | SBI Securities Co., Ltd. | 86 | 19.44 | 7 | 40.00 | ||||
| 2025-08-04 | 13F | Savvy Advisors, Inc. | 4,987 | 429 | ||||||
| 2025-07-10 | 13F | Atticus Wealth Management, Llc | 7,179 | 618 | ||||||
| 2025-08-07 | 13F | Kestra Private Wealth Services, Llc | 43,692 | 15.88 | 3,761 | 35.15 | ||||
| 2025-08-08 | 13F | Cetera Investment Advisers | 298,238 | 20.13 | 25,669 | 40.13 | ||||
| 2025-08-15 | 13F | Tower Research Capital LLC (TRC) | 6,648 | 572 | ||||||
| 2025-08-12 | 13F | Barnes Pettey Financial Advisors, Llc | 3,185 | 274 | ||||||
| 2025-07-15 | 13F | MCF Advisors LLC | 270 | 0.00 | 23 | 21.05 | ||||
| 2025-08-27 | NP | Advanced Series Trust - Ast J.p. Morgan Strategic Opportunities Portfolio | 2,254,109 | 0.00 | 194,011 | 16.64 | ||||
| 2025-07-09 | 13F | Heritage Wealth Architects, Inc. | 6,900 | 10.95 | 594 | 29.48 | ||||
| 2025-07-22 | 13F | USAdvisors Wealth Management, LLC | 10,427 | 21.75 | 1 | |||||
| 2025-08-14 | 13F | Modern Wealth Management, LLC | 63,207 | 1.25 | 5,440 | 18.11 | ||||
| 2025-07-07 | 13F | Thurston, Springer, Miller, Herd & Titak, Inc. | 22,808 | 870.97 | 1,963 | 1,034.68 | ||||
| 2025-07-22 | 13F | Belpointe Asset Management LLC | 25,313 | 0.93 | 2,179 | 17.73 | ||||
| 2025-07-31 | 13F | Oak Harbor Wealth Partners, Llc | 9,367 | 9.34 | 806 | 27.53 | ||||
| 2025-08-13 | 13F | Jones Financial Companies Lllp | 1,757,166 | 85.99 | 150,185 | 115.70 | ||||
| 2025-08-13 | 13F | Townsquare Capital Llc | 0 | -100.00 | 0 | |||||
| 2025-08-14 | 13F/A | Rockefeller Capital Management L.P. | 17,874 | -39.05 | 1,538 | -28.90 | ||||
| 2025-08-11 | 13F | Lake Street Financial Llc | 14,643 | 6.48 | 1,260 | 24.26 | ||||
| 2025-08-12 | 13F | Frontier Asset Management, LLC | 284,833 | 45.79 | 24,516 | 70.05 | ||||
| 2025-07-17 | 13F | Greenbush Financial Group, LLC | 105,408 | -11.19 | 9,073 | 3.59 | ||||
| 2025-07-25 | 13F | Hazlett, Burt & Watson, Inc. | 0 | -100.00 | 0 | |||||
| 2025-08-14 | 13F | Beaird Harris Wealth Management, LLC | 466 | 40 | ||||||
| 2025-08-13 | 13F | GeoWealth Management, LLC | 7,183 | 33.09 | 618 | 55.28 | ||||
| 2025-08-14 | 13F | Raymond James Financial Inc | 1,534,344 | 3.06 | 132,061 | 20.21 | ||||
| 2025-08-05 | 13F | Strategic Financial Concepts, LLC | 38,411 | 12.66 | 3,306 | 31.45 | ||||
| 2025-08-14 | 13F | Smartleaf Asset Management LLC | 102 | 0.00 | 9 | 14.29 | ||||
| 2025-08-06 | 13F | Atlantic Union Bankshares Corp | 53 | 5 | ||||||
| 2025-07-24 | 13F | IFP Advisors, Inc | 37,362 | 18.19 | 3,216 | 37.86 | ||||
| 2025-07-30 | 13F | Whittier Trust Co Of Nevada Inc | 1,414 | 2.46 | 122 | 19.80 | ||||
| 2025-06-26 | NP | FLCE - Frontier Asset U.S. Large Cap Equity ETF | 62,640 | 9.43 | 4,694 | -2.00 | ||||
| 2025-07-11 | 13F | Farther Finance Advisors, LLC | 9,353 | 15.55 | 805 | 33.78 | ||||
| 2025-07-16 | 13F/A | CX Institutional | 187 | 0 | ||||||
| 2025-07-18 | 13F | Broadway Wealth Solutions, Inc. | 41,413 | 3,564 | ||||||
| 2025-07-21 | 13F | Triad Wealth Partners, LLC | 29,144 | 179.59 | 2,508 | 226.14 | ||||
| 2025-08-27 | 13F/A | Brinker Capital Investments, LLC | 3,541 | 17.33 | 305 | 36.94 | ||||
| 2025-08-14 | 13F | Colony Group, LLC | 601,943 | 2.83 | 51,809 | 19.94 | ||||
| 2025-08-08 | 13F | Comprehensive Financial Planning, Inc./PA | 29,150 | 37.38 | 2,509 | 60.26 | ||||
| 2025-08-08 | 13F | Creative Planning | 3,055 | -3.78 | 263 | 11.97 | ||||
| 2025-08-27 | NP | ADVANCED SERIES TRUST - AST J.P. Morgan Global Thematic Portfolio | 1,541,438 | 0.00 | 132,672 | 16.64 | ||||
| 2025-07-17 | 13F | Venture Visionary Partners LLC | 208,850 | 9.52 | 17,976 | 27.75 | ||||
| 2025-08-08 | 13F | Avantax Advisory Services, Inc. | 18,928 | 22.75 | 1,629 | 43.27 | ||||
| 2025-08-14 | 13F | IHT Wealth Management, LLC | 20,198 | -23.11 | 1,738 | -10.32 | ||||
| 2025-08-14 | 13F | Royal Bank Of Canada | 951,812 | -14.60 | 81,923 | -0.39 | ||||
| 2025-07-10 | 13F | Wealth Enhancement Advisory Services, Llc | 754,876 | 140.09 | 65,282 | 181.38 | ||||
| 2025-07-29 | 13F | Private Trust Co Na | 6,635 | 22.67 | 571 | 43.11 | ||||
| 2025-07-16 | 13F | Essex Financial Services, Inc. | 4,098 | -19.62 | 353 | -6.38 | ||||
| 2025-08-13 | 13F | Kuhn & Co Investment Counsel | 4,808 | 0.00 | 414 | 16.67 | ||||
| 2025-07-31 | 13F | Moloney Securities Asset Management, LLC | 20,107 | 1,731 | ||||||
| 2025-07-21 | 13F | Cliftonlarsonallen Wealth Advisors, Llc | 32,894 | 2,831 | ||||||
| 2025-08-13 | 13F | Natixis Advisors, L.p. | 32,164 | 122.53 | 3 | 100.00 | ||||
| 2025-08-18 | 13F | N.E.W. Advisory Services LLC | 0 | -100.00 | 0 | |||||
| 2025-07-29 | 13F | International Assets Investment Management, Llc | 4,223 | 50.82 | 363 | 76.21 | ||||
| 2025-07-16 | 13F | Kennedy Investment Group | 2,531 | 218 | ||||||
| 2025-07-25 | 13F | We Are One Seven, LLC | 60,959 | 64.17 | 5,247 | 91.53 | ||||
| 2025-08-13 | 13F | EverSource Wealth Advisors, LLC | 1,333 | -66.07 | 115 | -60.55 | ||||
| 2025-07-24 | 13F | rebel Financial LLC | 38,379 | 3,303 |