Mga Batayang Estadistika
| Pemilik Institusional | 315 total, 315 long only, 0 short only, 0 long/short - change of -3.94% MRQ |
| Alokasi Portofolio Rata-rata | 0.4470 % - change of -11.76% MRQ |
| Saham Institusional (Jangka Panjang) | 16,249,648 (ex 13D/G) - change of -4.53MM shares -21.74% MRQ |
| Nilai Institusional (Jangka Panjang) | $ 1,651,170 USD ($1000) |
Kepemilikan Institusional dan Pemegang Saham
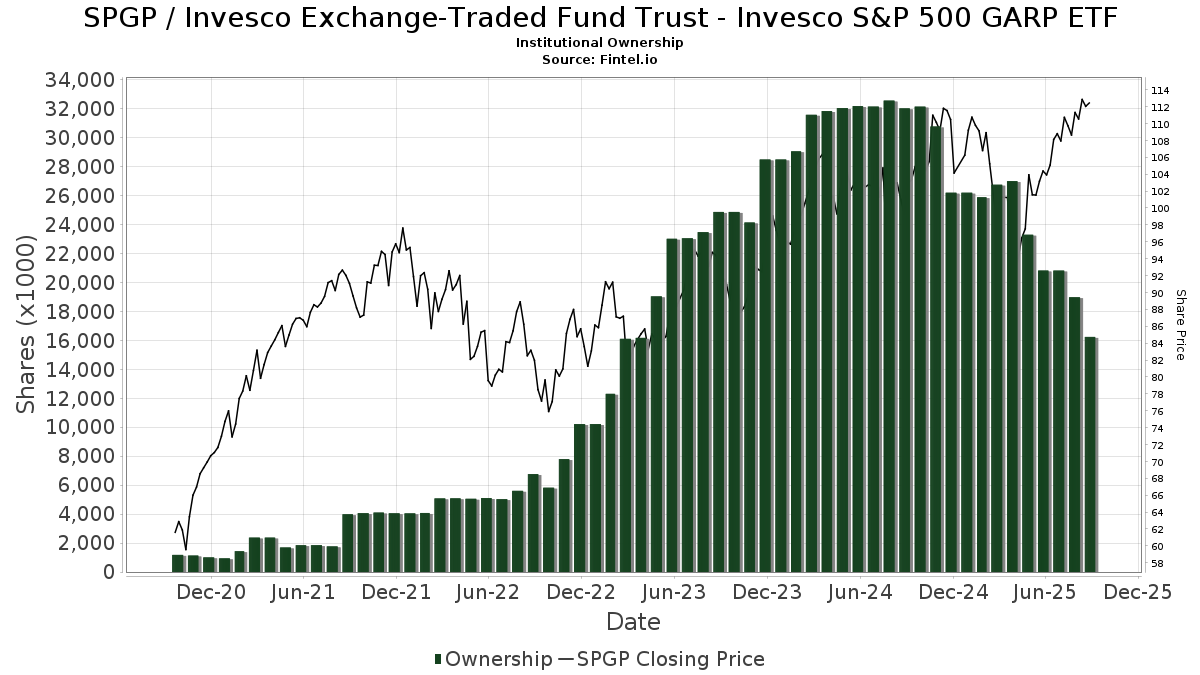
Invesco Exchange-Traded Fund Trust - Invesco S&P 500 GARP ETF (US:SPGP) memiliki 315 pemilik institusional dan pemegang saham yang telah mengajukan formulir 13D/G atau 13F kepada Komisi Bursa Efek (Securities Exchange Commission/SEC). Lembaga-lembaga ini memegang total 16,249,648 saham. Pemegang saham terbesar meliputi Morgan Stanley, LPL Financial LLC, Raymond James Financial Inc, Bank Of America Corp /de/, Northwestern Mutual Wealth Management Co, Fifth Third Bancorp, Commonwealth Equity Services, Llc, Howard Financial Services, Ltd., Wells Fargo & Company/mn, and UBS Group AG .
Struktur kepemilikan institusional Invesco Exchange-Traded Fund Trust - Invesco S&P 500 GARP ETF (ARCA:SPGP) menunjukkan posisi terkini di perusahaan oleh institusi dan dana, serta perubahan terbaru dalam ukuran posisi. Pemegang saham utama dapat mencakup investor individu, reksa dana, dana lindung nilai, atau institusi. Jadwal 13D menunjukkan bahwa investor memegang (atau pernah memegang) lebih dari 5% saham perusahaan dan bermaksud (atau pernah bermaksud) untuk secara aktif mengejar perubahan strategi bisnis. Jadwal 13G menunjukkan investasi pasif lebih dari 5%.
The share price as of September 3, 2025 is 112.03 / share. Previously, on September 4, 2024, the share price was 101.01 / share. This represents an increase of 10.91% over that period.
Skor Sentimen Dana
Skor Sentimen Dana (sebelumnya dikenal sebagai Skor Akumulasi Kepemilikan) menemukan saham-saham yang paling banyak dibeli oleh dana. Ini adalah hasil dari model kuantitatif multi-faktor yang canggih yang mengidentifikasi perusahaan dengan tingkat akumulasi institusional tertinggi. Model penilaian menggunakan kombinasi dari total peningkatan pemilik yang diungkapkan, perubahan dalam alokasi portofolio pada pemilik tersebut, dan metrik lainnya. Angka berkisar dari 0 hingga 100, dengan angka yang lebih tinggi menunjukkan tingkat akumulasi yang lebih tinggi dibandingkan dengan perusahaan sejenisnya, dan 50 adalah rata-ratanya.
Frekuensi Pembaruan: Setiap Hari
Lihat Ownership Explorer, yang menyediakan daftar perusahaan dengan peringkat tertinggi.
Rasio Put/Call Institusional
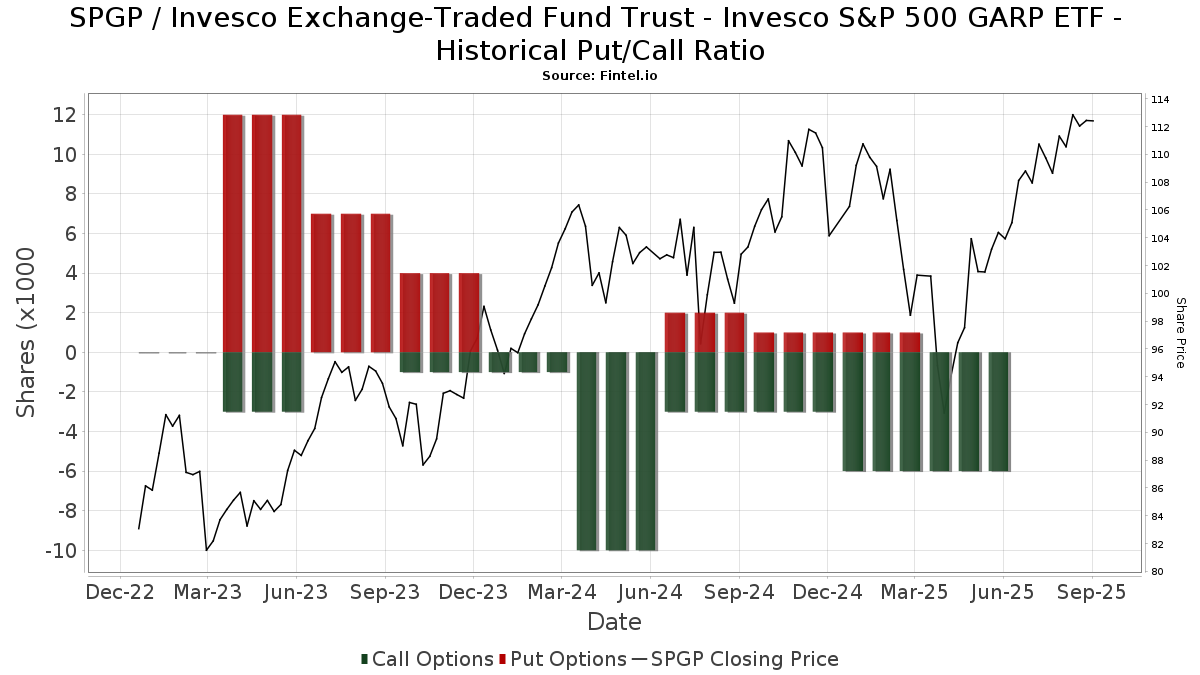
Selain melaporkan isu ekuitas dan utang standar, institusi dengan aset di bawah manajemen lebih dari 100 juta dolar AS juga harus mengungkapkan kepemilikan opsi put dan call mereka. Karena opsi put umumnya menunjukkan sentimen negatif, dan opsi call menunjukkan sentimen positif, kita dapat mengetahui sentimen institusional secara keseluruhan dengan memplot rasio put terhadap call. Grafik di sebelah kanan memplot rasio put/call historis untuk instrumen ini.
Menggunakan Rasio Put/Call sebagai indikator sentimen investor mengatasi salah satu kekurangan utama dari penggunaan total kepemilikan institusional, yaitu sejumlah besar aset yang dikelola diinvestasikan secara pasif untuk melacak indeks. Dana yang dikelola secara pasif biasanya tidak membeli opsi, sehingga indikator rasio put/call lebih akurat dalam melacak sentimen dana yang dikelola secara aktif.
Pengajuan 13F dan NPORT
Detail pada pengajuan 13F tersedia gratis. Detail pada pengajuan NP memerlukan keanggotaan premium. Baris berwarna hijau menunjukkan posisi baru. Baris berwarna merah menunjukkan posisi yang sudah ditutup. Klik tautan ini ikon untuk melihat riwayat transaksi selengkapnya.
Tingkatkan
untuk membuka data premium dan mengekspor ke Excel ![]() .
.
| Tanggal File | Sumber | Investor | Ketik | Presyo ng Avg (Silangan) |
Saham | Δ Saham (%) |
Dilaporkan Nilai ($1000) |
Nilai Δ (%) |
Alokasi Port (%) |
|
|---|---|---|---|---|---|---|---|---|---|---|
| 2025-05-28 | 13F | Silicon Valley Capital Partners | 192,261 | -61.12 | 19,042 | -63.29 | ||||
| 2025-08-11 | 13F | Aptus Capital Advisors, LLC | 449 | -39.49 | 48 | -35.14 | ||||
| 2025-07-25 | 13F | Prostatis Group LLC | 6,764 | -37.21 | 728 | -32.34 | ||||
| 2025-07-25 | 13F | Fifth Third Wealth Advisors LLC | 2,926 | -3.75 | 315 | 3.96 | ||||
| 2025-08-08 | 13F | Hudock, Inc. | 43,704 | 19.42 | 4,707 | 28.76 | ||||
| 2025-08-14 | 13F | EP Wealth Advisors, Inc. | 1,962 | -11.26 | 211 | -4.09 | ||||
| 2025-08-14 | 13F | Quantinno Capital Management LP | 5,457 | 1.54 | 588 | 9.51 | ||||
| 2025-08-14 | 13F | Operose Advisors LLC | 9 | 0.00 | 1 | |||||
| 2025-07-23 | 13F | Schrum Private Wealth Management LLC | 6,241 | 0.00 | 672 | 7.87 | ||||
| 2025-08-12 | 13F | Change Path, LLC | 6,447 | -8.76 | 694 | -1.56 | ||||
| 2025-08-01 | 13F | Transcend Wealth Collective, Llc | 18,036 | 0.24 | 1,942 | 8.07 | ||||
| 2025-08-12 | 13F | Financial Advocates Investment Management | 0 | -100.00 | 0 | |||||
| 2025-08-14 | 13F | Herold Advisors, Inc. | 5,141 | -5.58 | 554 | 1.65 | ||||
| 2025-08-11 | 13F | HighTower Advisors, LLC | 103,126 | -34.93 | 11,107 | -29.84 | ||||
| 2025-08-12 | 13F | Franklin Resources Inc | 315 | 34 | ||||||
| 2025-08-14 | 13F | Citadel Advisors Llc | Put | 0 | -100.00 | 0 | -100.00 | |||
| 2025-08-14 | 13F | Mercer Global Advisors Inc /adv | 4,471 | -17.26 | 482 | -10.76 | ||||
| 2025-08-14 | 13F | Comerica Bank | 5,489 | -6.11 | 591 | 1.37 | ||||
| 2025-08-06 | 13F | Founders Financial Securities Llc | 0 | -100.00 | 0 | |||||
| 2025-08-07 | 13F | WESCAP Management Group, Inc. | 116,570 | -12.27 | 12,555 | -5.40 | ||||
| 2025-08-08 | 13F | Financial Gravity Companies, Inc. | 134 | -80.94 | 14 | -80.82 | ||||
| 2025-07-15 | 13F | Avaii Wealth Management, Llc | 8,226 | -8.46 | 886 | -1.34 | ||||
| 2025-07-16 | 13F | BankPlus Wealth Management LLC | 2,164 | -11.96 | 233 | -4.90 | ||||
| 2025-08-15 | 13F | Equitable Holdings, Inc. | 36,193 | -29.39 | 3,898 | -23.87 | ||||
| 2025-08-01 | 13F | First Command Advisory Services, Inc. | 730 | 4.29 | 79 | 13.04 | ||||
| 2025-08-05 | 13F | Scarborough Advisors, LLC | 1,412 | 152 | ||||||
| 2025-08-08 | 13F | MTM Investment Management, LLC | 95 | 0.00 | 10 | 11.11 | ||||
| 2025-07-18 | 13F | First United Bank Trust/ | 48,021 | -10.29 | 5,172 | -3.27 | ||||
| 2025-08-18 | 13F | Finward Bancorp | 34,402 | -1.17 | 3,705 | 6.59 | ||||
| 2025-08-12 | 13F | O'shaughnessy Asset Management, Llc | 96 | -3.03 | 10 | 11.11 | ||||
| 2025-04-25 | 13F | Spinnaker Trust | 0 | -100.00 | 0 | |||||
| 2025-08-06 | 13F | Centerpoint Advisory Group | 7,508 | 8.37 | 809 | 16.93 | ||||
| 2025-04-28 | 13F | Private Trust Co Na | 0 | -100.00 | 0 | |||||
| 2025-05-01 | 13F | Steel Peak Wealth Management LLC | 0 | -100.00 | 0 | |||||
| 2025-07-02 | 13F | Howard Financial Services, Ltd. | 346,178 | -2.32 | 37,283 | 5.33 | ||||
| 2025-07-31 | 13F | Glass Jacobson Investment Advisors llc | 4,137 | 38.78 | 446 | 42.63 | ||||
| 2025-08-12 | 13F | LPL Financial LLC | 2,241,807 | -12.33 | 241,443 | -5.47 | ||||
| 2025-07-07 | 13F | Thurston, Springer, Miller, Herd & Titak, Inc. | 263 | 0.00 | 28 | 7.69 | ||||
| 2025-08-12 | 13F | Archer Investment Corp | 758 | 0.00 | 82 | 8.00 | ||||
| 2025-08-13 | 13F | Continuum Advisory, LLC | 0 | -100.00 | 0 | |||||
| 2025-07-29 | 13F | Elevation Capital Advisory, LLC | 27,285 | 10.24 | 2,939 | 18.85 | ||||
| 2025-08-06 | 13F | New Millennium Group LLC | 0 | 0 | ||||||
| 2025-08-21 | 13F | Aveo Capital Partners, LLC | 0 | -100.00 | 0 | |||||
| 2025-05-08 | 13F | Collaborative Wealth Managment Inc. | 0 | -100.00 | 0 | |||||
| 2025-07-14 | 13F | Opal Wealth Advisors, LLC | 3,573 | -19.03 | 385 | -12.73 | ||||
| 2025-07-22 | 13F | Iron Horse Wealth Management, LLC | 0 | -100.00 | 0 | |||||
| 2025-08-06 | 13F | Financial Alternatives, Inc | 13,431 | -0.14 | 1,447 | 7.67 | ||||
| 2025-08-15 | 13F | Kestra Advisory Services, LLC | 30,361 | -58.00 | 3,270 | -54.72 | ||||
| 2025-04-30 | 13F | Sofos Investments, Inc. | 134 | -87.87 | 13 | -88.50 | ||||
| 2025-07-21 | 13F | Phraction Management LLC | 6,710 | -14.08 | 723 | -7.44 | ||||
| 2025-08-12 | 13F | Richard W. Paul & Associates, LLC | 112 | 8.74 | 12 | 20.00 | ||||
| 2025-08-15 | 13F | Puff Wealth Management, Llc | 3,100 | -1.15 | 334 | 6.39 | ||||
| 2025-07-30 | 13F | Fairway Wealth LLC | 2,262 | 86.17 | 243 | 101.67 | ||||
| 2025-08-11 | 13F | Citigroup Inc | 178 | -82.95 | 19 | -81.73 | ||||
| 2025-07-29 | 13F | Liberty Square Wealth Partners Llc | 2,645 | -28.07 | 285 | -22.62 | ||||
| 2025-08-11 | 13F | Perennial Investment Advisors, LLC | 143,220 | -37.80 | 15,425 | -32.93 | ||||
| 2025-07-31 | 13F | CAP Partners, LLC | 2,426 | 5.02 | 261 | 13.48 | ||||
| 2025-08-13 | 13F | Capital Analysts, Inc. | 1,135 | 0.00 | 0 | |||||
| 2025-07-11 | 13F | SILVER OAK SECURITIES, Inc | 32,063 | 50.84 | 3,453 | 64.04 | ||||
| 2025-08-12 | 13F/A | Cozad Asset Management Inc | 52,220 | -8.17 | 5,624 | -0.97 | ||||
| 2025-08-14 | 13F | Synovus Financial Corp | 9,010 | -68.19 | 971 | -65.71 | ||||
| 2025-07-21 | 13F | Ameritas Advisory Services, LLC | 914 | -80.17 | 98 | -79.63 | ||||
| 2025-07-23 | 13F | Opulen Financial Group LLC | 3,337 | 0.18 | 359 | 8.13 | ||||
| 2025-08-12 | 13F | Walled Lake Planning & Wealth Management, Llc | 6,321 | -11.12 | 681 | -4.23 | ||||
| 2025-08-13 | 13F | Townsquare Capital Llc | 4,548 | -36.03 | 490 | -31.13 | ||||
| 2025-07-15 | 13F | CHB Investment Group, LLC | 25,038 | -0.10 | 3 | 0.00 | ||||
| 2025-08-12 | 13F | J.w. Cole Advisors, Inc. | 14,090 | 0.22 | 1,517 | 8.05 | ||||
| 2025-07-16 | 13F | Moisand Fitzgerald Tamayo, LLC | 180 | 0.00 | 19 | 11.76 | ||||
| 2025-08-12 | 13F | Proequities, Inc. | 0 | 0 | ||||||
| 2025-05-01 | 13F | Quest 10 Wealth Builders, Inc. | 0 | -100.00 | 0 | |||||
| 2025-08-14 | 13F | Money Concepts Capital Corp | 45,075 | -36.31 | 4,855 | -31.32 | ||||
| 2025-07-30 | 13F | Principle Wealth Partners Llc | 112,944 | -5.46 | 12,164 | 1.94 | ||||
| 2025-08-08 | 13F | Hartland & Co., LLC | 39,718 | 9.96 | 4,278 | 18.57 | ||||
| 2025-08-13 | 13F | Northern Trust Corp | 3,432 | 0.00 | 370 | 7.89 | ||||
| 2025-07-22 | 13F | Merit Financial Group, LLC | 2,817 | 6.83 | 303 | 15.21 | ||||
| 2025-08-20 | 13F/A | Coppell Advisory Solutions LLC | 8,041 | 859 | ||||||
| 2025-08-11 | 13F | Tidemark, LLC | 251 | -41.90 | 27 | -37.21 | ||||
| 2025-08-07 | 13F | Nwam Llc | 25,858 | 3.11 | 2,837 | 13.30 | ||||
| 2025-04-18 | 13F | Lion Street Advisors, LLC | 0 | -100.00 | 0 | |||||
| 2025-07-24 | 13F | IFP Advisors, Inc | 4,169 | -13.67 | 449 | -6.85 | ||||
| 2025-08-05 | 13F | Tme Financial, Inc. | 26,452 | -49.11 | 2,849 | -45.14 | ||||
| 2025-07-10 | 13F | Capital Advisory Group Advisory Services, LLC | 3,461 | -17.58 | 373 | -11.22 | ||||
| 2025-08-13 | 13F | Northwestern Mutual Wealth Management Co | 590,258 | -0.47 | 63,571 | 7.32 | ||||
| 2025-08-13 | 13F/A | StoneX Group Inc. | 5,079 | 40.85 | 463 | 41.59 | ||||
| 2025-07-10 | 13F | Sovran Advisors, LLC | 49,588 | -30.64 | 5,377 | -18.80 | ||||
| 2025-07-21 | 13F | Ameriflex Group, Inc. | 28,742 | -32.20 | 3,058 | -27.78 | ||||
| 2025-07-11 | 13F | Farther Finance Advisors, LLC | 9,436 | -9.02 | 1,016 | -2.31 | ||||
| 2025-08-06 | 13F | Prospera Financial Services Inc | 7,154 | -33.99 | 772 | -28.72 | ||||
| 2025-08-11 | 13F | Principal Securities, Inc. | 96 | 10 | ||||||
| 2025-08-14 | 13F | Financial Network Wealth Advisors LLC | 928 | 0.00 | 100 | 7.61 | ||||
| 2025-07-25 | 13F | Retirement Planning Group, Llc / Ny | 9,026 | 3.97 | 972 | 12.11 | ||||
| 2025-08-14 | 13F | Bank Of America Corp /de/ | 1,026,478 | -12.26 | 110,552 | -5.39 | ||||
| 2025-08-15 | 13F | First Heartland Consultants, Inc. | 6,084 | 31.04 | 655 | 41.47 | ||||
| 2025-07-10 | 13F | Redhawk Wealth Advisors, Inc. | 16,143 | -22.27 | 1,739 | -16.20 | ||||
| 2025-08-06 | 13F | AE Wealth Management LLC | 1,332 | -27.17 | 143 | -21.43 | ||||
| 2025-08-13 | 13F | Cerity Partners LLC | 38,759 | 4,174 | ||||||
| 2025-08-29 | 13F | Evolution Wealth Management Inc. | 54 | 6 | ||||||
| 2025-04-30 | 13F | Stratos Wealth Advisors, LLC | 0 | -100.00 | 0 | -100.00 | ||||
| 2025-08-13 | 13F | Vermillion & White Wealth Management Group, LLC | 1,528 | 97.42 | 165 | 112.99 | ||||
| 2025-07-24 | 13F | Blair William & Co/il | 0 | -100.00 | 0 | |||||
| 2025-07-24 | 13F | Wealth Management Resources, Inc. | 11,403 | -35.76 | 1,228 | -30.74 | ||||
| 2025-08-14 | 13F | Wharton Business Group, LLC | 2,830 | 0.00 | 0 | |||||
| 2025-07-16 | 13F | West Branch Capital LLC | 2,459 | -1.76 | 265 | 5.60 | ||||
| 2025-05-06 | 13F | Lifeworks Advisors, LLC | 0 | -100.00 | 0 | |||||
| 2025-05-09 | 13F | North Ridge Wealth Advisors, Inc. | 0 | -100.00 | 0 | -100.00 | ||||
| 2025-08-12 | 13F | OneAscent Financial Services LLC | 9,944 | -33.48 | 1 | 0.00 | ||||
| 2025-08-14 | 13F | Susquehanna International Group, Llp | 9,026 | -85.43 | 972 | -84.29 | ||||
| 2025-08-04 | 13F | Creative Financial Designs Inc /adv | 817 | 0.25 | 88 | 8.64 | ||||
| 2025-08-08 | 13F | Cetera Investment Advisers | 47,688 | -20.17 | 5,136 | -13.93 | ||||
| 2025-08-14 | 13F/A | Barclays Plc | 2,297 | 0.00 | 0 | |||||
| 2025-08-14 | 13F | Visionary Wealth Advisors | 16,960 | 0.76 | 1,827 | 8.63 | ||||
| 2025-07-25 | 13F | Atria Wealth Solutions, Inc. | 90,906 | -0.97 | 9,833 | 7.24 | ||||
| 2025-08-11 | 13F | Advisor Resource Council | 0 | -100.00 | 0 | |||||
| 2025-08-12 | 13F | Integras Partners LLC | 4,169 | 25.91 | 449 | 35.76 | ||||
| 2025-07-21 | 13F | Empirical Financial Services, LLC d.b.a. Empirical Wealth Management | 2,885 | 0.00 | 311 | 7.64 | ||||
| 2025-07-10 | 13F | Kozak & Associates, Inc. | 227 | 0.44 | 25 | 20.00 | ||||
| 2025-08-13 | 13F | Per Stirling Capital Management, LLC. | 2,726 | -12.63 | 294 | -5.79 | ||||
| 2025-08-07 | 13F | CSM Advisors, LLC | 17,800 | -6.81 | 2 | 0.00 | ||||
| 2025-08-14 | 13F | Federation des caisses Desjardins du Quebec | 1,120 | 0.00 | 121 | 8.11 | ||||
| 2025-08-05 | 13F | Ring Mountain Capital, LLC | 15,761 | 3.27 | 1,715 | 12.53 | ||||
| 2025-07-17 | 13F | ERn Financial, LLC | 0 | -100.00 | 0 | |||||
| 2025-07-25 | 13F | Concurrent Investment Advisors, LLC | 3,116 | 11.48 | 336 | 20.07 | ||||
| 2025-08-15 | 13F | Morgan Stanley | 2,422,980 | -27.47 | 260,955 | -21.79 | ||||
| 2025-08-13 | 13F | Trustmark National Bank Trust Department | 4,000 | 0.00 | 431 | 7.77 | ||||
| 2025-07-21 | 13F | Monticello Wealth Management, Llc | 71,369 | -1.58 | 7,686 | 6.12 | ||||
| 2025-08-08 | 13F | D'Orazio & Associates, Inc. | 199,700 | -19.09 | 21,508 | -12.76 | ||||
| 2025-07-21 | 13F | Andina Capital Management, LLC | 2,934 | -51.73 | 316 | -48.11 | ||||
| 2025-05-15 | 13F | Millennium Management Llc | 0 | -100.00 | 0 | -100.00 | ||||
| 2025-07-16 | 13F | Perigon Wealth Management, LLC | 33,446 | 0.71 | 3,602 | 8.62 | ||||
| 2025-08-15 | 13F | Koesten, Hirschmann & Crabtree, INC. | 16 | 0.00 | 2 | 0.00 | ||||
| 2025-08-12 | 13F | CIBC Private Wealth Group, LLC | 650 | 56.63 | 70 | 97.14 | ||||
| 2025-07-29 | 13F | Latitude Advisors, LLC | 10,023 | -5.64 | 1,079 | 1.79 | ||||
| 2025-08-12 | 13F | Founders Financial Alliance, LLC | 0 | -100.00 | 0 | |||||
| 2025-07-21 | 13F | Investment Planning Advisors, Inc. | 8,852 | -2.73 | 953 | 4.96 | ||||
| 2025-07-31 | 13F | CVA Family Office, LLC | 2,390 | -13.47 | 257 | -6.55 | ||||
| 2025-08-01 | 13F | Envestnet Asset Management Inc | 85,635 | -67.00 | 9,223 | -64.42 | ||||
| 2025-08-14 | 13F | White Knight Strategic Wealth Advisors, LLC | 15,099 | -3.24 | 1,626 | 4.36 | ||||
| 2025-08-07 | 13F | PFG Advisors | 5,201 | -11.89 | 560 | -4.92 | ||||
| 2025-07-16 | 13F | ORG Partners LLC | 16,012 | 2.71 | 1,741 | 11.32 | ||||
| 2025-04-23 | 13F | Austin Asset Management Co Inc | 0 | -100.00 | 0 | |||||
| 2025-07-22 | 13F | Wealthcare Advisory Partners LLC | 182,430 | 8.47 | 19,648 | 16.97 | ||||
| 2025-08-13 | 13F | Brown Advisory Inc | 11,833 | 0.00 | 1,274 | 7.87 | ||||
| 2025-04-11 | 13F | Davis Capital Management | 103 | 0.98 | 10 | 0.00 | ||||
| 2025-05-12 | 13F | Independent Advisor Alliance | 0 | -100.00 | 0 | |||||
| 2025-08-14 | 13F | UBS Group AG | 238,144 | -39.19 | 25,648 | -34.43 | ||||
| 2025-08-01 | 13F | Gwn Securities Inc. | 0 | -100.00 | 0 | |||||
| 2025-08-08 | 13F | Thoroughbred Financial Services, Llc | 66,748 | -10.09 | 7 | 0.00 | ||||
| 2025-05-14 | 13F | Orion Portfolio Solutions, LLC | 2,410 | 0.00 | 253 | 0.00 | ||||
| 2025-08-12 | 13F | Jpmorgan Chase & Co | 47,601 | -45.94 | 5,127 | -41.71 | ||||
| 2025-08-08 | 13F | Pnc Financial Services Group, Inc. | 2,064 | 0.00 | 222 | 7.77 | ||||
| 2025-08-13 | 13F | Milestone Investment Advisors LLC | 27,216 | -5.18 | 2,931 | 2.27 | ||||
| 2025-08-12 | 13F | Cornerstone Wealth Management, LLC | 3,445 | 18.06 | 371 | 27.15 | ||||
| 2025-08-12 | 13F | Jacobi Capital Management LLC | 6,693 | 2.75 | 721 | 10.77 | ||||
| 2025-08-14 | 13F | Pine Harbor Wealth Management, LLC | 56,595 | -15.89 | 6,095 | -9.30 | ||||
| 2025-04-17 | 13F | Sound Income Strategies, LLC | 0 | -100.00 | 0 | |||||
| 2025-07-23 | 13F | Detalus Advisors, LLC | 1,961 | -9.21 | 211 | -1.86 | ||||
| 2025-07-30 | 13F | Strategic Blueprint, LLC | 29,601 | -19.38 | 3,188 | -13.06 | ||||
| 2025-08-14 | 13F | Warren Averett Asset Management, LLC | 8,636 | 5.51 | 930 | 13.83 | ||||
| 2025-07-15 | 13F | Verum Partners LLC | 3,044 | 0.33 | 328 | 7.92 | ||||
| 2025-07-28 | 13F | Sagespring Wealth Partners, Llc | 5,713 | -71.20 | 615 | -68.94 | ||||
| 2025-07-10 | 13F | Focus Financial Network, Inc. | 14,495 | -28.36 | 1,561 | -22.76 | ||||
| 2025-03-04 | 13F | Dogwood Wealth Management LLC | 0 | -100.00 | 0 | -100.00 | ||||
| 2025-07-08 | 13F | Arlington Trust Co LLC | 600 | 0.00 | 65 | 8.47 | ||||
| 2025-08-04 | 13F | Spire Wealth Management | 0 | -100.00 | 0 | |||||
| 2025-08-07 | 13F | Grange Capital, LLC | 119,837 | -28.12 | 12,906 | -22.50 | ||||
| 2025-07-18 | 13F | Trilogy Capital Inc. | 2,631 | -93.84 | 283 | -93.36 | ||||
| 2025-07-29 | NP | ORILX - NORTH SQUARE MULTI STRATEGY FUND CLASS A | 19,100 | 0.00 | 1,937 | -3.92 | ||||
| 2025-08-12 | 13F | Calton & Associates, Inc. | 6,157 | -69.25 | 663 | -66.83 | ||||
| 2025-08-14 | 13F | Two Sigma Securities, Llc | 5,263 | 35.05 | 567 | 45.50 | ||||
| 2025-08-04 | 13F | Bay Colony Advisory Group, Inc d/b/a Bay Colony Advisors | 3,818 | -12.97 | 411 | -5.30 | ||||
| 2025-08-13 | 13F | Jones Financial Companies Lllp | 117,539 | 15.46 | 12,561 | 24.60 | ||||
| 2025-07-09 | 13F | Baron Financial Group, LLC | 18,640 | 1.66 | 2,008 | 9.61 | ||||
| 2025-07-21 | 13F | DHJJ Financial Advisors, Ltd. | 38 | 0.00 | 4 | 33.33 | ||||
| 2025-08-04 | 13F | NBZ Investment Advisors LLC | 26,815 | -35.72 | 2,888 | -30.70 | ||||
| 2025-08-08 | 13F | Avantax Advisory Services, Inc. | 112,584 | 1.91 | 12,125 | 9.89 | ||||
| 2025-07-30 | 13F | Drive Wealth Management, Llc | 3,414 | 16.12 | 368 | 25.26 | ||||
| 2025-07-31 | 13F | Longview Financial Advisors, Inc. | 134,405 | 0.33 | 14,476 | 8.18 | ||||
| 2025-05-09 | 13F | Keeler THomas Management LLC | 0 | -100.00 | 0 | |||||
| 2025-08-06 | 13F | Wedbush Securities Inc | 1,885 | 0 | ||||||
| 2025-08-12 | 13F | WealthTrak Capital Management LLC | 10,722 | 3.91 | 1,155 | 12.04 | ||||
| 2025-08-13 | 13F | EverSource Wealth Advisors, LLC | 375 | 0.00 | 40 | 8.11 | ||||
| 2025-08-12 | 13F | Fairscale Capital, LLC | 3,724 | -4.05 | 406 | 4.65 | ||||
| 2025-07-29 | 13F | Signature Estate & Investment Advisors Llc | 4,529 | 0.29 | 488 | 7.98 | ||||
| 2025-07-18 | 13F | Truist Financial Corp | 65,833 | -7.03 | 7,090 | 0.25 | ||||
| 2025-08-01 | 13F | Brinker Capital Investments, LLC | 0 | -100.00 | 0 | -100.00 | ||||
| 2025-07-11 | 13F | Pinnacle Bancorp, Inc. | 312 | 0.32 | 34 | 6.45 | ||||
| 2025-08-14 | 13F | Smartleaf Asset Management LLC | 49 | 5 | ||||||
| 2025-08-26 | 13F/A | Thrivent Financial For Lutherans | 28,900 | 3 | ||||||
| 2025-07-17 | 13F | Independence Bank of Kentucky | 2,700 | 0.00 | 291 | 7.81 | ||||
| 2025-08-18 | 13F/A | National Bank Of Canada /fi/ | 530 | 0.00 | 57 | 9.62 | ||||
| 2025-05-12 | 13F | Savvy Advisors, Inc. | 0 | -100.00 | 0 | |||||
| 2025-07-23 | 13F | Richardson Capital Management LLC | 38 | 11.76 | 4 | 33.33 | ||||
| 2025-04-17 | 13F | Janney Montgomery Scott LLC | 0 | -100.00 | 0 | |||||
| 2025-08-14 | 13F | Snowden Capital Advisors LLC | 11,513 | -6.12 | 1,240 | 1.23 | ||||
| 2025-08-13 | 13F | Rsm Us Wealth Management Llc | 5,087 | -48.35 | 548 | -44.35 | ||||
| 2025-07-30 | 13F | Darrow Company, Inc. | 102,965 | 4.09 | 11,089 | 12.24 | ||||
| 2025-08-14 | 13F | Harwood Advisory Group, LLC | 2,093 | 5.81 | 225 | 8.70 | ||||
| 2025-08-12 | 13F | BlackRock, Inc. | 2,130 | 1,477.78 | 229 | 1,661.54 | ||||
| 2025-07-14 | 13F | Gries Financial Llc | 2,141 | -15.61 | 231 | -9.09 | ||||
| 2025-04-25 | 13F | Koshinski Asset Management, Inc. | 0 | -100.00 | 0 | -100.00 | ||||
| 2025-07-31 | 13F | Whipplewood Advisors, LLC | 5,061 | -81.58 | 545 | 15.71 | ||||
| 2025-08-12 | 13F | Investor's Fiduciary Advisor Network, LLC | 4,041 | -15.27 | 0 | |||||
| 2025-04-14 | 13F | Financial Designs Corp | 0 | -100.00 | 0 | |||||
| 2025-08-04 | 13F | Flagship Harbor Advisors, Llc | 80,507 | 16.90 | 8,671 | 26.05 | ||||
| 2025-08-08 | 13F | Gts Securities Llc | 5,280 | 569 | ||||||
| 2025-05-12 | 13F | Sandy Spring Bank | 376 | -66.61 | 38 | -68.64 | ||||
| 2025-07-23 | 13F | Eagle Strategies LLC | 37,384 | -35.80 | 4,026 | -30.78 | ||||
| 2025-07-10 | 13F | Wealth Enhancement Advisory Services, Llc | 95,846 | -32.51 | 10,443 | -26.37 | ||||
| 2025-07-25 | 13F | Cwm, Llc | 6,125 | -2.17 | 1 | |||||
| 2025-08-13 | 13F | GeoWealth Management, LLC | 0 | -100.00 | 0 | |||||
| 2025-08-14 | 13F | Bnp Paribas Arbitrage, Sa | 60,291 | 6,493 | ||||||
| 2025-07-10 | 13F | Contravisory Investment Management, Inc. | 25 | 0.00 | 3 | 0.00 | ||||
| 2025-08-01 | 13F | Integral Investment Advisors, Inc. | 12,269 | 2.72 | 1,321 | 10.82 | ||||
| 2025-08-14 | 13F | Qube Research & Technologies Ltd | 22 | 2 | ||||||
| 2025-07-15 | 13F | Armis Advisers, LLC | 6,054 | 11.31 | 660 | 25.76 | ||||
| 2025-08-11 | 13F | TD Waterhouse Canada Inc. | 13 | -23.53 | 1 | 0.00 | ||||
| 2025-07-17 | 13F | Keystone Global Partners, LLC | 30 | -98.57 | 3 | -98.56 | ||||
| 2025-07-09 | 13F | Summit Financial Consulting LLC | 3,064 | -0.62 | 330 | 7.17 | ||||
| 2025-04-21 | 13F | Nelson, Van Denburg & Campbell Wealth Management Group, LLC | 0 | -100.00 | 0 | |||||
| 2025-08-12 | 13F | Clearwater Capital Advisors, LLC | 2,391 | -2.96 | 258 | 4.47 | ||||
| 2025-05-15 | 13F | Smith, Moore & Co. | 0 | -100.00 | 0 | |||||
| 2025-07-15 | 13F | Beacon Financial Planning, Inc | 18,109 | -16.50 | 1,950 | -9.97 | ||||
| 2025-08-15 | 13F | Manhattan West Asset Management, LLC | 0 | -100.00 | 0 | |||||
| 2025-07-14 | 13F | GAMMA Investing LLC | 237 | 0.00 | 26 | 8.70 | ||||
| 2025-08-05 | 13F | Key FInancial Inc | 0 | -100.00 | 0 | |||||
| 2025-08-11 | 13F | Private Advisor Group, LLC | 57,779 | -10.02 | 6,223 | -2.98 | ||||
| 2025-07-18 | 13F | PFG Investments, LLC | 0 | -100.00 | 0 | |||||
| 2025-07-17 | 13F | Genesis Private Wealth, Llc | 31,072 | 4.16 | 3,346 | 12.32 | ||||
| 2025-07-23 | 13F | REAP Financial Group, LLC | 0 | 0 | ||||||
| 2025-08-13 | 13F | Renaissance Technologies Llc | 4,800 | -80.49 | 517 | -79.00 | ||||
| 2025-07-14 | 13F | Iams Wealth Management, Llc | 3,416 | -9.92 | 368 | -2.91 | ||||
| 2025-07-17 | 13F | Barry Investment Advisors, LLC | 6,527 | 0.25 | 703 | 8.00 | ||||
| 2025-07-15 | 13F | Alhambra Investment Partners LLC | 50,432 | 1.77 | 5,432 | 9.74 | ||||
| 2025-07-25 | 13F | Midwest Capital Advisors, LLC | 100 | 0.00 | 11 | 11.11 | ||||
| 2025-07-30 | 13F | Liberty One Investment Management, Llc | 67,656 | 1.37 | 7,287 | 9.32 | ||||
| 2025-08-12 | 13F | Steward Partners Investment Advisory, Llc | 8,251 | -3.60 | 889 | 3.98 | ||||
| 2025-07-30 | 13F | Retirement Planning Group | 215,392 | -26.66 | 23,198 | -20.92 | ||||
| 2025-07-30 | 13F | Wbh Advisory Inc | 8,225 | -27.21 | 886 | -21.54 | ||||
| 2025-08-14 | 13F | Modern Wealth Management, LLC | 32,689 | 1.27 | 3,521 | 9.18 | ||||
| 2025-05-05 | 13F | Transce3nd, LLC | 0 | -100.00 | 0 | |||||
| 2025-07-28 | 13F | Copia Wealth Management | 155 | 96.20 | 17 | 128.57 | ||||
| 2025-07-22 | 13F | Belpointe Asset Management LLC | 5,978 | -18.54 | 644 | -12.28 | ||||
| 2025-08-04 | 13F | Pensionmark Financial Group, Llc | 27,951 | -45.42 | 3,010 | -41.14 | ||||
| 2025-08-05 | 13F | Simplex Trading, Llc | 0 | -100.00 | 0 | |||||
| 2025-08-12 | 13F | PKS Advisory Services, LLC | 2,717 | -1.38 | 293 | 6.18 | ||||
| 2025-07-30 | 13F | Brookstone Capital Management | 8,574 | 16.64 | 923 | 25.75 | ||||
| 2025-08-07 | 13F | 49 Wealth Management, Llc | 2,162 | -66.11 | 233 | -63.58 | ||||
| 2025-07-15 | 13F | Oxinas Partners Wealth Management LLC | 9,723 | -3.30 | 1,047 | 4.28 | ||||
| 2025-07-28 | 13F | Mutual Advisors, LLC | 9,420 | -4.31 | 1,046 | 10.58 | ||||
| 2025-07-09 | 13F | Bank of New Hampshire | 6,895 | -12.67 | 743 | -5.84 | ||||
| 2025-07-17 | 13F | Catalytic Wealth RIA, LLC | 41,356 | -9.91 | 4,454 | -2.86 | ||||
| 2025-08-14 | 13F | BancorpSouth Bank | 2,281 | 0.00 | 246 | 7.93 | ||||
| 2025-08-08 | 13F | TD Capital Management LLC | 78 | 0.00 | 8 | 14.29 | ||||
| 2025-08-14 | 13F | Foronjy Financial Llc | 16,945 | 1,825 | ||||||
| 2025-07-22 | 13F | Grimes & Company, Inc. | 2,722 | -1.38 | 293 | 6.55 | ||||
| 2025-07-29 | 13F | International Assets Investment Management, Llc | 4,672 | -7.89 | 503 | -0.59 | ||||
| 2025-08-14 | 13F | Jane Street Group, Llc | 25,999 | 2,800 | ||||||
| 2025-07-29 | 13F | Planned Solutions, Inc. | 12,039 | -87.84 | 1,297 | -86.89 | ||||
| 2025-08-13 | 13F | IAG Wealth Partners, LLC | 407 | 0.00 | 44 | 7.50 | ||||
| 2025-07-30 | 13F | Evermay Wealth Management Llc | 140 | -30.00 | 15 | -21.05 | ||||
| 2025-08-06 | 13F | Commonwealth Equity Services, Llc | 359,303 | -3.19 | 39 | 2.70 | ||||
| 2025-08-07 | 13F | Resources Investment Advisors, LLC. | 2,101 | 226 | ||||||
| 2025-08-15 | 13F | Tower Research Capital LLC (TRC) | 11,593 | -20.82 | 1,249 | -14.64 | ||||
| 2025-07-31 | 13F | Leavell Investment Management, Inc. | 4,495 | -43.10 | 484 | -38.66 | ||||
| 2025-07-01 | 13F | Private Client Services, Llc | 0 | -100.00 | 0 | |||||
| 2025-08-14 | 13F | GWM Advisors LLC | 37,329 | -42.26 | 4,020 | -37.74 | ||||
| 2025-07-17 | 13F | Park Place Capital Corp | 109 | 0.00 | 12 | 10.00 | ||||
| 2025-07-15 | 13F | Santori & Peters, Inc. | 50,239 | 0.09 | 5,411 | 7.92 | ||||
| 2025-08-14 | 13F | CoreCap Advisors, LLC | 281 | -58.37 | 30 | -55.22 | ||||
| 2025-07-25 | 13F | Hobbs Group Advisors, LLC | 4,773 | -42.37 | 514 | -37.85 | ||||
| 2025-05-05 | 13F | Formidable Asset Management, LLC | 0 | -100.00 | 0 | |||||
| 2025-08-08 | 13F | Larson Financial Group LLC | 280 | 0.00 | 30 | 11.11 | ||||
| 2025-07-18 | 13F | Institute for Wealth Management, LLC. | 4,767 | -16.43 | 513 | -9.84 | ||||
| 2025-08-08 | 13F | Campbell Deegan Wealth Management, LLC | 185,634 | 5.84 | 19,993 | 14.12 | ||||
| 2025-08-14 | 13F | Wells Fargo & Company/mn | 267,048 | -54.57 | 28,761 | -51.02 | ||||
| 2025-07-17 | 13F | Johnson & White Wealth Management, LLC | 40,681 | 1.14 | 4 | 0.00 | ||||
| 2025-08-04 | 13F | Assetmark, Inc | 203 | -67.42 | 22 | -66.13 | ||||
| 2025-07-17 | 13F | Wagner Wealth Management, Llc | 2,004 | -18.70 | 216 | -12.60 | ||||
| 2025-08-11 | 13F | Rothschild Investment Llc | 1,396 | 0.00 | 150 | 7.91 | ||||
| 2025-07-31 | 13F | Cambridge Investment Research Advisors, Inc. | 121,134 | -58.98 | 13 | -55.17 | ||||
| 2025-07-15 | 13F | MCF Advisors LLC | 1 | 0.00 | 0 | |||||
| 2025-08-12 | 13F | Edmond De Rothschild Holding S.a. | 13,880 | -23.54 | 1,495 | -17.60 | ||||
| 2025-08-14 | 13F | Great Valley Advisor Group, Inc. | 2,143 | -30.06 | 231 | -24.59 | ||||
| 2025-08-14 | 13F | Mml Investors Services, Llc | 90,073 | -3.74 | 10 | 0.00 | ||||
| 2025-08-05 | 13F | Bank Of Montreal /can/ | 2,349 | 50.10 | 253 | 61.54 | ||||
| 2025-08-14 | 13F | Raymond James Financial Inc | 1,129,577 | -22.10 | 121,655 | -16.00 | ||||
| 2025-08-14 | 13F | Royal Bank Of Canada | 128,218 | -23.87 | 13,809 | -17.91 | ||||
| 2025-08-14 | 13F | Fiduciary Trust Co | 2,105 | 0.00 | 227 | 7.62 | ||||
| 2025-07-11 | 13F | Kingstone Capital Partners Texas, LLC | 21,408 | 2 | ||||||
| 2025-08-05 | 13F | Obermeyer Wood Investment Counsel, Lllp | 6,764 | 24.09 | 728 | 33.82 | ||||
| 2025-08-18 | 13F | Geneos Wealth Management Inc. | 22,132 | -43.48 | 2,384 | -39.07 | ||||
| 2025-08-06 | 13F | Vestmark Advisory Solutions, Inc. | 1,935 | 208 | ||||||
| 2025-08-14 | 13F | Glen Eagle Advisors, LLC | 100 | 0.00 | 11 | 11.11 | ||||
| 2025-07-15 | 13F | SJS Investment Consulting Inc. | 0 | -100.00 | 0 | |||||
| 2025-07-15 | 13F | Fifth Third Bancorp | 545,151 | -45.95 | 58,713 | -41.72 | ||||
| 2025-07-30 | 13F | D.a. Davidson & Co. | 42,434 | 5.03 | 4,570 | 13.26 | ||||
| 2025-07-14 | 13F | Armstrong Advisory Group, Inc | 2,816 | -98.92 | 303 | -98.89 | ||||
| 2025-08-14 | 13F | Hilltop Holdings Inc. | 22,267 | -8.11 | 2,398 | -0.91 | ||||
| 2025-07-25 | 13F | Evolution Advisers, Inc. | 18 | 0.00 | 0 | |||||
| 2025-08-13 | 13F | Level Four Advisory Services, Llc | 2,055 | -8.95 | 221 | -1.78 | ||||
| 2025-08-12 | 13F | SRS Capital Advisors, Inc. | 505 | -28.17 | 54 | -22.86 | ||||
| 2025-09-04 | 13F | Beacon Capital Management, Inc. | 1 | 0 | ||||||
| 2025-07-16 | 13F | Signaturefd, Llc | 51 | 5 | ||||||
| 2025-07-25 | 13F | Sequoia Financial Advisors, LLC | 6,672 | -39.89 | 719 | -35.20 | ||||
| 2025-07-24 | 13F | Us Bancorp \de\ | 3,231 | -37.65 | 348 | -32.88 | ||||
| 2025-07-16 | 13F | Old North State Wealth Management, LLC | 2,252 | 0.36 | 243 | 8.04 | ||||
| 2025-07-15 | 13F | FLP Wealth Management, LLC | 0 | -100.00 | 0 | |||||
| 2025-08-05 | 13F | Sigma Planning Corp | 18,300 | 79.03 | 1,971 | 93.14 | ||||
| 2025-08-11 | 13F | Inspire Advisors, LLC | 15,606 | -9.79 | 1,681 | -2.72 | ||||
| 2025-08-12 | 13F | Coldstream Capital Management Inc | 0 | -100.00 | 0 | |||||
| 2025-07-09 | 13F | Sar Wealth Management Group, Llc | 2,346 | 0.00 | 253 | 7.69 | ||||
| 2025-07-17 | 13F | Fifth Third Securities, Inc. | 19,309 | 1.12 | 2,080 | 9.02 | ||||
| 2025-07-29 | 13F | Harbor Asset Planning, Inc. | 215 | 23 | ||||||
| 2025-08-07 | 13F | Commerce Bank | 3,230 | 18.32 | 348 | 27.57 | ||||
| 2025-08-14 | 13F | Hrt Financial Lp | 0 | -100.00 | 0 | |||||
| 2025-08-07 | 13F | Allworth Financial LP | 39,572 | -4.59 | 4,262 | 6.85 | ||||
| 2025-08-19 | 13F | Advisory Services Network, LLC | 9,984 | -59.62 | 1,088 | -55.97 | ||||
| 2025-08-14 | 13F | Fmr Llc | 5,209 | -24.45 | 561 | -18.46 | ||||
| 2025-07-08 | 13F | IAM Advisory, LLC | 0 | -100.00 | 0 | |||||
| 2025-09-04 | 13F/A | Advisor Group Holdings, Inc. | 176,789 | -12.46 | 19,046 | -5.61 | ||||
| 2025-08-01 | 13F | Austin Private Wealth, LLC | 5,459 | 6.29 | 588 | 14.65 | ||||
| 2025-07-31 | 13F | Oppenheimer & Co Inc | 32,246 | -3.32 | 3,473 | 4.23 | ||||
| 2025-08-12 | 13F | Global Retirement Partners, LLC | 181,620 | -8.41 | 19,560 | -5.95 | ||||
| 2025-07-17 | 13F | Venture Visionary Partners LLC | 3,575 | 385 | ||||||
| 2025-07-14 | 13F | Golden State Equity Partners | 0 | -100.00 | 0 | |||||
| 2025-08-12 | 13F | Spectrum Wealth Advisory Group, LLC | 16,420 | -0.59 | 1,768 | 7.22 | ||||
| 2025-08-14 | 13F | Mariner, LLC | 54,750 | 5.69 | 5,897 | 13.95 | ||||
| 2025-07-30 | 13F | Lionsbridge Wealth Management LLC | 0 | -100.00 | 0 | |||||
| 2025-08-04 | 13F | Atria Investments Llc | 13,338 | -34.58 | 1,437 | -29.47 | ||||
| 2025-08-08 | 13F | Citizens Financial Group Inc/ri | 3,969 | -79.24 | 427 | -77.63 | ||||
| 2025-07-22 | 13F | Hickory Asset Management, Inc. | 20,150 | -19.51 | 2,170 | -13.20 | ||||
| 2025-08-06 | 13F | Csenge Advisory Group | 8,253 | -0.79 | 837 | 8.70 | ||||
| 2025-08-14 | 13F | Goldman Sachs Group Inc | 75,002 | 71.65 | 8,078 | 85.08 | ||||
| 2025-08-14 | 13F | Integrated Wealth Concepts LLC | 1,864 | -21.65 | 201 | -15.61 | ||||
| 2025-07-25 | 13F | Astoria Portfolio Advisors LLC. | 11,532 | -5.91 | 1,271 | 10.24 | ||||
| 2025-08-12 | 13F | MAI Capital Management | 800 | -0.62 | 86 | 7.50 | ||||
| 2025-08-11 | 13F | Oder Investment Management, LLC | 1,970 | -4.55 | 212 | 2.91 | ||||
| 2025-07-24 | 13F | Riverchase Wealth Management, Llc | 1,895 | -10.61 | 204 | -3.32 | ||||
| 2025-08-11 | 13F | Strategic Wealth Partners, Ltd. | 5,000 | -16.30 | 538 | -16.07 | ||||
| 2025-08-01 | 13F | Clark Asset Management, LLC | 4,003 | 0.00 | 431 | 8.02 | ||||
| 2025-05-06 | 13F | Venturi Wealth Management, LLC | 0 | -100.00 | 0 | |||||
| 2025-08-07 | 13F | Kestra Private Wealth Services, Llc | 16,629 | 189.15 | 1,791 | 211.85 | ||||
| 2025-08-08 | 13F | Kingsview Wealth Management, LLC | 2,364 | -53.31 | 255 | -49.70 | ||||
| 2025-08-13 | 13F | Flow Traders U.s. Llc | 25,895 | -16.55 | 3 | -33.33 | ||||
| 2025-08-14 | 13F | Aqr Capital Management Llc | 3,342 | -0.98 | 360 | 6.53 | ||||
| 2025-08-14 | 13F | CIBC World Markets Inc. | 2,433 | -35.87 | 262 | -30.69 | ||||
| 2025-07-07 | 13F | Investors Research Corp | 7,123 | 0.00 | 767 | 7.88 | ||||
| 2025-08-14 | 13F | Wealth Preservation Advisors, LLC | 0 | -100.00 | 0 | |||||
| 2025-04-30 | 13F | Synergy Investment Management, LLC | 0 | -100.00 | 0 | |||||
| 2025-07-09 | 13F | Breakwater Capital Group | 32,471 | -18.66 | 3,497 | -12.27 | ||||
| 2025-07-29 | 13F | Stratos Wealth Partners, LTD. | 12,125 | -6.15 | 1,306 | 1.16 | ||||
| 2025-08-14 | 13F | Stifel Financial Corp | 6,063 | -8.58 | 653 | -1.51 | ||||
| 2025-07-08 | 13F | Advance Capital Management, Inc. | 0 | -100.00 | 0 | |||||
| 2025-08-04 | 13F | Integrity Alliance, Llc. | 0 | -100.00 | 0 | |||||
| 2025-08-14 | 13F | Stadion Money Management, LLC | 140,039 | -0.78 | 15,082 | 6.99 | ||||
| 2025-08-07 | 13F | Vise Technologies, Inc. | 0 | -100.00 | 0 | |||||
| 2025-08-14 | 13F | Sunbelt Securities, Inc. | 1,619 | -8.99 | 170 | -4.52 | ||||
| 2025-07-14 | 13F | U.S. Capital Wealth Advisors, LLC | 21,732 | -0.68 | 2,341 | 7.09 | ||||
| 2025-08-12 | 13F | Gladstone Institutional Advisory LLC | 2,981 | -7.65 | 321 | -0.31 | ||||
| 2025-08-14 | 13F | Arete Wealth Advisors, LLC | 0 | -100.00 | 0 | |||||
| 2025-07-22 | 13F | BridgePort Financial Solutions, LLC | 21,778 | 4.60 | 2,346 | 12.79 | ||||
| 2025-04-18 | 13F | Optivise Advisory Services LLC | 0 | -100.00 | 0 | |||||
| 2025-07-25 | 13F | Sovereign Financial Group, Inc. | 18,520 | -4.93 | 1,995 | 2.52 | ||||
| 2025-07-22 | 13F | Marks Group Wealth Management, Inc | 23,892 | 0.00 | 2,573 | 7.84 | ||||
| 2025-08-05 | 13F | GPS Wealth Strategies Group, LLC | 904 | 0.00 | 97 | 7.78 | ||||
| 2025-08-08 | 13F | Creative Planning | 186,454 | -7.11 | 20,081 | 0.16 | ||||
| 2025-07-23 | 13F | High Note Wealth, LLC | 4,996 | 0.00 | 538 | 7.82 | ||||
| 2025-08-14 | 13F | Citadel Advisors Llc | 24,096 | 18.58 | 2,595 | 27.90 | ||||
| 2025-08-14 | 13F | Coastal Bridge Advisors, LLC | 169,103 | 2.29 | 18,212 | 10.30 | ||||
| 2025-07-28 | 13F | Nvest Financial, LLC | 2,682 | -2.51 | 289 | 5.11 | ||||
| 2025-08-05 | 13F | Huntington National Bank | 26 | 0.00 | ||||||
| 2025-07-28 | 13F | Harbour Investments, Inc. | 3,810 | 1.84 | 410 | 9.92 | ||||
| 2025-08-08 | 13F | Cedar Wealth Management, LLC | 142,405 | -1.13 | 15,337 | 6.62 | ||||
| 2025-08-14 | 13F | Citadel Advisors Llc | Call | 6,600 | 4.76 | 711 | 12.88 | |||
| 2025-07-23 | 13F | Prasad Wealth Partners, LLC | 6,587 | -52.07 | 709 | -48.32 | ||||
| 2025-08-12 | 13F | Wood Tarver Financial Group, LLC | 76,873 | -4.52 | 8 | -99.90 | ||||
| 2025-08-14 | 13F | Ameriprise Financial Inc | 70,912 | -59.83 | 7,635 | -56.70 |