Mga Batayang Estadistika
| Pemilik Institusional | 284 total, 283 long only, 0 short only, 1 long/short - change of 0.71% MRQ |
| Alokasi Portofolio Rata-rata | 0.0657 % - change of 14.22% MRQ |
| Saham Institusional (Jangka Panjang) | 72,285,655 (ex 13D/G) - change of -5.38MM shares -6.93% MRQ |
| Nilai Institusional (Jangka Panjang) | $ 371,965 USD ($1000) |
Kepemilikan Institusional dan Pemegang Saham
Telefónica, S.A. - Depositary Receipt (Common Stock) (US:TEF) memiliki 284 pemilik institusional dan pemegang saham yang telah mengajukan formulir 13D/G atau 13F kepada Komisi Bursa Efek (Securities Exchange Commission/SEC). Lembaga-lembaga ini memegang total 72,285,655 saham. Pemegang saham terbesar meliputi Morgan Stanley, Goldman Sachs Group Inc, Bank Of America Corp /de/, BlackRock, Inc., Northern Trust Corp, PPYIX - PIMCO RAE International Fund Institutional Class, Royal Bank Of Canada, Fmr Llc, Dimensional Fund Advisors Lp, and American Century Companies Inc .
Struktur kepemilikan institusional Telefónica, S.A. - Depositary Receipt (Common Stock) (NYSE:TEF) menunjukkan posisi terkini di perusahaan oleh institusi dan dana, serta perubahan terbaru dalam ukuran posisi. Pemegang saham utama dapat mencakup investor individu, reksa dana, dana lindung nilai, atau institusi. Jadwal 13D menunjukkan bahwa investor memegang (atau pernah memegang) lebih dari 5% saham perusahaan dan bermaksud (atau pernah bermaksud) untuk secara aktif mengejar perubahan strategi bisnis. Jadwal 13G menunjukkan investasi pasif lebih dari 5%.
The share price as of September 4, 2025 is 5.29 / share. Previously, on September 5, 2024, the share price was 4.69 / share. This represents an increase of 12.79% over that period.

Skor Sentimen Dana
Skor Sentimen Dana (sebelumnya dikenal sebagai Skor Akumulasi Kepemilikan) menemukan saham-saham yang paling banyak dibeli oleh dana. Ini adalah hasil dari model kuantitatif multi-faktor yang canggih yang mengidentifikasi perusahaan dengan tingkat akumulasi institusional tertinggi. Model penilaian menggunakan kombinasi dari total peningkatan pemilik yang diungkapkan, perubahan dalam alokasi portofolio pada pemilik tersebut, dan metrik lainnya. Angka berkisar dari 0 hingga 100, dengan angka yang lebih tinggi menunjukkan tingkat akumulasi yang lebih tinggi dibandingkan dengan perusahaan sejenisnya, dan 50 adalah rata-ratanya.
Frekuensi Pembaruan: Setiap Hari
Lihat Ownership Explorer, yang menyediakan daftar perusahaan dengan peringkat tertinggi.
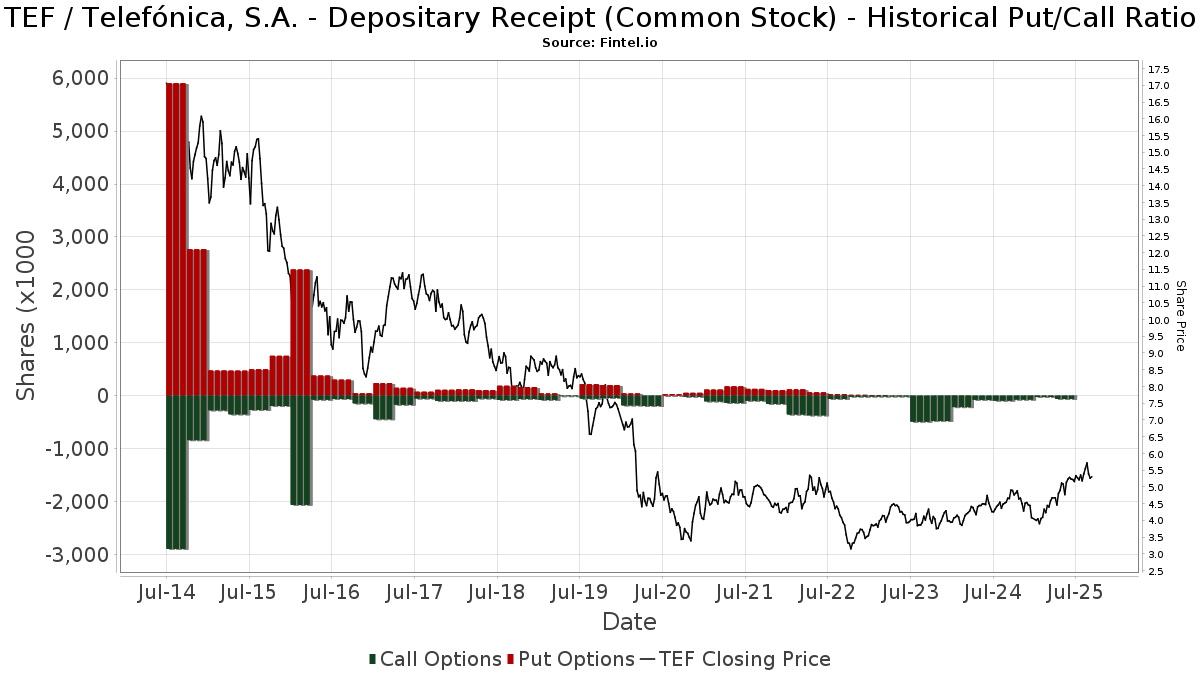
Rasio Put/Call Institusional
Selain melaporkan isu ekuitas dan utang standar, institusi dengan aset di bawah manajemen lebih dari 100 juta dolar AS juga harus mengungkapkan kepemilikan opsi put dan call mereka. Karena opsi put umumnya menunjukkan sentimen negatif, dan opsi call menunjukkan sentimen positif, kita dapat mengetahui sentimen institusional secara keseluruhan dengan memplot rasio put terhadap call. Grafik di sebelah kanan memplot rasio put/call historis untuk instrumen ini.
Menggunakan Rasio Put/Call sebagai indikator sentimen investor mengatasi salah satu kekurangan utama dari penggunaan total kepemilikan institusional, yaitu sejumlah besar aset yang dikelola diinvestasikan secara pasif untuk melacak indeks. Dana yang dikelola secara pasif biasanya tidak membeli opsi, sehingga indikator rasio put/call lebih akurat dalam melacak sentimen dana yang dikelola secara aktif.
Pengajuan 13F dan NPORT
Detail pada pengajuan 13F tersedia gratis. Detail pada pengajuan NP memerlukan keanggotaan premium. Baris berwarna hijau menunjukkan posisi baru. Baris berwarna merah menunjukkan posisi yang sudah ditutup. Klik tautan ini ikon untuk melihat riwayat transaksi selengkapnya.
Tingkatkan
untuk membuka data premium dan mengekspor ke Excel ![]() .
.
| Tanggal File | Sumber | Investor | Ketik | Presyo ng Avg (Silangan) |
Saham | Δ Saham (%) |
Dilaporkan Nilai ($1000) |
Nilai Δ (%) |
Alokasi Port (%) |
|
|---|---|---|---|---|---|---|---|---|---|---|
| 2025-07-17 | 13F | Sage Rhino Capital Llc | 17,863 | -0.79 | 93 | 12.05 | ||||
| 2025-08-06 | 13F | Moors & Cabot, Inc. | 11,362 | 0.00 | 59 | 13.46 | ||||
| 2025-07-15 | 13F | Financial Management Professionals, Inc. | 1,097 | 6 | ||||||
| 2025-07-29 | 13F | Salomon & Ludwin, LLC | 59 | 0 | ||||||
| 2025-08-14 | 13F | Vident Advisory, LLC | 349,608 | -3.39 | 1,828 | 8.42 | ||||
| 2025-09-04 | 13F/A | Advisor Group Holdings, Inc. | 29,272 | 47.90 | 153 | 66.30 | ||||
| 2025-08-13 | 13F/A | StoneX Group Inc. | 0 | -100.00 | 0 | -100.00 | ||||
| 2025-07-25 | 13F | JustInvest LLC | 182,149 | 46.79 | 953 | 64.71 | ||||
| 2025-08-14 | 13F | Optiver Holding B.V. | 386,683 | -50.99 | 2,022 | -44.99 | ||||
| 2025-08-14 | 13F | Wetherby Asset Management Inc | 184,010 | -10.44 | 962 | 16.61 | ||||
| 2025-05-15 | 13F | CAPROCK Group, Inc. | 34,666 | 5.68 | 162 | 18.38 | ||||
| 2025-08-12 | 13F | Gitterman Wealth Management, LLC | 40,773 | -1.88 | 213 | 10.36 | ||||
| 2025-08-12 | 13F | BlackRock, Inc. | 4,491,806 | -4.12 | 23,492 | 7.61 | ||||
| 2025-08-14 | 13F | Corient IA LLC | 44,000 | 25.71 | 230 | 41.10 | ||||
| 2025-08-14 | 13F | CIBC World Markets Inc. | 750,806 | -3.02 | 3,927 | 8.84 | ||||
| 2025-06-26 | NP | DFAX - Dimensional World ex U.S. Core Equity 2 ETF | 111,179 | 0.00 | 568 | 26.50 | ||||
| 2025-07-22 | 13F | Checchi Capital Advisers, LLC | 31,581 | -13.06 | 165 | -2.37 | ||||
| 2025-05-09 | 13F | Blair William & Co/il | 0 | -100.00 | 0 | |||||
| 2025-05-15 | 13F/A | Orion Portfolio Solutions, LLC | 95,513 | 73.39 | 445 | 101.36 | ||||
| 2025-03-26 | NP | TDVI - FT Vest Technology Dividend Target Income ETF | 17,867 | 67.50 | 72 | 46.94 | ||||
| 2025-07-25 | 13F | Allspring Global Investments Holdings, LLC | 43,652 | -2.60 | 232 | 11.00 | ||||
| 2025-07-15 | 13F | Drum Hill Capital, LLC | 479,971 | -2.52 | 2,510 | 9.42 | ||||
| 2025-08-12 | 13F | Providence Wealth Advisors, LLC | 24,548 | 132 | ||||||
| 2025-08-13 | 13F | Cerity Partners LLC | 453,571 | -0.28 | 2,372 | 11.94 | ||||
| 2025-08-12 | 13F | Pathstone Holdings, LLC | 175,597 | 1.34 | 925 | 14.50 | ||||
| 2025-08-05 | 13F | Bank of New York Mellon Corp | 142,190 | 1.31 | 744 | 13.61 | ||||
| 2025-08-04 | 13F | Assetmark, Inc | 61,705 | 162.44 | 323 | 195.41 | ||||
| 2025-08-11 | 13F | Bell Investment Advisors, Inc | 1,203 | 36.09 | 6 | 50.00 | ||||
| 2025-08-08 | 13F | Larson Financial Group LLC | 1,628 | 121.20 | 9 | 166.67 | ||||
| 2025-08-15 | 13F | Tower Research Capital LLC (TRC) | 17,804 | 110.35 | 93 | 138.46 | ||||
| 2025-04-24 | 13F | Trust Co Of Vermont | 0 | -100.00 | 0 | |||||
| 2025-07-29 | 13F | Koshinski Asset Management, Inc. | 53,027 | 0.05 | 277 | 12.60 | ||||
| 2025-07-10 | 13F | Wedmont Private Capital | 15,810 | -0.11 | 83 | 15.28 | ||||
| 2025-08-08 | 13F | Hartland & Co., LLC | 0 | -100.00 | 0 | |||||
| 2025-08-05 | 13F | Key FInancial Inc | 4,084 | 0.00 | 21 | 10.53 | ||||
| 2025-08-11 | 13F | Avantax Planning Partners, Inc. | 10,563 | -8.65 | 55 | 3.77 | ||||
| 2025-08-14 | 13F | DRW Securities, LLC | 40,966 | 0.00 | 214 | 12.63 | ||||
| 2025-07-16 | 13F/A | CX Institutional | 1,352 | 0.00 | 0 | |||||
| 2025-08-14 | 13F | ICONIQ Capital, LLC | 12,913 | 9.03 | 68 | -34.95 | ||||
| 2025-08-12 | 13F | Horizon Kinetics Asset Management Llc | 367,796 | -5.83 | 1,924 | 5.66 | ||||
| 2025-08-29 | NP | Gabelli Equity Trust Inc | 285,000 | 0.00 | 1,491 | 12.20 | ||||
| 2025-08-29 | NP | Gabelli Multimedia Trust Inc. | 195,000 | 0.00 | 1,020 | 12.22 | ||||
| 2025-08-27 | 13F/A | Brinker Capital Investments, LLC | 104,396 | 9.30 | 546 | 22.47 | ||||
| 2025-08-11 | 13F | TD Waterhouse Canada Inc. | 500 | 0.00 | 3 | 0.00 | ||||
| 2025-08-25 | 13F/A | Neuberger Berman Group LLC | 64,229 | 31.11 | 336 | 46.93 | ||||
| 2025-05-05 | 13F | Lindbrook Capital, Llc | 20,012 | -11.00 | 93 | 3.33 | ||||
| 2025-08-11 | 13F | HighTower Advisors, LLC | 32,184 | -10.11 | 168 | 1.20 | ||||
| 2025-08-14 | 13F | Fmr Llc | 2,288,825 | 12.95 | 11,971 | 26.76 | ||||
| 2025-08-26 | NP | AUXAX - Auxier Focus Fund A Shares | 34,119 | 0.00 | 178 | 12.66 | ||||
| 2025-05-21 | NP | MBEQX - M International Equity Fund | 5,440 | 0.00 | 25 | 19.05 | ||||
| 2025-08-13 | 13F | Northwestern Mutual Wealth Management Co | 57,442 | -7.54 | 300 | 3.81 | ||||
| 2025-07-07 | 13F | Investors Research Corp | 92,986 | 0.00 | 486 | 12.24 | ||||
| 2025-08-29 | NP | SA FUNDS INVESTMENT TRUST - SA International Value Fund | 6,496 | 0.00 | 34 | 10.00 | ||||
| 2025-08-29 | NP | Gabelli Utility Trust | 250,000 | 0.00 | 1,308 | 12.19 | ||||
| 2025-08-14 | 13F | Bnp Paribas Arbitrage, Sa | 13 | 0.00 | 0 | |||||
| 2025-07-16 | 13F | Five Oceans Advisors | 23,057 | 0.00 | 121 | 12.15 | ||||
| 2025-08-14 | 13F | Mml Investors Services, Llc | 52,490 | 13.10 | 0 | |||||
| 2025-07-10 | 13F | Wealth Enhancement Advisory Services, Llc | 28,358 | -10.91 | 150 | 1.35 | ||||
| 2025-08-05 | 13F | Welch & Forbes Llc | 67,720 | 0.00 | 354 | 12.38 | ||||
| 2025-08-14 | 13F | Pingora Partners LLC | 200 | 0.00 | 1 | |||||
| 2025-08-13 | 13F | Centiva Capital, LP | 0 | -100.00 | 0 | |||||
| 2025-08-11 | 13F | GW&K Investment Management, LLC | 452 | 0.00 | 0 | |||||
| 2025-08-11 | 13F | Rothschild Investment Llc | 4,485 | 70.99 | 23 | 91.67 | ||||
| 2025-07-09 | 13F | Aaron Wealth Advisors LLC | 54,230 | -4.20 | 284 | 7.60 | ||||
| 2025-08-08 | 13F | Cetera Investment Advisers | 56,540 | 170.62 | 296 | 204.12 | ||||
| 2025-07-30 | NP | APIE - ActivePassive International Equity ETF | 615,070 | -12.03 | 3,266 | 6.18 | ||||
| 2025-07-25 | 13F | GFS Advisors, LLC | 12,666 | 0.00 | 66 | 11.86 | ||||
| 2025-05-16 | 13F | Coppell Advisory Solutions LLC | 0 | -100.00 | 0 | |||||
| 2025-07-17 | 13F | BayBridge Capital Group, LLC | 27,971 | 0.00 | 146 | 12.31 | ||||
| 2025-07-31 | 13F | Carrera Capital Advisors | 1,007,166 | 5,440 | ||||||
| 2025-08-14 | 13F | Ameriprise Financial Inc | 343,064 | 7.07 | 1,800 | 18.98 | ||||
| 2025-08-11 | 13F | VSM Wealth Advisory, LLC | 13,209 | 0.00 | 69 | 13.11 | ||||
| 2025-08-05 | 13F | GPS Wealth Strategies Group, LLC | 18 | 0.00 | 0 | |||||
| 2025-08-29 | NP | GAUAX - The Gabelli Utilities Fund Class A | 215,000 | 0.00 | 1,124 | 12.29 | ||||
| 2025-03-18 | NP | Bmc Fund Inc | 377 | 0.00 | 2 | 0.00 | ||||
| 2025-08-13 | 13F | EverSource Wealth Advisors, LLC | 20,909 | 108.05 | 109 | 136.96 | ||||
| 2025-07-08 | 13F | Gallacher Capital Management LLC | 105,560 | 4.04 | 552 | 16.95 | ||||
| 2025-06-26 | NP | DFAI - Dimensional International Core Equity Market ETF | 293,622 | 0.00 | 1,500 | 26.48 | ||||
| 2025-08-12 | 13F | Putnam Fl Investment Management Co | 11,181 | 58 | ||||||
| 2025-08-14 | 13F | Peapack Gladstone Financial Corp | 10,320 | 0.00 | 0 | |||||
| 2025-08-14 | 13F | Two Sigma Securities, Llc | 0 | -100.00 | 0 | |||||
| 2025-07-25 | 13F | Sequoia Financial Advisors, LLC | 17,425 | 0.90 | 91 | 13.75 | ||||
| 2025-08-15 | 13F | Captrust Financial Advisors | 28,671 | -21.82 | 150 | -12.35 | ||||
| 2025-08-07 | 13F | CENTRAL TRUST Co | 1 | 0.00 | 0 | |||||
| 2025-08-13 | 13F | Capital Analysts, Inc. | 3,415 | -14.37 | 0 | |||||
| 2025-08-12 | 13F | MAI Capital Management | 4,144 | 1,097.69 | 22 | 2,000.00 | ||||
| 2025-08-13 | 13F | Quadrant Capital Group Llc | 75,339 | -2.37 | 394 | 9.75 | ||||
| 2025-08-12 | 13F | Coldstream Capital Management Inc | 0 | -100.00 | 0 | |||||
| 2025-08-14 | 13F | Royal Bank Of Canada | 2,457,010 | 0.11 | 12,849 | 12.35 | ||||
| 2025-08-06 | 13F | Zevin Asset Management Llc | 53,575 | 0.00 | 0 | |||||
| 2025-07-24 | 13F | Mainstay Capital Management Llc /adv | 780,285 | 99.54 | 4,081 | 123.93 | ||||
| 2025-07-24 | 13F | Us Bancorp \de\ | 157,997 | -3.91 | 826 | 7.83 | ||||
| 2025-08-14 | 13F | Mercer Global Advisors Inc /adv | 82,800 | -8.73 | 433 | 2.61 | ||||
| 2025-05-15 | 13F | Sonoma Private Wealth LLC | 0 | -100.00 | 0 | |||||
| 2025-08-08 | 13F | Avantax Advisory Services, Inc. | 27,141 | 20.08 | 142 | 34.29 | ||||
| 2025-08-05 | 13F | Ellevest, Inc. | 51,092 | -4.94 | 267 | 6.80 | ||||
| 2025-08-11 | 13F | Principal Securities, Inc. | 3,989 | 6.74 | 21 | 33.33 | ||||
| 2025-07-25 | 13F | Concord Wealth Partners | 100 | 0.00 | 1 | |||||
| 2025-08-18 | 13F | Geneos Wealth Management Inc. | 3,057 | -8.17 | 16 | 0.00 | ||||
| 2025-08-29 | NP | Gabelli Global Utility & Income Trust | 80,000 | 0.00 | 418 | 12.37 | ||||
| 2025-07-24 | 13F | PDS Planning, Inc | 12,350 | -1.53 | 65 | 10.34 | ||||
| 2025-07-28 | NP | AVIV - Avantis International Large Cap Value ETF This fund is a listed as child fund of American Century Companies Inc and if that institution has disclosed ownership in this security, then these positions will not be double counted when calculating total shares and total value | 106,980 | -3.26 | 568 | 25.66 | ||||
| 2025-07-24 | 13F | Callan Family Office, LLC | 51,939 | 272 | ||||||
| 2025-07-23 | 13F | Optas, LLC | 15,199 | -26.04 | 79 | -16.84 | ||||
| 2025-08-12 | 13F | Proequities, Inc. | Put | 0 | 0 | |||||
| 2025-08-12 | 13F | Proequities, Inc. | Call | 0 | 0 | |||||
| 2025-08-14 | 13F | Nia Impact Advisors, Llc | 967,830 | -0.90 | 5,062 | 11.21 | ||||
| 2025-08-12 | 13F | Proequities, Inc. | 0 | 0 | ||||||
| 2025-07-17 | 13F | Greenleaf Trust | 83,295 | -1.05 | 436 | 10.97 | ||||
| 2025-05-14 | 13F | SPX Equities Gestao de Recursos Ltda | 0 | -100.00 | 0 | |||||
| 2025-08-14 | 13F | Modern Wealth Management, LLC | 17,808 | -32.22 | 93 | -23.77 | ||||
| 2025-08-04 | 13F | Capital Performance Advisors Llp | 10,700 | 56 | ||||||
| 2025-04-17 | 13F | Trust Point Inc. | 0 | -100.00 | 0 | |||||
| 2025-07-29 | 13F | Private Trust Co Na | 3,192 | 2.60 | 17 | 14.29 | ||||
| 2025-08-14 | 13F | Group One Trading, L.p. | Call | 12,300 | 1,018.18 | 64 | 1,180.00 | |||
| 2025-08-14 | 13F | Group One Trading, L.p. | 3,399 | 18 | ||||||
| 2025-08-13 | 13F | First Trust Advisors Lp | 186,505 | -7.36 | 975 | 3.94 | ||||
| 2025-07-11 | 13F | Seacrest Wealth Management, Llc | 11,169 | 0.00 | 58 | 11.54 | ||||
| 2025-08-08 | 13F | Creative Planning | 146,570 | -1.28 | 767 | 10.85 | ||||
| 2025-07-11 | 13F | Mitchell & Pahl Private Wealth, Llc | 154,853 | 4.78 | 810 | 17.59 | ||||
| 2025-07-31 | 13F | CVA Family Office, LLC | 510 | 0.00 | 3 | 0.00 | ||||
| 2025-08-12 | 13F | LPL Financial LLC | 267,300 | 1.12 | 1,398 | 13.48 | ||||
| 2025-07-16 | 13F | St Germain D J Co Inc | 21 | 0 | ||||||
| 2025-05-08 | 13F | Bank of Jackson Hole Trust | 0 | -100.00 | 0 | |||||
| 2025-08-08 | 13F | Wrapmanager Inc | 10,123 | 53 | ||||||
| 2025-07-28 | 13F | BRYN MAWR TRUST Co | 18,049 | 44.09 | 94 | 62.07 | ||||
| 2025-08-14 | 13F | BTG Pactual Asset Management US LLC | 17,404 | 6.56 | 91 | 19.74 | ||||
| 2025-07-16 | 13F | Highline Wealth Partners Llc | 0 | -100.00 | 0 | |||||
| 2025-08-13 | 13F | Twin Peaks Wealth Advisors, LLC | 1,539 | 8 | ||||||
| 2025-08-14 | 13F | Jain Global LLC | 0 | -100.00 | 0 | |||||
| 2025-05-15 | 13F | Principal Street Partners, LLC | 0 | -100.00 | 0 | |||||
| 2025-07-25 | 13F | Cwm, Llc | 3,354 | 2.38 | 0 | |||||
| 2025-08-05 | 13F | Huntington National Bank | 1 | 0.00 | 0 | |||||
| 2025-08-07 | 13F | Winthrop Capital Management, LLC | 84,445 | 0.00 | 0 | |||||
| 2025-04-21 | 13F | Nelson, Van Denburg & Campbell Wealth Management Group, LLC | 0 | -100.00 | 0 | |||||
| 2025-06-26 | NP | DFIC - Dimensional International Core Equity 2 ETF | 772,357 | 0.00 | 3,947 | 26.47 | ||||
| 2025-08-14 | 13F | Wells Fargo & Company/mn | 109,271 | -1.81 | 571 | 10.23 | ||||
| 2025-08-18 | 13F/A | National Bank Of Canada /fi/ | 1,047 | -71.42 | 5 | -68.75 | ||||
| 2025-08-14 | 13F | Raymond James Financial Inc | 193,892 | -23.83 | 1,014 | -14.50 | ||||
| 2025-07-18 | 13F | BSW Wealth Partners | 15,498 | -14.86 | 81 | -3.57 | ||||
| 2025-07-16 | 13F | Signaturefd, Llc | 79,905 | -1.04 | 418 | 10.90 | ||||
| 2025-08-13 | 13F | Arrowstreet Capital, Limited Partnership | 302,281 | 2,896.44 | 1,581 | 3,261.70 | ||||
| 2025-07-31 | 13F | Cambridge Investment Research Advisors, Inc. | 140,727 | 255.03 | 1 | |||||
| 2025-08-13 | 13F | Rsm Us Wealth Management Llc | 31,287 | 9.96 | 169 | 28.03 | ||||
| 2025-08-06 | 13F | Vestmark Advisory Solutions, Inc. | 83,788 | 438 | ||||||
| 2025-05-14 | 13F | Healthcare Of Ontario Pension Plan Trust Fund | 0 | -100.00 | 0 | |||||
| 2025-08-07 | 13F | HighPoint Advisor Group LLC | 10,531 | 0.45 | 55 | 3.77 | ||||
| 2025-08-13 | 13F | Gamco Investors, Inc. Et Al | 10,000 | 0.00 | 52 | 13.04 | ||||
| 2025-08-14 | 13F | State Street Corp | 10,413 | 0.00 | 56 | 16.67 | ||||
| 2025-08-14 | 13F | Colony Group, LLC | 25,959 | -1.47 | 137 | 12.30 | ||||
| 2025-08-14 | 13F | Cubist Systematic Strategies, LLC | 46,354 | -77.51 | 242 | -74.79 | ||||
| 2025-07-14 | 13F | AdvisorNet Financial, Inc | 500 | 0.00 | 3 | 0.00 | ||||
| 2025-07-31 | 13F | Whipplewood Advisors, LLC | 234 | -8.59 | 1 | 0.00 | ||||
| 2025-07-24 | NP | FWRLX - Wireless Portfolio This fund is a listed as child fund of Fmr Llc and if that institution has disclosed ownership in this security, then these positions will not be double counted when calculating total shares and total value | 731,849 | 0.00 | 3,886 | 20.68 | ||||
| 2025-08-29 | NP | MFDX - PIMCO RAFI Dynamic Multi-Factor International Equity ETF | 276,743 | -0.34 | 1,457 | 11.31 | ||||
| 2025-08-14 | 13F | UBS Group AG | 138,148 | 267.87 | 723 | 314.94 | ||||
| 2025-07-24 | 13F | Ronald Blue Trust, Inc. | 16,552 | -19.05 | 87 | -9.47 | ||||
| 2025-06-26 | NP | DFA INVESTMENT DIMENSIONS GROUP INC - World ex U.S. Core Equity Portfolio Institutional Class Shares | 31,697 | 0.00 | 162 | 25.78 | ||||
| 2025-07-25 | 13F | Yousif Capital Management, Llc | 93,346 | 5.83 | 488 | 18.73 | ||||
| 2025-08-15 | 13F | CI Private Wealth, LLC | 86,231 | 65.25 | 451 | 85.19 | ||||
| 2025-07-25 | 13F | Concurrent Investment Advisors, LLC | 19,543 | -44.55 | 102 | -37.80 | ||||
| 2025-08-14 | 13F | Bank Of America Corp /de/ | 5,166,876 | -33.22 | 27,023 | -25.05 | ||||
| 2025-08-08 | 13F | Crossmark Global Holdings, Inc. | 398,378 | -0.03 | 2,084 | 12.17 | ||||
| 2025-08-06 | 13F | Valued Wealth Advisors LLC | 1,558 | 0.00 | 8 | 14.29 | ||||
| 2025-08-11 | 13F | Citigroup Inc | 14,784 | 1.71 | 77 | 14.93 | ||||
| 2025-08-07 | 13F | Sierra Ocean, Llc | 1,924 | 0.00 | 10 | 25.00 | ||||
| 2025-08-13 | 13F | BCJ Capital Management, LLC | 16,909 | 88 | ||||||
| 2025-08-14 | 13F | American Trust Investment Advisors, LLC | 75,984 | 0.00 | 397 | 12.15 | ||||
| 2025-08-14 | 13F | Mariner, LLC | 559,940 | 26.21 | 2,928 | 41.65 | ||||
| 2025-07-28 | 13F | Naviter Wealth, LLC | 83,094 | 207.76 | 440 | 252.00 | ||||
| 2025-08-14 | 13F | Syon Capital Llc | 46,669 | -1.67 | 244 | 10.41 | ||||
| 2025-08-15 | 13F | Morgan Stanley | 16,929,665 | -17.68 | 88,542 | -7.61 | ||||
| 2025-08-07 | 13F | Allworth Financial LP | 2,447 | 173.41 | 13 | 200.00 | ||||
| 2025-07-28 | NP | AVSD - Avantis Responsible International Equity ETF | 39,408 | 0.00 | 209 | 20.81 | ||||
| 2025-08-12 | 13F | Manchester Capital Management LLC | 3,083 | 7.20 | 16 | 23.08 | ||||
| 2025-08-05 | 13F | NewSquare Capital LLC | 1,123 | 317.47 | 6 | 400.00 | ||||
| 2025-07-18 | 13F | Truist Financial Corp | 14,945 | 26.11 | 78 | 41.82 | ||||
| 2025-08-12 | 13F | Rhumbline Advisers | 93,374 | -6.86 | 488 | 4.50 | ||||
| 2025-07-11 | 13F | Perpetual Ltd | 10,393 | 0.00 | 54 | 12.50 | ||||
| 2025-07-15 | 13F | Cordant, Inc. | 2 | 0.00 | 0 | |||||
| 2025-08-14 | 13F | Millennium Management Llc | 336,269 | -33.27 | 1,759 | -25.13 | ||||
| 2025-08-08 | 13F | Pnc Financial Services Group, Inc. | 38,632 | -2.73 | 202 | 9.19 | ||||
| 2025-07-21 | 13F | Ascent Group, LLC | 37,547 | 19.06 | 196 | 34.25 | ||||
| 2025-04-11 | 13F | CBOE Vest Financial, LLC | 0 | -100.00 | 0 | -100.00 | ||||
| 2025-08-12 | 13F | Dimensional Fund Advisors Lp | 1,856,381 | -1.52 | 9,708 | 10.52 | ||||
| 2025-08-14 | 13F | Susquehanna International Group, Llp | Call | 19,500 | 9.55 | 102 | 23.17 | |||
| 2025-08-13 | 13F | WCG Wealth Advisors LLC | 47,394 | 5.88 | 248 | 18.75 | ||||
| 2025-08-14 | 13F | Susquehanna International Group, Llp | 19,588 | -32.41 | 102 | -24.44 | ||||
| 2025-04-30 | 13F | Silverlake Wealth Management Llc | 0 | -100.00 | 0 | |||||
| 2025-08-13 | 13F | Guggenheim Capital Llc | 176,439 | 16.79 | 923 | 31.15 | ||||
| 2025-05-14 | 13F | Van Hulzen Asset Management, LLC | 0 | -100.00 | 0 | |||||
| 2025-03-26 | NP | DFA INVESTMENT DIMENSIONS GROUP INC - International Social Core Equity Portfolio Institutional Class This fund is a listed as child fund of Dimensional Fund Advisors Lp and if that institution has disclosed ownership in this security, then these positions will not be double counted when calculating total shares and total value | 3,907 | 0.00 | 16 | -16.67 | ||||
| 2025-08-14 | 13F | Optiver Holding B.V. | Call | 0 | -100.00 | 0 | -100.00 | |||
| 2025-07-15 | 13F | Ballentine Partners, LLC | 112,145 | 0.01 | 587 | 12.26 | ||||
| 2025-07-16 | 13F | Traveka Wealth, LLC | 14,545 | -2.56 | 76 | 10.14 | ||||
| 2025-08-12 | 13F | Franklin Resources Inc | 80,228 | 15.02 | 420 | 28.92 | ||||
| 2025-08-14 | 13F | GWM Advisors LLC | 1,237 | -90.72 | 6 | -90.32 | ||||
| 2025-08-04 | 13F | Atria Investments Llc | 53,738 | -50.62 | 281 | -80.61 | ||||
| 2025-08-14 | 13F | Decatur Capital Management, Inc. | 16,650 | 0.00 | 87 | 12.99 | ||||
| 2025-08-14 | 13F | Williams Jones Wealth Management, LLC. | 11,377 | 0.00 | 60 | 11.32 | ||||
| 2025-07-31 | 13F | R Squared Ltd | 37,139 | -14.07 | 194 | -3.48 | ||||
| 2025-08-01 | 13F | May Hill Capital, LLC | 0 | -100.00 | 0 | |||||
| 2025-07-28 | NP | AVDE - Avantis International Equity ETF This fund is a listed as child fund of American Century Companies Inc and if that institution has disclosed ownership in this security, then these positions will not be double counted when calculating total shares and total value | 1,464,729 | 9.16 | 7,778 | 31.75 | ||||
| 2025-08-14 | 13F | Point72 Asset Management, L.P. | 354,500 | -39.00 | 1,854 | -31.51 | ||||
| 2025-08-11 | 13F | United Capital Financial Advisers, Llc | 37,717 | 13.52 | 197 | 27.92 | ||||
| 2025-07-11 | 13F/A | Umb Bank N A/mo | 1,020 | -11.61 | 5 | 0.00 | ||||
| 2025-08-06 | 13F | True Wealth Design, LLC | 80 | -4.76 | 0 | |||||
| 2025-05-15 | 13F | Glenmede Trust Co Na | 29,277 | -9.76 | 136 | 4.62 | ||||
| 2025-07-28 | 13F | Harbour Investments, Inc. | 552 | -71.10 | 3 | -75.00 | ||||
| 2025-08-14 | 13F | Goldman Sachs Group Inc | 6,442,570 | 3.19 | 33,695 | 15.81 | ||||
| 2025-05-05 | 13F | Creekmur Asset Management LLC | 0 | -100.00 | 0 | |||||
| 2025-08-01 | 13F | Bessemer Group Inc | 0 | -100.00 | 0 | |||||
| 2025-08-05 | 13F | Bank Of Montreal /can/ | 634,738 | -0.73 | 3,320 | 11.41 | ||||
| 2025-07-22 | 13F | Merit Financial Group, LLC | 15,794 | 83 | ||||||
| 2025-08-29 | NP | GATAX - The Gabelli Asset Fund Class A | 269,000 | 0.00 | 1,407 | 12.21 | ||||
| 2025-07-24 | 13F | Jfs Wealth Advisors, Llc | 2,482 | 0.00 | 13 | 9.09 | ||||
| 2025-08-13 | 13F | Townsquare Capital Llc | 0 | -100.00 | 0 | |||||
| 2025-08-19 | 13F | Cape Investment Advisory, Inc. | 1,579 | 10.19 | 8 | 33.33 | ||||
| 2025-08-11 | 13F | Cornerstone Planning Group LLC | 703 | 32.64 | 4 | 50.00 | ||||
| 2025-08-12 | 13F | Steward Partners Investment Advisory, Llc | 1,649 | 0.00 | 9 | 14.29 | ||||
| 2025-07-25 | 13F | Natural Investments, Llc | 34,961 | 47.77 | 0 | |||||
| 2025-08-14 | 13F | Smartleaf Asset Management LLC | 26,600 | 31.87 | 138 | 48.39 | ||||
| 2025-08-13 | 13F | Sanibel Captiva Trust Company, Inc. | 13,875 | 0.00 | 73 | 12.50 | ||||
| 2025-08-29 | NP | GCAEX - The Gabelli Equity Income Fund Class A | 70,000 | 0.00 | 366 | 12.27 | ||||
| 2025-08-14 | 13F | Point72 Asia (Singapore) Pte. Ltd. | 0 | -100.00 | 0 | |||||
| 2025-08-14 | 13F | Stifel Financial Corp | 477,376 | -0.02 | 2,497 | 12.18 | ||||
| 2025-07-23 | 13F | Richardson Capital Management LLC | 155 | 0.00 | 1 | |||||
| 2025-07-11 | 13F | Farther Finance Advisors, LLC | 548 | 27.44 | 3 | 0.00 | ||||
| 2025-07-15 | 13F | Fifth Third Bancorp | 246 | 1 | ||||||
| 2025-07-21 | 13F | Cromwell Holdings LLC | 6,670 | -33.51 | 36 | -21.74 | ||||
| 2025-08-07 | 13F | Prospect Financial Group LLC | 12,918 | -0.01 | 68 | 11.67 | ||||
| 2025-08-12 | 13F | Charles Schwab Investment Management Inc | 356,146 | 16.41 | 1,863 | 30.67 | ||||
| 2025-06-26 | NP | DFIEX - International Core Equity Portfolio - Institutional Class This fund is a listed as child fund of Dimensional Fund Advisors Lp and if that institution has disclosed ownership in this security, then these positions will not be double counted when calculating total shares and total value | 70,329 | -68.08 | 359 | -59.66 | ||||
| 2025-04-29 | 13F | Callan Capital, LLC | 44,485 | 44.65 | 207 | 68.29 | ||||
| 2025-08-15 | 13F | Auxier Asset Management | 157,394 | -0.22 | 823 | 11.97 | ||||
| 2025-08-13 | 13F | Northern Trust Corp | 3,853,451 | 5.91 | 20,154 | 18.87 | ||||
| 2025-07-22 | 13F | Clarius Group, LLC | 11,812 | 0.00 | 62 | 10.91 | ||||
| 2025-08-14 | 13F | Old Mission Capital Llc | 0 | -100.00 | 0 | |||||
| 2025-07-28 | NP | AVDEX - Avantis International Equity Fund Institutional Class This fund is a listed as child fund of American Century Companies Inc and if that institution has disclosed ownership in this security, then these positions will not be double counted when calculating total shares and total value | 72,637 | 0.00 | 386 | 20.69 | ||||
| 2025-07-07 | 13F | Northwest & Ethical Investments L.P. | 0 | -100.00 | 0 | -100.00 | ||||
| 2025-06-26 | NP | DFSI - Dimensional International Sustainability Core 1 ETF | 42,037 | 0.00 | 215 | 26.63 | ||||
| 2025-06-26 | NP | SNTKX - Steward International Enhanced Index Fund Class A | 169,980 | 0.00 | 869 | 26.53 | ||||
| 2025-07-31 | 13F | 180 Wealth Advisors, Llc | 28,704 | -2.11 | 150 | 10.29 | ||||
| 2025-07-28 | 13F | Mutual Advisors, LLC | 38,645 | 0.00 | 208 | 8.33 | ||||
| 2025-08-12 | 13F | AlphaCore Capital LLC | 10,533 | 47 | ||||||
| 2025-08-14 | 13F | Federation des caisses Desjardins du Quebec | 15,245 | 0.00 | 80 | 11.27 | ||||
| 2025-08-29 | NP | PPYIX - PIMCO RAE International Fund Institutional Class | 2,624,870 | 10.78 | 13,815 | 23.70 | ||||
| 2025-07-14 | 13F | UMA Financial Services, Inc. | 1,254 | -14.93 | 7 | 0.00 | ||||
| 2025-08-14 | 13F | Hamilton Capital, LLC | 12,249 | -1.38 | 64 | 12.28 | ||||
| 2025-08-14 | 13F | Hrt Financial Lp | 0 | -100.00 | 0 | |||||
| 2025-08-12 | 13F | Clear Street Markets Llc | 0 | -100.00 | 0 | |||||
| 2025-07-08 | 13F | Parallel Advisors, LLC | 37,949 | -1.52 | 198 | 10.61 | ||||
| 2025-08-06 | 13F | Commonwealth Equity Services, Llc | 16,376 | 13.32 | 0 | |||||
| 2025-08-13 | 13F | Jones Financial Companies Lllp | 573 | 1,748.39 | 3 | |||||
| 2025-04-29 | 13F | Financial Counselors Inc | 0 | -100.00 | 0 | |||||
| 2025-08-14 | 13F | Evergreen Capital Management Llc | 25,747 | 0.00 | 139 | 16.81 | ||||
| 2025-08-01 | 13F | Envestnet Asset Management Inc | 58,641 | 23.84 | 307 | 39.09 | ||||
| 2025-08-11 | 13F | Dorsey & Whitney Trust CO LLC | 18,489 | -37.07 | 97 | -29.41 | ||||
| 2025-07-08 | 13F | Atwood & Palmer Inc | 8,465 | 44 | ||||||
| 2025-07-30 | 13F | Drive Wealth Management, Llc | 28,995 | 18.05 | 157 | 36.84 | ||||
| 2025-08-14 | 13F/A | Barclays Plc | 88,710 | -92.00 | 0 | -100.00 | ||||
| 2025-08-12 | 13F | CIBC Private Wealth Group, LLC | 2,092 | 0.00 | 11 | 11.11 | ||||
| 2025-08-13 | 13F | GABELLI & Co INVESTMENT ADVISERS, INC. | 66,000 | 0.00 | 345 | 12.38 | ||||
| 2025-08-13 | 13F | Russell Investments Group, Ltd. | 76,512 | 46.95 | 400 | 65.29 | ||||
| 2025-07-21 | 13F | Qrg Capital Management, Inc. | 202,018 | -1.88 | 1,057 | 10.11 | ||||
| 2025-08-14 | 13F | Verition Fund Management LLC | 14,142 | 74 | ||||||
| 2025-08-14 | 13F | Atomi Financial Group, Inc. | 48,037 | 64.16 | 251 | 84.56 | ||||
| 2025-08-11 | 13F | Brown Brothers Harriman & Co | 355 | 2 | ||||||
| 2025-07-09 | 13F | Bruce G. Allen Investments, LLC | 1,936 | -6.16 | 10 | 11.11 | ||||
| 2025-08-12 | 13F | Jpmorgan Chase & Co | 177,023 | 76.68 | 926 | 98.50 | ||||
| 2025-07-30 | 13F | Blume Capital Management, Inc. | 29 | 0 | ||||||
| 2025-08-19 | 13F/A | Pitcairn Co | 10,551 | -27.47 | 55 | -17.91 | ||||
| 2025-08-13 | 13F | Natixis Advisors, L.p. | 497,772 | 35.55 | 3 | 100.00 | ||||
| 2025-07-29 | 13F | Activest Wealth Management | 5,314 | 0.00 | 28 | 12.50 | ||||
| 2025-08-14 | 13F | Glenmede Investment Management, LP | 26,307 | 138 | ||||||
| 2025-08-05 | 13F | Dunhill Financial, LLC | 668 | 3 | ||||||
| 2025-07-25 | 13F | We Are One Seven, LLC | 46,501 | 162.39 | 243 | 196.34 | ||||
| 2025-08-14 | 13F | Aquatic Capital Management LLC | 64,449 | -44.42 | 337 | -37.59 | ||||
| 2025-07-29 | 13F | Private Wealth Management Group, LLC | 181 | 0.00 | 1 | |||||
| 2025-08-13 | 13F | Momentous Wealth Management, Inc. | 0 | -100.00 | 0 | |||||
| 2025-07-28 | 13F | Private Wealth Asset Management, LLC | 183 | 0.00 | 1 | |||||
| 2025-08-06 | 13F | Savant Capital, LLC | 81,790 | 143.74 | 428 | 173.72 | ||||
| 2025-08-12 | 13F | American Century Companies Inc | 1,752,600 | 17.82 | 9,166 | 32.25 | ||||
| 2025-07-15 | 13F | North Star Investment Management Corp. | 3 | 0.00 | 0 | |||||
| 2025-08-12 | 13F | Global Retirement Partners, LLC | 785 | 61.86 | 4 | 300.00 | ||||
| 2025-08-06 | 13F | Wsfs Capital Management, Llc | 19,209 | 0.00 | 100 | 12.36 | ||||
| 2025-08-06 | 13F | Thompson Siegel & Walmsley Llc | 10,393 | 0.00 | 0 | |||||
| 2025-08-07 | 13F | Parkside Financial Bank & Trust | 787 | 14.56 | 4 | 33.33 | ||||
| 2025-08-14 | 13F | Qube Research & Technologies Ltd | 0 | -100.00 | 0 | |||||
| 2025-04-21 | 13F | Catalina Capital Group, LLC | 0 | -100.00 | 0 | |||||
| 2025-08-04 | 13F | Hantz Financial Services, Inc. | 16,819 | 1,746.21 | 0 | |||||
| 2025-08-05 | 13F | Simplex Trading, Llc | Call | 4,900 | 4,800.00 | 0 | ||||
| 2025-08-12 | 13F | O'shaughnessy Asset Management, Llc | 199,384 | 14.24 | 1,043 | 28.17 | ||||
| 2025-07-14 | 13F | GAMMA Investing LLC | 26,305 | 68.73 | 138 | 90.28 | ||||
| 2025-08-13 | 13F | Bare Financial Services, Inc | 137 | 1 | ||||||
| 2025-08-05 | 13F | Simplex Trading, Llc | Put | 100 | 0 | |||||
| 2025-08-14 | 13F | Principia Wealth Advisory, LLC | 73 | 0 | ||||||
| 2025-08-05 | 13F | Simplex Trading, Llc | 10,446 | -76.71 | 0 | |||||
| 2025-07-24 | 13F | IFP Advisors, Inc | 1,115 | 0.00 | 6 | 0.00 | ||||
| 2025-08-14 | 13F | Ieq Capital, Llc | 24,108 | 56.48 | 126 | 77.46 | ||||
| 2025-08-15 | 13F | WealthCollab, LLC | 1,787 | 0.00 | 9 | 12.50 | ||||
| 2025-07-09 | 13F | Sunpointe, LLC | 12,718 | -0.09 | 69 | 15.25 | ||||
| 2025-07-21 | 13F | Credential Qtrade Securities Inc. | 0 | -100.00 | 0 | -100.00 | ||||
| 2025-08-29 | NP | Gabelli Dividend & Income Trust | 100,000 | 0.00 | 523 | 12.23 | ||||
| 2025-04-11 | 13F | First Affirmative Financial Network | 147,559 | 23.05 | 688 | 42.53 | ||||
| 2025-08-07 | 13F | Zions Bancorporation, National Association /ut/ | 1,225 | -6.56 | 6 | 0.00 | ||||
| 2025-06-26 | NP | DFALX - Large Cap International Portfolio - Institutional Class This fund is a listed as child fund of Dimensional Fund Advisors Lp and if that institution has disclosed ownership in this security, then these positions will not be double counted when calculating total shares and total value | 163,106 | 0.00 | 833 | 26.60 | ||||
| 2025-08-13 | 13F | Quadrature Capital Ltd | 24,438 | 128 | ||||||
| 2025-07-25 | 13F | Stephens Consulting, LLC | 73 | 0 | ||||||
| 2025-08-13 | 13F | GeoWealth Management, LLC | 0 | -100.00 | 0 | |||||
| 2025-08-12 | 13F | SRS Capital Advisors, Inc. | 317 | 0.00 | 5 | 300.00 | ||||
| 2025-05-12 | 13F | Virtu Financial LLC | 0 | -100.00 | 0 | |||||
| 2025-06-26 | NP | DFA INVESTMENT DIMENSIONS GROUP INC - International Vector Equity Portfolio Shares | 22,622 | 0.00 | 116 | 26.37 | ||||
| 2025-08-06 | 13F | First Horizon Advisors, Inc. | 0 | -100.00 | 0 | |||||
| 2025-08-13 | 13F | Gabelli Funds Llc | 1,464,000 | 0.00 | 7,657 | 12.23 | ||||
| 2025-07-14 | 13F | Park Avenue Securities Llc | 12,772 | -13.91 | 0 | |||||
| 2025-07-30 | 13F | Forum Financial Management, LP | 34,039 | 9.05 | 178 | 22.76 | ||||
| 2025-07-28 | 13F | Ritholtz Wealth Management | 10,995 | 2.89 | 58 | 16.33 | ||||
| 2025-08-14 | 13F | Jane Street Group, Llc | 54,167 | -81.51 | 283 | -79.27 | ||||
| 2025-08-18 | 13F | Pacific Center for Financial Services | 2,278 | 0.00 | 12 | 10.00 | ||||
| 2025-07-15 | 13F | Td Private Client Wealth Llc | 0 | -100.00 | 0 | |||||
| 2025-08-14 | 13F/A | Skopos Labs, Inc. | 21,077 | 10.15 | 110 | 23.60 | ||||
| 2025-07-29 | NP | NIAGX - Nia Impact Solutions Fund | 344,932 | -2.43 | 1,832 | 17.75 | ||||
| 2025-08-14 | 13F | Aqr Capital Management Llc | 236,165 | 99.22 | 1,235 | 123.73 | ||||
| 2025-08-19 | 13F | National Asset Management, Inc. | 0 | -100.00 | 0 | |||||
| 2025-08-14 | 13F | Citadel Advisors Llc | 45,681 | -73.38 | 239 | -70.21 | ||||
| 2025-08-13 | 13F | Summit Financial, LLC | 19,211 | 0.00 | 104 | 15.73 | ||||
| 2025-04-22 | 13F | Mendota Financial Group, LLC | 0 | -100.00 | 0 | |||||
| 2025-08-14 | 13F | Citadel Advisors Llc | Put | 0 | -100.00 | 0 | ||||
| 2025-08-14 | 13F | Citadel Advisors Llc | Call | 19,400 | 1,112.50 | 101 | 1,342.86 | |||
| 2025-08-19 | 13F | Newbridge Financial Services Group, Inc. | 2,580 | 0.00 | 13 | 8.33 | ||||
| 2025-06-26 | NP | DFIV - Dimensional International Value ETF | 8,118 | -71.29 | 41 | -64.04 | ||||
| 2025-07-24 | 13F | Lester Murray Antman dba SimplyRich | 99,707 | -9.99 | 1 | |||||
| 2025-07-30 | 13F | Ethic Inc. | 424,983 | 5.68 | 2,206 | 16.67 |