Mga Batayang Estadistika
| Saham Institusional (Jangka Panjang) | 318,276,987 - 69.03% (ex 13D/G) - change of -16.16MM shares -4.83% MRQ |
| Nilai Institusional (Jangka Panjang) | $ 10,167,476 USD ($1000) |
Kepemilikan Institusional dan Pemegang Saham
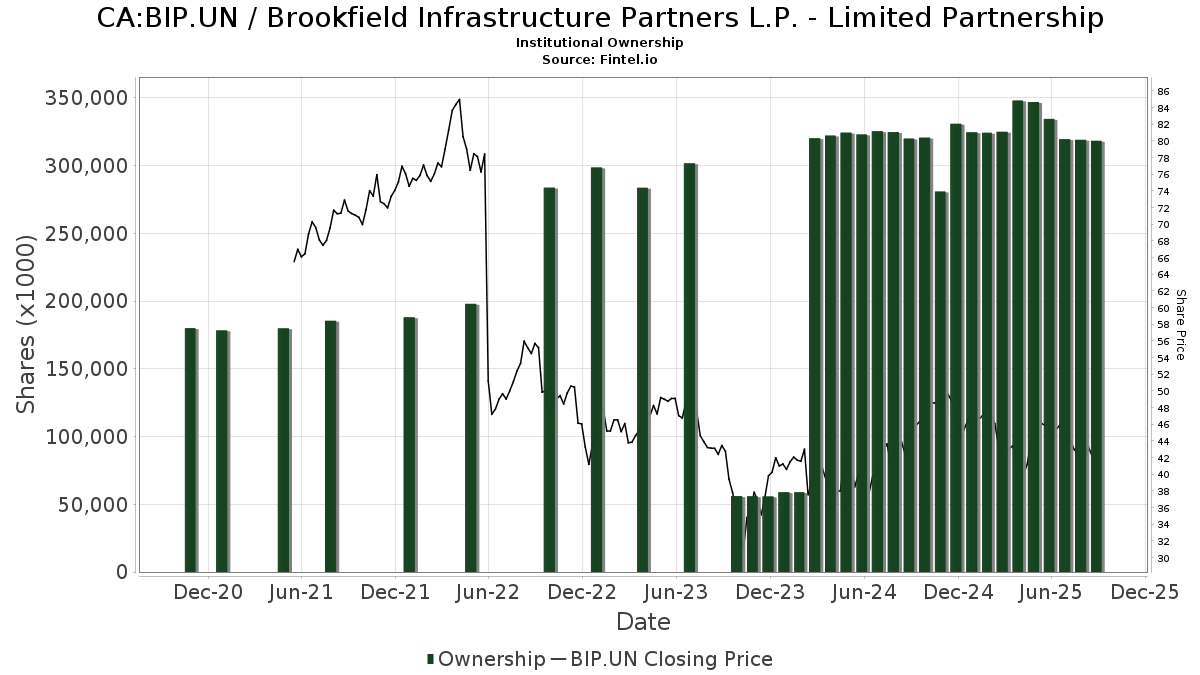
Brookfield Infrastructure Partners L.P. - Limited Partnership (CA:BIP.UN) memiliki 353 pemilik institusional dan pemegang saham yang telah mengajukan formulir 13D/G atau 13F kepada Komisi Bursa Efek (Securities Exchange Commission/SEC). Lembaga-lembaga ini memegang total 318,276,987 saham. Pemegang saham terbesar meliputi Royal Bank Of Canada, Capital World Investors, Principal Financial Group Inc, Bank Of Montreal /can/, PMBMX - MidCap Fund (f/k/a MidCap Blend Fund) R-3, AMECX - INCOME FUND OF AMERICA Class A, 1832 Asset Management L.P., CIBC Asset Management Inc, CIBC World Markets Inc., and ANCFX - AMERICAN FUNDS FUNDAMENTAL INVESTORS Class A .
Struktur kepemilikan institusional Brookfield Infrastructure Partners L.P. - Limited Partnership (TSX:BIP.UN) menunjukkan posisi terkini di perusahaan oleh institusi dan dana, serta perubahan terbaru dalam ukuran posisi. Pemegang saham utama dapat mencakup investor individu, reksa dana, dana lindung nilai, atau institusi. Jadwal 13D menunjukkan bahwa investor memegang (atau pernah memegang) lebih dari 5% saham perusahaan dan bermaksud (atau pernah bermaksud) untuk secara aktif mengejar perubahan strategi bisnis. Jadwal 13G menunjukkan investasi pasif lebih dari 5%.
The share price as of September 4, 2025 is 42.05 / share. Previously, on September 5, 2024, the share price was 42.39 / share. This represents a decline of 0.80% over that period.
Skor Sentimen Dana
Skor Sentimen Dana (sebelumnya dikenal sebagai Skor Akumulasi Kepemilikan) menemukan saham-saham yang paling banyak dibeli oleh dana. Ini adalah hasil dari model kuantitatif multi-faktor yang canggih yang mengidentifikasi perusahaan dengan tingkat akumulasi institusional tertinggi. Model penilaian menggunakan kombinasi dari total peningkatan pemilik yang diungkapkan, perubahan dalam alokasi portofolio pada pemilik tersebut, dan metrik lainnya. Angka berkisar dari 0 hingga 100, dengan angka yang lebih tinggi menunjukkan tingkat akumulasi yang lebih tinggi dibandingkan dengan perusahaan sejenisnya, dan 50 adalah rata-ratanya.
Frekuensi Pembaruan: Setiap Hari
Lihat Ownership Explorer, yang menyediakan daftar perusahaan dengan peringkat tertinggi.
Pengajuan 13F dan NPORT
Detail pada pengajuan 13F tersedia gratis. Detail pada pengajuan NP memerlukan keanggotaan premium. Baris berwarna hijau menunjukkan posisi baru. Baris berwarna merah menunjukkan posisi yang sudah ditutup. Klik tautan ini ikon untuk melihat riwayat transaksi selengkapnya.
Tingkatkan
untuk membuka data premium dan mengekspor ke Excel ![]() .
.
| Tanggal File | Sumber | Investor | Ketik | Presyo ng Avg (Silangan) |
Saham | Δ Saham (%) |
Dilaporkan Nilai ($1000) |
Nilai Δ (%) |
Alokasi Port (%) |
|
|---|---|---|---|---|---|---|---|---|---|---|
| 2025-08-13 | 13F | Capital World Investors | 31,692,263 | 0.26 | 1,061,723 | 12.90 | ||||
| 2025-07-24 | 13F | IFP Advisors, Inc | 2,451 | 0.00 | 82 | 12.33 | ||||
| 2025-07-29 | 13F | Roof Eidam & Maycock/adv | 6,750 | 0.00 | 226 | 12.44 | ||||
| 2025-08-13 | 13F | Scotia Capital Inc. | 6,935,826 | 3.37 | 232,194 | 17.38 | ||||
| 2025-08-14 | 13F | Mufg Securities (canada), Ltd. | 783,254 | 11.14 | 26,202 | 25.00 | ||||
| 2025-08-06 | 13F | SOUTH STATE Corp | 112 | -90.95 | 4 | -91.67 | ||||
| 2025-08-14 | 13F | Toronto Dominion Bank | Put | 12,800 | 29.29 | 429 | 45.58 | |||
| 2025-08-07 | 13F/A | Leith Wheeler Investment Counsel Ltd. | 382,053 | -2.60 | 12,799 | 9.53 | ||||
| 2025-07-29 | 13F | Chicago Partners Investment Group LLC | 526,959 | -0.73 | 17,110 | 1.87 | ||||
| 2025-08-14 | 13F | Toronto Dominion Bank | 2,493,405 | -16.41 | 83,585 | -5.82 | ||||
| 2025-05-14 | 13F | Susquehanna International Group, Llp | 0 | -100.00 | 0 | -100.00 | ||||
| 2025-08-14 | 13F | Toronto Dominion Bank | Call | 622,400 | -31.10 | 20,864 | -22.37 | |||
| 2025-07-29 | 13F | Mb, Levis & Associates, Llc | 2,932 | 0.00 | 98 | 12.64 | ||||
| 2025-08-06 | 13F | Agf Management Ltd | 2,475,583 | -9.06 | 82,935 | 2.41 | ||||
| 2025-08-12 | 13F | Picton Mahoney Asset Management | 1,384,662 | 46 | ||||||
| 2025-07-22 | 13F | DAVENPORT & Co LLC | 151,044 | 0.02 | 5,065 | 12.71 | ||||
| 2025-07-23 | 13F | Indiana Trust & Investment Management CO | 562 | 0.00 | 19 | 12.50 | ||||
| 2025-08-07 | 13F | Allworth Financial LP | 7,503 | 36.15 | 251 | 57.86 | ||||
| 2025-08-07 | 13F | Guardian Capital Lp | 647,084 | 0.94 | 21,634 | 13.46 | ||||
| 2025-06-26 | NP | GYLD - Arrow Dow Jones Global Yield ETF | 4,472 | 134 | ||||||
| 2025-08-21 | NP | KINETICS PORTFOLIOS TRUST - Kinetics Paradigm Portfolio | 27,000 | -2.88 | 904 | 9.18 | ||||
| 2025-07-25 | 13F | Tranquility Partners, LLC | 83,438 | 1.12 | 2,795 | 13.76 | ||||
| 2025-07-29 | 13F | Cidel Asset Management Inc | 6,028 | -15.27 | 202 | -4.74 | ||||
| 2025-08-11 | 13F | Bell Investment Advisors, Inc | 461 | 15 | ||||||
| 2025-08-06 | 13F | Atlantic Union Bankshares Corp | 225 | 8 | ||||||
| 2025-07-29 | 13F | Huntleigh Advisors, Inc. | 10,620 | 7.13 | 356 | 20.34 | ||||
| 2025-08-13 | 13F | Sanibel Captiva Trust Company, Inc. | 108,424 | -0.29 | 3,632 | 12.13 | ||||
| 2025-08-14 | 13F | Wells Fargo & Company/mn | 426,616 | -8.74 | 14,292 | 2.62 | ||||
| 2025-08-14 | 13F | Susquehanna International Group, Llp | Call | 91,100 | 54.93 | 3,052 | 74.24 | |||
| 2025-08-14 | 13F | Susquehanna International Group, Llp | Put | 23,400 | -42.36 | 784 | -35.24 | |||
| 2025-08-07 | 13F/A | Credit Industriel Et Commercial | 25,625 | -72.63 | 858 | -69.24 | ||||
| 2025-08-12 | 13F | Global Retirement Partners, LLC | 2,849 | 83.57 | 95 | 93.88 | ||||
| 2025-08-13 | 13F | Meketa Investment Group Inc /adv | 0 | -100.00 | 0 | |||||
| 2025-08-13 | 13F | Bank Of Nova Scotia Trust Co | 47,475 | 1.53 | 1,590 | 14.22 | ||||
| 2025-08-19 | 13F | National Asset Management, Inc. | 0 | -100.00 | 0 | |||||
| 2025-04-25 | 13F | Albion Financial Group /ut | 0 | -100.00 | 0 | |||||
| 2025-07-30 | 13F | Financial Perspectives, Inc | 6,154 | 0.00 | 206 | 12.57 | ||||
| 2025-08-14 | 13F | First Foundation Advisors | 77,402 | 11.53 | 2,593 | 25.40 | ||||
| 2025-08-05 | 13F | Simplex Trading, Llc | Call | 26,700 | -37.47 | 1 | -100.00 | |||
| 2025-07-24 | 13F | Tandem Capital Management Corp /adv | 41,540 | -0.59 | 1,392 | 11.82 | ||||
| 2025-04-25 | 13F | Smallwood Wealth Investment Management, LLC | 64 | 2 | ||||||
| 2025-08-05 | 13F | Simplex Trading, Llc | Put | 2,100 | -90.62 | 0 | ||||
| 2025-04-10 | 13F | Arthur M. Cohen & Associates, Llc | 0 | -100.00 | 0 | |||||
| 2025-04-28 | NP | FMCE - FM Compounders Equity ETF | 0 | -100.00 | 0 | -100.00 | ||||
| 2025-07-25 | 13F | Pandora Wealth, Inc. | 2,700 | 0.00 | 90 | 12.50 | ||||
| 2025-07-21 | 13F | Qrg Capital Management, Inc. | 6,109 | 205 | ||||||
| 2025-04-28 | NP | FDLS - Inspire Fidelis Multi Factor ETF | 0 | -100.00 | 0 | -100.00 | ||||
| 2025-07-15 | 13F | North Star Investment Management Corp. | 250 | 0.00 | 8 | 14.29 | ||||
| 2025-07-23 | 13F | Nbt Bank N A /ny | 450 | 0.00 | 15 | 15.38 | ||||
| 2025-07-24 | 13F | Davis-rea Ltd. | 70,419 | -2.86 | 2,362 | 9.36 | ||||
| 2025-07-29 | 13F | Regions Financial Corp | 12,501 | 0.00 | 419 | 12.37 | ||||
| 2025-08-14 | 13F | TCG Advisory Services, LLC | 74,052 | -4.20 | 2,481 | 7.73 | ||||
| 2025-07-11 | 13F | Farther Finance Advisors, LLC | 7,807 | 248.06 | 262 | 283.82 | ||||
| 2025-08-07 | 13F | Montag A & Associates Inc | 160 | -52.10 | 5 | -44.44 | ||||
| 2025-08-12 | 13F | Harbor Advisory Corp /ma/ | 255,115 | 1.48 | 8,546 | 14.13 | ||||
| 2025-08-15 | 13F | Provenance Wealth Advisors, LLC | 0 | -100.00 | 0 | -100.00 | ||||
| 2025-08-06 | 13F | Ing Groep Nv | 0 | -100.00 | 0 | |||||
| 2025-07-07 | 13F | Thurston, Springer, Miller, Herd & Titak, Inc. | 172 | 0.00 | 6 | 0.00 | ||||
| 2025-08-13 | 13F | Summit Financial, LLC | 12,842 | -12.74 | 430 | -1.83 | ||||
| 2025-07-09 | 13F | Mirador Capital Partners LP | 6,944 | 0.00 | 233 | 12.62 | ||||
| 2025-04-24 | 13F | Wingate Wealth Advisors, Inc. | 0 | -100.00 | 0 | |||||
| 2025-08-14 | 13F | Gluskin Sheff & Assoc Inc | 36,751 | -54.35 | 1,231 | -48.62 | ||||
| 2025-08-12 | 13F | BlackRock, Inc. | 151 | 0.67 | 5 | 25.00 | ||||
| 2025-08-12 | 13F | Forge First Asset Management Inc. | 80,398 | -46.00 | 2,688 | -39.42 | ||||
| 2025-09-04 | 13F/A | Advisor Group Holdings, Inc. | 49,580 | -5.62 | 1,651 | 5.43 | ||||
| 2025-08-25 | 13F/A | Promus Capital, LLC | 820 | 0.00 | 27 | 12.50 | ||||
| 2025-07-22 | 13F | Jamison Private Wealth Management, Inc. | 58,619 | 0.00 | 1,964 | 12.43 | ||||
| 2025-07-28 | 13F | Td Asset Management Inc | 6,613,447 | -14.84 | 221,112 | -4.28 | ||||
| 2025-08-07 | 13F | Connor, Clark & Lunn Investment Management Ltd. | 1,227,764 | 34.18 | 41,158 | 51.17 | ||||
| 2025-08-15 | 13F | Resources Management Corp /ct/ /adv | 450 | 0.00 | 0 | |||||
| 2025-07-11 | 13F | First PREMIER Bank | 7,582 | 0.00 | 0 | |||||
| 2025-08-14 | 13F | Stone Run Capital, Llc | 48,921 | 0.03 | 1,639 | 12.50 | ||||
| 2025-08-14 | 13F | Investment Management Corp of Ontario | 28,000 | -5.41 | 938 | 6.47 | ||||
| 2025-08-14 | 13F | Two Sigma Investments, Lp | 220,030 | 23.11 | 7,371 | 38.45 | ||||
| 2025-08-13 | 13F | Russell Investments Group, Ltd. | 102,650 | 30.16 | 3,432 | 46.31 | ||||
| 2025-08-13 | 13F | Lido Advisors, LLC | 10,242 | 1.74 | 343 | 14.72 | ||||
| 2025-08-12 | 13F | Public Sector Pension Investment Board | 44,700 | 0.90 | 1,494 | 13.44 | ||||
| 2025-08-12 | 13F | J.w. Cole Advisors, Inc. | 12,722 | 1.67 | 426 | 14.52 | ||||
| 2025-08-13 | 13F | Westerkirk Capital Inc. | 23,740 | 795 | ||||||
| 2025-08-12 | 13F | LPL Financial LLC | 190,142 | 8.92 | 6,370 | 22.48 | ||||
| 2025-08-12 | 13F | Archer Investment Corp | 111 | 0.00 | 4 | 0.00 | ||||
| 2025-08-18 | 13F | Geneos Wealth Management Inc. | 562 | 0.00 | 19 | 12.50 | ||||
| 2025-05-09 | 13F | Cumberland Partners Ltd | 0 | -100.00 | 0 | |||||
| 2025-08-11 | 13F | HHM Wealth Advisors, LLC | 4,287 | 0.00 | 144 | 12.60 | ||||
| 2025-08-08 | 13F | Principal Financial Group Inc | 29,042,315 | 5.15 | 972,918 | 18.24 | ||||
| 2025-07-14 | 13F | Bank & Trust Co | 1,125 | 0.00 | 38 | 12.12 | ||||
| 2025-08-14 | 13F | Vivaldi Capital Management, LLC | 11,250 | 0.00 | 377 | 12.24 | ||||
| 2025-08-01 | 13F | CCLA Investment Management Ltd | 3,889,923 | -32.88 | 130 | -24.42 | ||||
| 2025-08-14 | 13F | Mariner, LLC | 36,205 | 55.81 | 1,213 | 75.14 | ||||
| 2025-08-14 | 13F | Citadel Advisors Llc | 11,878 | -82.30 | 398 | -80.13 | ||||
| 2025-08-14 | 13F | Citadel Advisors Llc | Put | 10,900 | -51.34 | 365 | -45.28 | |||
| 2025-05-14 | 13F | Brown Brothers Harriman & Co | 0 | -100.00 | 0 | |||||
| 2025-08-14 | 13F | Citadel Advisors Llc | Call | 102,200 | 7.02 | 3,424 | 20.36 | |||
| 2025-08-08 | 13F | Pnc Financial Services Group, Inc. | 67,371 | -5.90 | 2,257 | 5.82 | ||||
| 2025-08-18 | 13F/A | National Bank Of Canada /fi/ | 5,626,228 | 7.51 | 188,008 | 21.66 | ||||
| 2025-08-12 | 13F | MAI Capital Management | 129,884 | -4.14 | 4,351 | 7.80 | ||||
| 2025-08-14 | 13F | Quantinno Capital Management LP | 6,760 | -35.98 | 226 | -28.03 | ||||
| 2025-08-14 | 13F | CIBC World Markets Inc. | 7,151,292 | -0.83 | 239,568 | 11.52 | ||||
| 2025-06-27 | NP | PID - Invesco International Dividend Achievers ETF This fund is a listed as child fund of Invesco Ltd. and if that institution has disclosed ownership in this security, then these positions will not be double counted when calculating total shares and total value | 839,064 | 1.38 | 25,180 | -7.27 | ||||
| 2025-07-31 | 13F | Cambridge Investment Research Advisors, Inc. | 12,192 | 0.33 | 0 | |||||
| 2025-08-12 | 13F | Bowen Hanes & Co Inc | 744,748 | 0.00 | 24,949 | 12.45 | ||||
| 2025-07-25 | 13F | Apollon Wealth Management, LLC | 40,542 | 66.18 | 1,358 | 87.05 | ||||
| 2025-08-11 | 13F | Delta Asset Management Llc/tn | 3,767 | 3,263.39 | 126 | 4,100.00 | ||||
| 2025-07-31 | 13F | Washington Trust Advisors, Inc. | 10,083 | 0.00 | 338 | 12.33 | ||||
| 2025-07-30 | 13F | Whittier Trust Co | 35,521 | 0.00 | 1,190 | 12.38 | ||||
| 2025-08-14 | 13F | Two Sigma Securities, Llc | 7,030 | 236 | ||||||
| 2025-05-13 | 13F | Cresset Asset Management, LLC | 0 | -100.00 | 0 | |||||
| 2025-07-15 | 13F | Evanson Asset Management, LLC | 0 | -100.00 | 0 | |||||
| 2025-08-14 | 13F | Avenir Corp | 23,071 | 0.00 | 773 | 12.37 | ||||
| 2025-08-13 | 13F | Jones Financial Companies Lllp | 12,069 | 9.50 | 405 | 23.85 | ||||
| 2025-05-08 | 13F | We Are One Seven, LLC | 0 | -100.00 | 0 | |||||
| 2025-08-05 | 13F | Prosperity Consulting Group, LLC | 19,227 | 0.00 | 644 | 12.59 | ||||
| 2025-08-06 | 13F | Commonwealth Equity Services, Llc | 58,104 | -4.71 | 2 | 0.00 | ||||
| 2025-08-13 | 13F | New South Capital Management Inc | 0 | -100.00 | 0 | |||||
| 2025-07-14 | 13F | Pacifica Partners Inc. | 2,102 | -4.54 | 71 | 7.69 | ||||
| 2025-08-15 | 13F | Ewing Morris & Co. Investment Partners Ltd. | 17,826 | 52.67 | 597 | 37.64 | ||||
| 2025-05-15 | 13F | Grayhawk Investment Strategies Inc. | 1,656 | 0.00 | 49 | -5.77 | ||||
| 2025-08-12 | 13F | Aviso Financial Inc. | 383,100 | 30.24 | 12,832 | 46.57 | ||||
| 2025-08-15 | 13F | Chapman Financial Group, Llc | 26,103 | -1.68 | 874 | 3.68 | ||||
| 2025-05-23 | NP | XVOL - Acruence Active Hedge U.S. Equity ETF | 2,009 | -44.87 | 60 | -48.70 | ||||
| 2025-08-12 | 13F | Advisors Asset Management, Inc. | 16,682 | -19.79 | 559 | -9.85 | ||||
| 2025-08-15 | 13F | Prevail Innovative Wealth Advisors, Llc | 0 | -100.00 | 0 | |||||
| 2025-07-17 | 13F | Addenda Capital Inc. | 704,591 | 13.49 | 32,143 | 20.94 | ||||
| 2025-08-14 | 13F | Bank Of America Corp /de/ | 340,147 | 4.53 | 11,395 | 17.54 | ||||
| 2025-08-08 | 13F | Creative Planning | 65,536 | 1.00 | 2,195 | 13.61 | ||||
| 2025-08-05 | 13F | Tiaa Trust, National Association | 18,552 | -2.36 | 621 | 9.72 | ||||
| 2025-08-12 | 13F | Horizon Kinetics Asset Management Llc | 27,171 | -2.86 | 910 | 9.24 | ||||
| 2025-07-30 | 13F | Crewe Advisors LLC | 2,277 | 6.55 | 76 | 20.63 | ||||
| 2025-07-09 | 13F | Sawyer & Company, Inc | 3,750 | 0.00 | 0 | |||||
| 2025-05-06 | 13F | Proficio Capital Partners LLC | 0 | -100.00 | 0 | -100.00 | ||||
| 2025-08-13 | 13F | Northern Trust Corp | 244,863 | 2.55 | 8,203 | 15.33 | ||||
| 2025-08-08 | 13F | Empower Advisory Group, LLC | 6,837 | 229 | ||||||
| 2025-08-15 | 13F | CI Private Wealth, LLC | 18,701 | -21.37 | 626 | -11.58 | ||||
| 2025-08-13 | 13F | Truvestments Capital Llc | 2,189 | 0.00 | 73 | 12.31 | ||||
| 2025-08-13 | 13F | OMERS ADMINISTRATION Corp | 10,000 | 0.00 | 334 | 12.46 | ||||
| 2025-08-25 | NP | PRINCIPAL VARIABLE CONTRACTS FUNDS INC - MidCap Account Class 1 | 526,680 | -5.36 | 17,644 | 6.42 | ||||
| 2025-07-28 | 13F | Harbour Investments, Inc. | 2,523 | 23.13 | 85 | 37.70 | ||||
| 2025-07-31 | 13F | Cardinal Point Capital Management, ULC | 35,120 | -3.10 | 1,174 | 23.84 | ||||
| 2025-08-07 | 13F | Guardian Partners Inc. | 84,033 | -1.43 | 2,772 | 15.17 | ||||
| 2025-08-12 | 13F | Clearbridge Investments, LLC | 284,359 | -1.04 | 9,526 | 11.29 | ||||
| 2025-04-23 | 13F | Horizon Bancorp Inc /in/ | 0 | -100.00 | 0 | |||||
| 2025-08-13 | 13F | MONECO Advisors, LLC | 9,910 | 332 | ||||||
| 2025-08-08 | 13F | Hartland & Co., LLC | 77,071 | 4.33 | 2,582 | 17.32 | ||||
| 2025-08-12 | 13F | Proequities, Inc. | Put | 0 | 0 | |||||
| 2025-08-14 | 13F | Visionary Wealth Advisors | 11,371 | 9.64 | 381 | 23.38 | ||||
| 2025-07-28 | 13F | Boston Trust Walden Corp | 6,050 | 203 | ||||||
| 2025-08-12 | 13F | Proequities, Inc. | Call | 0 | 0 | |||||
| 2025-08-14 | 13F | Fmr Llc | 18,912 | 16.79 | 634 | 31.33 | ||||
| 2025-08-12 | 13F | Proequities, Inc. | 0 | 0 | ||||||
| 2025-08-14 | 13F | Colony Group, LLC | 29,074 | 17.55 | 974 | 32.34 | ||||
| 2025-07-07 | 13F | Value Partners Investments Inc. | 47,294 | 99.45 | 1,581 | 123.94 | ||||
| 2025-08-14 | 13F | Financial Network Wealth Advisors LLC | 424 | 0.00 | 14 | 16.67 | ||||
| 2025-08-15 | 13F | State of Tennessee, Treasury Department | 262,944 | 0.00 | 8,791 | 12.40 | ||||
| 2025-07-14 | 13F | GAMMA Investing LLC | 303 | 0.00 | 10 | 11.11 | ||||
| 2025-08-05 | 13F | Bank Of Montreal /can/ | 27,363,460 | -3.59 | 916,676 | 8.42 | ||||
| 2025-07-17 | 13F | Janney Montgomery Scott LLC | 22,920 | 6.86 | 1 | |||||
| 2025-08-04 | 13F | Assetmark, Inc | 195 | 0.00 | 7 | 20.00 | ||||
| 2025-07-14 | 13F | AdvisorNet Financial, Inc | 1,835 | 15.77 | 61 | 29.79 | ||||
| 2025-07-15 | 13F | Northside Capital Management, LLC | 78,723 | 2,637 | ||||||
| 2025-08-06 | 13F | North Capital, Inc. | 1,161 | 0.00 | 39 | 11.76 | ||||
| 2025-08-13 | 13F | Brown Advisory Inc | 373,503 | 2.43 | 12,512 | 15.19 | ||||
| 2025-07-25 | 13F | Lincluden Management Ltd | 576,851 | -2.28 | 19 | 11.76 | ||||
| 2025-07-08 | 13F | Nbc Securities, Inc. | 2,867 | -93.01 | 0 | -100.00 | ||||
| 2025-08-08 | 13F | Atlantic Trust, LLC | 37,544 | -1.16 | 1,258 | 11.14 | ||||
| 2025-05-29 | NP | CPAEX - Counterpoint Tactical Equity Fund Class A Shares | 12,471 | 372 | ||||||
| 2025-08-14 | 13F | GWM Advisors LLC | 8,358 | -9.90 | 280 | 1.09 | ||||
| 2025-07-24 | 13F | Stonebridge Financial Group, LLC | 0 | -100.00 | 0 | |||||
| 2025-07-21 | 13F | Credential Qtrade Securities Inc. | 12,670 | -4.94 | 396 | -5.95 | ||||
| 2025-08-07 | 13F | ProShare Advisors LLC | 24,967 | 10.28 | 836 | 24.04 | ||||
| 2025-08-14 | 13F | Creegan & Nassoura Financial Group, LLC | 6,860 | -1.79 | 230 | 10.10 | ||||
| 2025-07-31 | 13F | Schneider Downs Wealth Management Advisors, LP | 15,057 | 0.00 | 504 | 12.50 | ||||
| 2025-08-14 | 13F | Goldman Sachs Group Inc | 2,041,573 | 13.26 | 68,393 | 27.37 | ||||
| 2025-08-05 | 13F | GPS Wealth Strategies Group, LLC | 825 | -14.24 | 28 | -3.57 | ||||
| 2025-08-25 | NP | ANCFX - AMERICAN FUNDS FUNDAMENTAL INVESTORS Class A This fund is a listed as child fund of Capital World Investors and if that institution has disclosed ownership in this security, then these positions will not be double counted when calculating total shares and total value | 6,980,868 | 0.00 | 233,866 | 12.61 | ||||
| 2025-08-08 | 13F | Avantax Advisory Services, Inc. | 8,101 | -1.76 | 271 | 10.61 | ||||
| 2025-08-01 | 13F | Bessemer Group Inc | 33,099 | -0.93 | 1 | |||||
| 2025-07-30 | 13F | Rehmann Capital Advisory Group | 6,774 | 0.00 | 227 | 12.44 | ||||
| 2025-07-24 | 13F | Baskin Financial Services Inc. | 325,946 | -3.49 | 11 | 0.00 | ||||
| 2025-08-19 | 13F | Newbridge Financial Services Group, Inc. | 1,163 | -13.14 | 39 | -2.56 | ||||
| 2025-08-14 | 13F | Herold Advisors, Inc. | 95,194 | -4.76 | 3,189 | 7.09 | ||||
| 2025-08-14 | 13F | Prestige Wealth Management Group LLC | 355 | 0.00 | 12 | 10.00 | ||||
| 2025-07-23 | 13F | Tyche Wealth Partners LLC | 6,256 | 210 | ||||||
| 2025-08-12 | 13F | Jpmorgan Chase & Co | 326,649 | 278.40 | 10,943 | 325.59 | ||||
| 2025-08-14 | 13F | Cubist Systematic Strategies, LLC | 6,000 | -63.64 | 201 | -59.06 | ||||
| 2025-08-14 | 13F | Bnp Paribas Arbitrage, Sa | 41,712 | -16.96 | 1,397 | -6.62 | ||||
| 2025-07-22 | 13F | Gsa Capital Partners Llp | 20,450 | 1 | ||||||
| 2025-07-10 | 13F | Focus Financial Network, Inc. | 6,740 | 226 | ||||||
| 2025-07-22 | 13F | Valley National Advisers Inc | 45 | 0.00 | 0 | |||||
| 2025-07-25 | NP | MainStay CBRE Global Infrastructure Megatrends Fund | 670,827 | 4.68 | 22,211 | 9.27 | ||||
| 2025-07-28 | 13F | BRYN MAWR TRUST Co | 2,875 | 0.00 | 96 | 12.94 | ||||
| 2025-07-31 | 13F | Oppenheimer & Co Inc | 45,280 | -0.60 | 1,517 | 11.72 | ||||
| 2025-07-21 | 13F | Compass Planning Associates Inc | 909 | 1.11 | 30 | 15.38 | ||||
| 2025-07-31 | 13F | Briaud Financial Planning, Inc | 63 | 0.00 | 0 | |||||
| 2025-07-24 | 13F | Us Bancorp \de\ | 1,068 | -59.59 | 36 | -55.13 | ||||
| 2025-08-08 | 13F | Geode Capital Management, Llc | 18,624 | -4.17 | 687 | 5.86 | ||||
| 2025-08-04 | 13F | Buckhead Capital Management Llc | 11,072 | 0.00 | 371 | 12.46 | ||||
| 2025-06-26 | NP | AMECX - INCOME FUND OF AMERICA Class A | 22,376,603 | 0.00 | 669,058 | -8.92 | ||||
| 2025-08-04 | 13F | Arkadios Wealth Advisors | 14,410 | 483 | ||||||
| 2025-08-11 | 13F | Private Advisor Group, LLC | 28,962 | 5.02 | 970 | 18.15 | ||||
| 2025-08-18 | 13F | Wolverine Trading, Llc | Put | 0 | -100.00 | 0 | ||||
| 2025-08-18 | 13F | Wolverine Trading, Llc | Call | 0 | -100.00 | 0 | ||||
| 2025-08-12 | 13F | Wulff, Hansen & Co. | 49,327 | -11.65 | 1,652 | -0.66 | ||||
| 2025-07-29 | 13F | Private Trust Co Na | 7,606 | 1.44 | 255 | 13.90 | ||||
| 2025-08-25 | 13F/A | Neuberger Berman Group LLC | 6,609,938 | 3.35 | 221,430 | 16.22 | ||||
| 2025-08-12 | 13F | Coldstream Capital Management Inc | 0 | -100.00 | 0 | |||||
| 2025-05-12 | 13F | National Bank Of Canada /fi/ | Call | 0 | -100.00 | 0 | -100.00 | |||
| 2025-08-13 | 13F | Bank Of Nova Scotia | 3,317,616 | -7.38 | 111,111 | 4.25 | ||||
| 2025-04-25 | 13F | Farmers & Merchants Trust Co of Chambersburg PA | 0 | -100.00 | 0 | |||||
| 2025-08-08 | 13F | Arcadia Investment Management Corp/mi | 1,875 | 0.00 | 63 | 12.73 | ||||
| 2025-08-15 | 13F | Brookfield Asset Management Inc. | 4,686,497 | 0.00 | 156,998 | 12.45 | ||||
| 2025-07-22 | 13F | Belpointe Asset Management LLC | 6,882 | -28.56 | 231 | -19.58 | ||||
| 2025-08-08 | 13F | Avalon Trust Co | 187,080 | -9.18 | 6,267 | 2.13 | ||||
| 2025-07-21 | 13F | Credential Securities Inc. | 4,596 | -10.53 | 176 | -17.37 | ||||
| 2025-07-25 | 13F | Verdence Capital Advisors LLC | 7,064 | 0.41 | 237 | 12.92 | ||||
| 2025-08-08 | 13F | Larson Financial Group LLC | 1,324 | 164.80 | 44 | 214.29 | ||||
| 2025-07-18 | 13F | Chelsea Counsel Co | 39,150 | 0.00 | 1,312 | 12.34 | ||||
| 2025-08-27 | NP | FORH - Formidable ETF | 12,534 | -5.40 | 420 | 6.35 | ||||
| 2025-07-22 | 13F | Chung Wu Investment Group, LLC | 300 | 10 | ||||||
| 2025-07-29 | 13F | Stratos Wealth Partners, LTD. | 11,770 | 6.90 | 394 | 20.12 | ||||
| 2025-08-13 | 13F | SCS Capital Management LLC | 487,990 | -41.35 | 16,348 | -34.05 | ||||
| 2025-08-14 | 13F/A | Rockefeller Capital Management L.P. | 155,629 | -3.77 | 5,214 | 8.22 | ||||
| 2025-07-16 | NP | CGIC - Capital Group International Core Equity ETF Share Class | 29,069 | 165.11 | 963 | 177.23 | ||||
| 2025-08-14 | 13F | Glenview Trust Co | 6,000 | 201 | ||||||
| 2025-07-23 | 13F | Vontobel Holding Ltd. | 26,201 | 878 | ||||||
| 2025-08-05 | 13F | Sigma Planning Corp | 9,162 | 15.59 | 307 | 29.66 | ||||
| 2025-04-07 | 13F | Nexus Investment Management ULC | 0 | -100.00 | 0 | |||||
| 2025-07-07 | 13F | Walnut Private Equity Partners, Llc | 102,000 | 2.00 | 3,417 | 14.70 | ||||
| 2025-08-13 | 13F | Custom Index Systems, Llc | 0 | -100.00 | 0 | |||||
| 2025-07-24 | 13F | Eastern Bank | 4,499 | 0.00 | 151 | 11.94 | ||||
| 2025-08-15 | 13F | Tower Research Capital LLC (TRC) | 3,430 | 11,333.33 | 115 | |||||
| 2025-04-16 | 13F | Farmers & Merchants Investments Inc | 0 | -100.00 | 0 | |||||
| 2025-08-15 | 13F | Morgan Stanley | 1,271,955 | -64.14 | 42,610 | -59.67 | ||||
| 2025-08-12 | 13F | Financial Advocates Investment Management | 0 | -100.00 | 0 | |||||
| 2025-08-14 | 13F | Ancora Advisors, LLC | 625 | 0.00 | 21 | 11.11 | ||||
| 2025-07-29 | 13F | Stratos Wealth Advisors, LLC | 9,516 | -9.55 | 319 | 1.60 | ||||
| 2025-07-22 | 13F | IFS Advisors, LLC | 675 | 0.00 | 23 | 10.00 | ||||
| 2025-08-14 | 13F | Select Equity Group, L.P. | 309,830 | -88.31 | 10,379 | -86.85 | ||||
| 2025-08-19 | NP | DBALX - Davenport Balanced Income Fund | 61,867 | 0.00 | 2,073 | 12.43 | ||||
| 2025-07-24 | 13F | Blair William & Co/il | 71,913 | 116.24 | 2,409 | 143.33 | ||||
| 2025-08-13 | 13F | Colonial Trust Co / SC | 2,025 | 0.00 | 68 | 11.67 | ||||
| 2025-08-14 | 13F | Raymond James Financial Inc | 724,975 | 8.78 | 24,287 | 22.33 | ||||
| 2025-07-21 | 13F | Sterling Investment Counsel, LLC | 6,269 | 210 | ||||||
| 2025-08-26 | NP | JXI - iShares Global Utilities ETF | 44,450 | 7.18 | 1,489 | 20.76 | ||||
| 2025-08-11 | 13F | Heritage Wealth Advisors | 950 | 26.67 | 32 | 40.91 | ||||
| 2025-08-14 | 13F | Manufacturers Life Insurance Company, The | 3,980,353 | -28.06 | 133,270 | -19.16 | ||||
| 2025-08-08 | 13F | First Western Trust Bank | 9,039 | -7.22 | 303 | 4.14 | ||||
| 2025-07-18 | 13F | Truist Financial Corp | 23,616 | 1.35 | 791 | 13.98 | ||||
| 2025-07-22 | 13F | Mascoma Wealth Management LLC | 75 | 0.00 | 3 | 0.00 | ||||
| 2025-07-22 | 13F | Woodmont Investment Counsel Llc | 59,515 | 6.30 | 1,994 | 19.56 | ||||
| 2025-04-23 | 13F | Aspetuck Financial Management LLC | 0 | -100.00 | 0 | -100.00 | ||||
| 2025-08-13 | 13F | Dixon Mitchell Investment Counsel Inc. | 2,503,764 | 46.73 | 83,739 | 64.91 | ||||
| 2025-08-14 | 13F | Peapack Gladstone Financial Corp | 41,161 | -1.51 | 1 | 0.00 | ||||
| 2025-05-12 | 13F | Jarislowsky, Fraser Ltd | 0 | -100.00 | 0 | |||||
| 2025-08-04 | 13F | Creekmur Asset Management LLC | 30,258 | 37.99 | 1,014 | 55.13 | ||||
| 2025-06-25 | NP | VRAI - Virtus Real Asset Income ETF | 5,421 | 14.66 | 163 | 4.52 | ||||
| 2025-07-16 | 13F | Formidable Asset Management, LLC | 12,534 | -5.40 | 420 | 6.35 | ||||
| 2025-04-21 | 13F | Nelson, Van Denburg & Campbell Wealth Management Group, LLC | 0 | -100.00 | 0 | |||||
| 2025-08-11 | 13F | Citigroup Inc | 81,870 | 1.29 | 2,743 | 13.92 | ||||
| 2025-08-14 | 13F | Hyperion Capital Advisors LP | 96,019 | 0.00 | 3,217 | 12.45 | ||||
| 2025-08-25 | NP | AMERICAN FUNDS INSURANCE SERIES - International Growth and Income Fund Class 1 This fund is a listed as child fund of Capital World Investors and if that institution has disclosed ownership in this security, then these positions will not be double counted when calculating total shares and total value | 37,345 | 0.03 | 1,251 | 12.70 | ||||
| 2025-07-16 | 13F | PFS Partners, LLC | 266 | 1.14 | 9 | 14.29 | ||||
| 2025-08-15 | 13F | Koesten, Hirschmann & Crabtree, INC. | 52 | 2 | ||||||
| 2025-08-08 | 13F | Kane Investment Management, Inc. | 0 | -100.00 | 0 | |||||
| 2025-07-21 | 13F | Quent Capital, LLC | 0 | -100.00 | 0 | |||||
| 2025-08-12 | 13F | Franklin Resources Inc | 77,595 | -0.58 | 2,600 | 11.83 | ||||
| 2025-08-11 | 13F | Novak & Powell Financial Services, Inc. | 19,675 | -1.01 | 659 | 11.32 | ||||
| 2025-07-23 | 13F | Triasima Portfolio Management inc. | 0 | -100.00 | 0 | |||||
| 2025-04-28 | 13F | Mutual Advisors, LLC | 0 | -100.00 | 0 | -100.00 | ||||
| 2025-08-13 | 13F | Virtus Investment Advisers, Inc. | 5,274 | 10.33 | 177 | 23.94 | ||||
| 2025-08-11 | 13F | TD Waterhouse Canada Inc. | 1,576,166 | 2.61 | 52,788 | 14.33 | ||||
| 2025-07-23 | 13F | Citizens National Bank Trust Department | 622 | 0.00 | 21 | 11.11 | ||||
| 2025-08-14 | 13F | Stifel Financial Corp | 16,240 | -80.84 | 544 | -78.46 | ||||
| 2025-08-14 | 13F | Integrated Wealth Concepts LLC | 8,732 | 293 | ||||||
| 2025-08-14 | 13F | Ameriprise Financial Inc | 58,735 | 12.06 | 1,968 | 26.01 | ||||
| 2025-08-08 | 13F | Cetera Investment Advisers | 49,538 | 10.51 | 1,660 | 24.27 | ||||
| 2025-08-14 | 13F | Hrt Financial Lp | 191,061 | 362.21 | 6 | 500.00 | ||||
| 2025-07-08 | 13F | Parallel Advisors, LLC | 0 | -100.00 | 0 | |||||
| 2025-07-31 | 13F | WFA Asset Management Corp | 1,141 | 0.00 | 31 | -11.43 | ||||
| 2025-07-21 | 13F | Ameritas Advisory Services, LLC | 3,180 | -72.77 | 107 | -71.43 | ||||
| 2025-04-21 | 13F | Beacon Capital Management, LLC | 0 | -100.00 | 0 | |||||
| 2025-08-11 | 13F | Birchbrook, Inc. | 340 | 100.00 | 11 | 120.00 | ||||
| 2025-08-14 | 13F | FIL Ltd | 3,722,880 | 57.86 | 124,720 | 77.78 | ||||
| 2025-08-08 | 13F | Kingsview Wealth Management, LLC | 7,119 | 0.00 | 238 | 12.26 | ||||
| 2025-08-13 | 13F | Northwest & Ethical Investments L.P. | 112,041 | -1.73 | 3,768 | 11.05 | ||||
| 2025-04-14 | 13F | Beach Investment Counsel Inc/pa | 82,623 | -4.59 | 2 | 0.00 | ||||
| 2025-08-05 | 13F | GHP Investment Advisors, Inc. | 0 | -100.00 | 0 | |||||
| 2025-04-17 | 13F | M. Kraus & Co | 0 | -100.00 | 0 | |||||
| 2025-08-14 | 13F/A | Barclays Plc | 99 | -7.48 | 0 | |||||
| 2025-08-27 | 13F | Munro Partners | 168,180 | 5,634 | ||||||
| 2025-08-19 | 13F | Anchor Investment Management, LLC | 4,725 | -5.97 | 158 | 6.04 | ||||
| 2025-08-05 | 13F | Scarborough Advisors, LLC | 171 | 6 | ||||||
| 2025-08-04 | 13F | Bristlecone Advisors, LLC | 0 | -100.00 | 0 | |||||
| 2025-08-15 | 13F | Captrust Financial Advisors | 69,084 | 5.89 | 2,314 | 19.09 | ||||
| 2025-08-25 | NP | IGAAX - International Growth and Income Fund Class A | 1,622,383 | 0.00 | 54,351 | 12.61 | ||||
| 2025-05-06 | 13F | Venturi Wealth Management, LLC | 0 | -100.00 | 0 | |||||
| 2025-06-24 | NP | NLSAX - Neuberger Berman Long Short Fund Class A | 3,074,131 | 7.91 | 92,255 | -1.30 | ||||
| 2025-07-17 | 13F | Sound Income Strategies, LLC | 963 | 0.52 | 32 | 14.29 | ||||
| 2025-08-13 | 13F | 1832 Asset Management L.P. | 15,403,263 | -6.15 | 516,009 | 5.54 | ||||
| 2025-05-12 | 13F | Sandy Spring Bank | 225 | 0.00 | 7 | -14.29 | ||||
| 2025-08-13 | 13F | Beutel, Goodman & Co Ltd. | 16,754 | -6.99 | 0 | |||||
| 2025-07-18 | 13F | Gold Investment Management Ltd. | 164,114 | 4.01 | 5,497 | 17.06 | ||||
| 2025-08-13 | 13F | Capital Analysts, Inc. | 4,400 | 0.00 | 0 | |||||
| 2025-07-25 | 13F | Cwm, Llc | 5,628 | 79.29 | 0 | |||||
| 2025-08-14 | 13F | McIlrath & Eck, LLC | 250 | 0.00 | 8 | 14.29 | ||||
| 2025-04-25 | 13F | WASHINGTON TRUST Co | 0 | -100.00 | 0 | |||||
| 2025-08-14 | 13F | Qube Research & Technologies Ltd | 77,400 | 2,595 | ||||||
| 2025-08-15 | 13F | Morse Asset Management, Inc | 8,150 | 8.67 | 273 | 22.42 | ||||
| 2025-08-04 | 13F | Keybank National Association/oh | 37,868 | 1.51 | 1,269 | 14.13 | ||||
| 2025-08-06 | 13F | Texas Yale Capital Corp. | 34,897 | 0.00 | 1,169 | 12.51 | ||||
| 2025-08-11 | 13F | Principal Securities, Inc. | 1,263 | -38.24 | 42 | -35.38 | ||||
| 2025-08-14 | 13F | EP Wealth Advisors, Inc. | 11,048 | -46.42 | 370 | -39.74 | ||||
| 2025-08-13 | 13F | Cerity Partners LLC | 136,629 | -2.20 | 4,577 | 10.00 | ||||
| 2025-07-30 | 13F | Princeton Global Asset Management LLC | 972 | -50.00 | 33 | -43.86 | ||||
| 2025-08-07 | 13F | Cahill Financial Advisors Inc | 75,586 | 0.70 | 2,532 | 13.24 | ||||
| 2025-08-12 | 13F | Bahl & Gaynor Inc | 8,837 | -11.11 | 296 | 0.00 | ||||
| 2025-08-12 | 13F | O'shaughnessy Asset Management, Llc | 127,562 | 7.43 | 4,276 | 21.06 | ||||
| 2025-08-05 | 13F | K.J. Harrison & Partners Inc | 24,555 | 0.52 | 821 | 12.93 | ||||
| 2025-07-15 | 13F | Fifth Third Bancorp | 415 | 0.00 | 14 | 8.33 | ||||
| 2025-05-07 | 13F | David R. Rahn & Associates Inc. | 0 | -100.00 | 0 | |||||
| 2025-07-17 | 13F | Tritonpoint Wealth, Llc | 152,605 | 0.67 | 5,112 | 13.22 | ||||
| 2025-08-18 | 13F | Wolverine Trading, Llc | 0 | -100.00 | 0 | |||||
| 2025-07-17 | 13F | SC&H Financial Advisors, Inc. | 8,182 | 0.00 | 274 | 12.76 | ||||
| 2025-08-14 | 13F | Smartleaf Asset Management LLC | 300 | 0.00 | 10 | 25.00 | ||||
| 2025-07-25 | 13F | Atria Wealth Solutions, Inc. | 0 | -100.00 | 0 | |||||
| 2025-08-11 | 13F | Avantax Planning Partners, Inc. | 17,189 | 0.00 | 576 | 12.30 | ||||
| 2025-08-13 | 13F | Beacon Pointe Advisors, LLC | 0 | -100.00 | 0 | |||||
| 2025-05-19 | 13F/A | Kovitz Investment Group Partners, LLC | 0 | -100.00 | 0 | -100.00 | ||||
| 2025-07-07 | 13F | Versant Capital Management, Inc | 88 | 0.00 | 3 | 0.00 | ||||
| 2025-08-12 | 13F | CIBC Private Wealth Group, LLC | 533,323 | -6.91 | 17,866 | 15.53 | ||||
| 2025-08-04 | 13F | IFG Advisory, LLC | 40,333 | 0.47 | 1,351 | 13.05 | ||||
| 2025-08-05 | 13F | Bank of New York Mellon Corp | 0 | -100.00 | 0 | |||||
| 2025-08-07 | 13F | Tacita Capital Inc | 142,267 | -0.24 | 4,764 | 12.25 | ||||
| 2025-08-13 | 13F | JT Stratford LLC | 69,737 | 0.96 | 2,336 | 13.56 | ||||
| 2025-04-25 | 13F | Almanack Investment Partners, LLC. | 0 | -100.00 | 0 | |||||
| 2025-08-04 | 13F | Canton Hathaway, LLC | 16,407 | 0.35 | 1 | |||||
| 2025-08-14 | 13F | Summit Trail Advisors, Llc | 0 | -100.00 | 0 | |||||
| 2025-08-13 | 13F | Invesco Ltd. | 2,145,360 | -6.32 | 71,870 | 5.35 | ||||
| 2025-08-14 | 13F | SIG North Trading, ULC | Put | 204,600 | 357.72 | 6,854 | 414.95 | |||
| 2025-08-14 | 13F | SIG North Trading, ULC | 8,535 | 0.00 | 286 | 12.20 | ||||
| 2025-08-14 | 13F | SIG North Trading, ULC | Call | 329,900 | 76.98 | 11,052 | 99.05 | |||
| 2025-08-08 | 13F | SG Americas Securities, LLC | 22,940 | 113.51 | 1 | |||||
| 2025-08-15 | 13F | Kestra Advisory Services, LLC | 67,151 | 0.44 | 2,250 | 12.96 | ||||
| 2025-08-14 | 13F | Evercore Wealth Management, LLC | 6,896 | 0.00 | 231 | 12.68 | ||||
| 2025-06-27 | NP | PASIX - PACE Alternative Strategies Investments Class A | 9,220 | -78.93 | 277 | -80.77 | ||||
| 2025-08-01 | 13F | Transcend Wealth Collective, Llc | 0 | -100.00 | 0 | |||||
| 2025-08-14 | 13F | Spears Abacus Advisors LLC | 200,087 | 0.88 | 6,703 | 13.44 | ||||
| 2025-08-04 | 13F | Spire Wealth Management | 544 | 2.64 | 18 | 20.00 | ||||
| 2025-07-24 | 13F | Louisbourg Investments Inc. | 1,958 | 0.00 | 65 | 12.07 | ||||
| 2025-08-11 | 13F | HighTower Advisors, LLC | 105,716 | -5.67 | 3,541 | 6.08 | ||||
| 2025-08-12 | 13F | Virtu Financial LLC | 6,406 | 0 | ||||||
| 2025-06-30 | NP | PFM - Invesco Dividend Achievers ETF | 13,419 | -3.95 | 403 | -12.23 | ||||
| 2025-07-28 | 13F | Callahan Advisors, LLC | 25,276 | 9.77 | 847 | 23.50 | ||||
| 2025-07-30 | 13F | Evermay Wealth Management Llc | 3,200 | 0.00 | 107 | 12.63 | ||||
| 2025-08-13 | 13F | Northwestern Mutual Wealth Management Co | 3,736 | -3.36 | 125 | 8.70 | ||||
| 2025-07-17 | 13F | Lakewood Asset Management LLC | 14,369 | -6.92 | 481 | 4.79 | ||||
| 2025-08-14 | 13F | SWAN Capital LLC | 262 | 9 | ||||||
| 2025-08-14 | 13F | Warren Averett Asset Management, LLC | 118,763 | -0.36 | 3,979 | 12.06 | ||||
| 2025-08-14 | 13F | Mercer Global Advisors Inc /adv | 20,006 | -24.14 | 670 | -14.65 | ||||
| 2025-08-12 | 13F | Ci Investments Inc. | 2,698,017 | 0.34 | 90 | 12.50 | ||||
| 2025-08-08 | 13F | Crossmark Global Holdings, Inc. | 20,255 | 0.07 | 679 | 12.62 | ||||
| 2025-05-08 | 13F | Menard Financial Group LLC | 0 | -100.00 | 0 | |||||
| 2025-07-11 | 13F/A | Umb Bank N A/mo | 28,441 | -1.16 | 953 | 11.09 | ||||
| 2025-08-14 | 13F | Federation des caisses Desjardins du Quebec | 1,552,018 | -3.87 | 51,955 | 9.14 | ||||
| 2025-07-25 | 13F | Montrusco Bolton Investments Inc. | 530,720 | -10.12 | 17,744 | 1.02 | ||||
| 2025-08-14 | 13F | Two Sigma Advisers, Lp | 25,900 | -39.06 | 868 | -31.52 | ||||
| 2025-08-14 | 13F | Royal Bank Of Canada | Put | 360,000 | 12,060 | |||||
| 2025-08-12 | 13F | Rhumbline Advisers | 90 | 0.00 | 3 | 50.00 | ||||
| 2025-08-14 | 13F | Royal Bank Of Canada | 46,065,523 | 9.38 | 1,543,196 | 23.01 | ||||
| 2025-08-14 | 13F | Royal Bank Of Canada | Call | 360,000 | 12,060 | |||||
| 2025-07-10 | 13F | Wealth Enhancement Advisory Services, Llc | 22,449 | 6.38 | 765 | 21.66 | ||||
| 2025-08-21 | 13F | Pathway Financial Advisers, LLC | 31,957 | 2.85 | 1,071 | 15.68 | ||||
| 2025-08-13 | 13F | Empire Financial Management Company, LLC | 38,494 | 1.97 | 1,290 | 14.68 | ||||
| 2025-07-16 | 13F | American National Bank | 15,075 | 505 | ||||||
| 2025-08-14 | 13F | BRITISH COLUMBIA INVESTMENT MANAGEMENT Corp | 2,191,946 | 32.37 | 73,479 | 49.14 | ||||
| 2025-06-26 | NP | AWYIX - CIBC ATLAS EQUITY INCOME FUND Institutional Class Shares | 109,577 | 0.00 | 3,288 | -8.54 | ||||
| 2025-07-17 | 13F | TBH Global Asset Management, LLC | 9,297 | 0.00 | 311 | 12.68 | ||||
| 2025-07-16 | 13F | Signaturefd, Llc | 0 | -100.00 | 0 | |||||
| 2025-07-11 | 13F | Diversified Trust Co | 6,750 | 226 | ||||||
| 2025-08-13 | 13F | Natixis | 0 | -100.00 | 0 | |||||
| 2025-05-05 | 13F | Carmel Capital Partners, LLC | 0 | -100.00 | 0 | |||||
| 2025-08-05 | 13F | Huntington National Bank | 686 | 411.94 | 23 | 633.33 | ||||
| 2025-07-10 | 13F | Western Pacific Wealth Management, LP | 887 | -45.75 | 30 | -39.58 | ||||
| 2025-08-08 | 13F | Summerhill Capital Management lnc. | 233,844 | -0.54 | 7,834 | 11.85 | ||||
| 2025-06-23 | NP | PMBMX - MidCap Fund (f/k/a MidCap Blend Fund) R-3 | 25,058,456 | 5.34 | 752,004 | -3.65 | ||||
| 2025-07-07 | 13F | Investors Research Corp | 30 | 0.00 | 1 | |||||
| 2025-08-06 | 13F | Nvwm, Llc | 3,075 | 0.00 | 103 | 13.19 | ||||
| 2025-04-25 | NP | VCINX - International Growth Fund | 173,065 | -1.00 | 5,490 | -10.21 | ||||
| 2025-08-19 | 13F | State of Wyoming | 3,649 | 12.55 | 122 | 27.08 | ||||
| 2025-08-06 | 13F | Cbre Clarion Securities Llc | 670,827 | -6.29 | 22,473 | 5.38 | ||||
| 2025-08-07 | 13F | PCJ Investment Counsel Ltd. | 262,210 | -14.15 | 8,786 | -3.38 | ||||
| 2025-07-22 | 13F | Sage Investment Counsel LLC | 37,803 | 0.00 | 1,266 | 12.43 | ||||
| 2025-08-14 | 13F | Wiley Bros.-aintree Capital, Llc | 44,800 | 27.99 | 1,501 | 44.37 | ||||
| 2025-08-14 | 13F | Jane Street Group, Llc | Call | 33,000 | 29.92 | 1,106 | 46.16 | |||
| 2025-07-14 | 13F | Toth Financial Advisory Corp | 50 | 2 | ||||||
| 2025-07-09 | 13F | Epiq Partners, Llc | 101,537 | -1.60 | 3,401 | 10.67 | ||||
| 2025-08-14 | 13F | CIBC Asset Management Inc | 7,301,691 | 7.80 | 244,531 | 21.31 | ||||
| 2025-08-11 | 13F | Strategic Wealth Partners, Ltd. | 14,684 | 492 | ||||||
| 2025-08-14 | 13F | Jane Street Group, Llc | 68,076 | 2,281 | ||||||
| 2025-08-14 | 13F | ArrowMark Colorado Holdings LLC | 263,225 | -1.16 | 8,818 | 11.16 | ||||
| 2025-08-01 | 13F | Envestnet Asset Management Inc | 26,544 | -70.30 | 889 | -66.60 | ||||
| 2025-07-31 | 13F | Optimum Investment Advisors | 1,125 | -56.90 | 38 | -51.95 | ||||
| 2025-08-05 | 13F | Verity Asset Management, Inc. | 7,962 | -3.89 | 267 | 8.13 | ||||
| 2025-08-12 | 13F | Steward Partners Investment Advisory, Llc | 36,284 | 5.08 | 1,216 | 18.19 | ||||
| 2025-08-01 | 13F | GoalVest Advisory LLC | 1,697 | 0.00 | 57 | 12.00 | ||||
| 2025-08-12 | 13F | Pathstone Holdings, LLC | 9,996 | 0.00 | 335 | 12.46 | ||||
| 2025-07-28 | NP | TOLZ - ProShares DJ Brookfield Global Infrastructure ETF | 25,142 | 17.64 | 832 | 22.90 | ||||
| 2025-08-12 | 13F | Choate Investment Advisors | 8,475 | -11.72 | 284 | -0.70 | ||||
| 2025-08-14 | 13F | Group One Trading, L.p. | Call | 16,800 | -74.35 | 563 | -71.19 | |||
| 2025-08-14 | 13F | Group One Trading, L.p. | Put | 1,700 | -76.71 | 57 | -74.19 | |||
| 2025-08-19 | 13F | MRP Capital Investments, LLC | 24,025 | 15.37 | 805 | 29.68 | ||||
| 2025-08-07 | 13F | Rathbone Brothers plc | 25,192 | -5.26 | 844 | 6.44 | ||||
| 2025-08-07 | 13F | Gryphon Financial Partners LLC | 33,900 | -7.00 | 1,136 | 4.61 | ||||
| 2025-08-14 | 13F | First Manhattan Co | 1,920,635 | -0.75 | 64,342 | 11.61 | ||||
| 2025-08-13 | 13F | Mackenzie Financial Corp | 6,858,976 | -12.11 | 229,926 | -0.96 | ||||
| 2025-08-14 | 13F | Intact Investment Management Inc. | 1,367,954 | -16.69 | 45,814 | -6.23 | ||||
| 2025-05-13 | 13F | Bank Of Montreal /can/ | Call | 0 | -100.00 | 0 | -100.00 | |||
| 2025-04-23 | 13F | JCIC Asset Management Inc. | 4,821 | 5.93 | 143 | -0.69 | ||||
| 2025-08-08 | 13F | Ironwood Investment Counsel, LLC | 6,568 | 220 | ||||||
| 2025-07-25 | 13F | Sequoia Financial Advisors, LLC | 513,589 | -0.89 | 17,205 | 11.45 | ||||
| 2025-08-14 | 13F | Mml Investors Services, Llc | 7,761 | 1.03 | 0 | |||||
| 2025-05-29 | NP | MFAIX - International Advantage Portfolio Class I | 1,217,942 | -8.63 | 36,282 | -14.37 | ||||
| 2025-07-22 | 13F | Wealthcare Advisory Partners LLC | 22,867 | -8.96 | 766 | 2.41 | ||||
| 2025-08-14 | 13F | UBS Group AG | 165,030 | 4.23 | 5,529 | 17.22 | ||||
| 2025-08-13 | 13F | Fort Sheridan Advisors Llc | 61,508 | 0.00 | 2,061 | 12.45 | ||||
| 2025-08-12 | 13F | Laurel Wealth Advisors LLC | 40,200 | 3,250.00 | 1 | -97.14 |
Other Listings
| US:BIP | US$ 30.46 |