Mga Batayang Estadistika
| Pemilik Institusional | 230 total, 230 long only, 0 short only, 0 long/short - change of -0.43% MRQ |
| Alokasi Portofolio Rata-rata | 0.2293 % - change of 20.57% MRQ |
| Saham Institusional (Jangka Panjang) | 9,724,619 (ex 13D/G) - change of -0.33MM shares -3.25% MRQ |
| Nilai Institusional (Jangka Panjang) | $ 864,708 USD ($1000) |
Kepemilikan Institusional dan Pemegang Saham
Fidelity Covington Trust - Fidelity MSCI Consumer Discretionary Index ETF (US:FDIS) memiliki 230 pemilik institusional dan pemegang saham yang telah mengajukan formulir 13D/G atau 13F kepada Komisi Bursa Efek (Securities Exchange Commission/SEC). Lembaga-lembaga ini memegang total 9,724,619 saham. Pemegang saham terbesar meliputi Lido Advisors, LLC, Charles Schwab Investment Management Inc, Northern Lights Fund Trust - PFG Fidelity Institutional AM® Equity Sector Strategy Fund Class R Shares, Bank Of America Corp /de/, AE Wealth Management LLC, PFG Advisors, Richard Bernstein Advisors LLC, Agf Management Ltd, Morgan Stanley, and Envestnet Asset Management Inc .
Struktur kepemilikan institusional Fidelity Covington Trust - Fidelity MSCI Consumer Discretionary Index ETF (ARCA:FDIS) menunjukkan posisi terkini di perusahaan oleh institusi dan dana, serta perubahan terbaru dalam ukuran posisi. Pemegang saham utama dapat mencakup investor individu, reksa dana, dana lindung nilai, atau institusi. Jadwal 13D menunjukkan bahwa investor memegang (atau pernah memegang) lebih dari 5% saham perusahaan dan bermaksud (atau pernah bermaksud) untuk secara aktif mengejar perubahan strategi bisnis. Jadwal 13G menunjukkan investasi pasif lebih dari 5%.
The share price as of September 5, 2025 is 101.71 / share. Previously, on September 6, 2024, the share price was 80.81 / share. This represents an increase of 25.86% over that period.

Skor Sentimen Dana
Skor Sentimen Dana (sebelumnya dikenal sebagai Skor Akumulasi Kepemilikan) menemukan saham-saham yang paling banyak dibeli oleh dana. Ini adalah hasil dari model kuantitatif multi-faktor yang canggih yang mengidentifikasi perusahaan dengan tingkat akumulasi institusional tertinggi. Model penilaian menggunakan kombinasi dari total peningkatan pemilik yang diungkapkan, perubahan dalam alokasi portofolio pada pemilik tersebut, dan metrik lainnya. Angka berkisar dari 0 hingga 100, dengan angka yang lebih tinggi menunjukkan tingkat akumulasi yang lebih tinggi dibandingkan dengan perusahaan sejenisnya, dan 50 adalah rata-ratanya.
Frekuensi Pembaruan: Setiap Hari
Lihat Ownership Explorer, yang menyediakan daftar perusahaan dengan peringkat tertinggi.
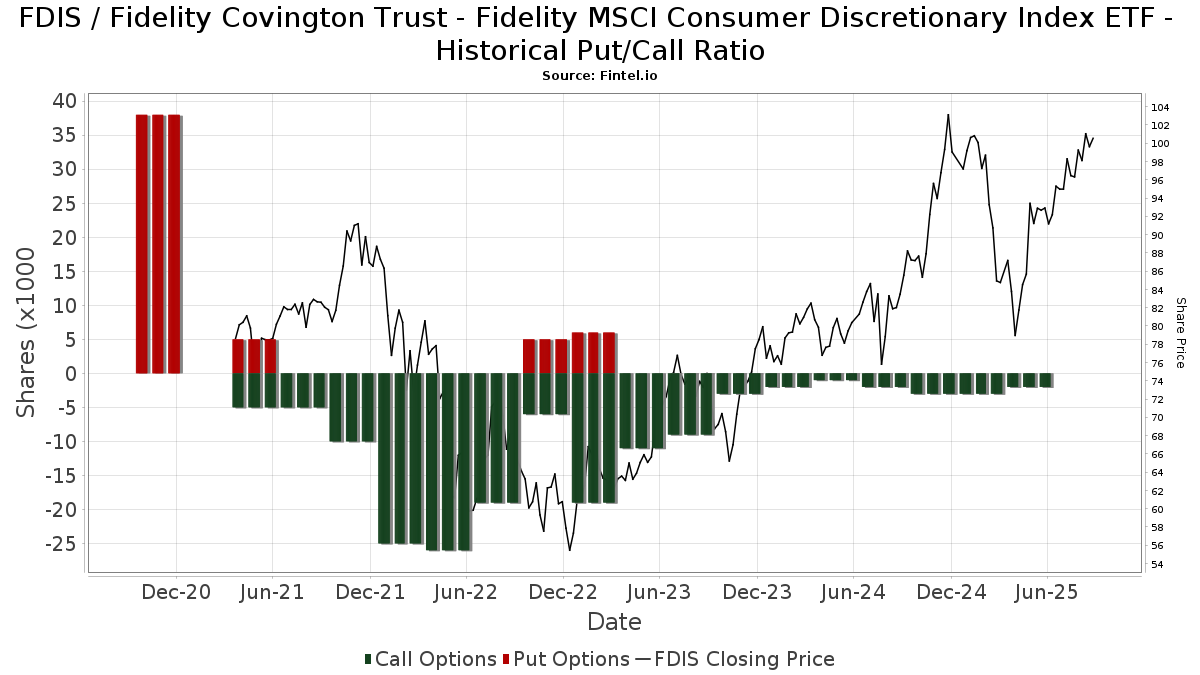
Rasio Put/Call Institusional
Selain melaporkan isu ekuitas dan utang standar, institusi dengan aset di bawah manajemen lebih dari 100 juta dolar AS juga harus mengungkapkan kepemilikan opsi put dan call mereka. Karena opsi put umumnya menunjukkan sentimen negatif, dan opsi call menunjukkan sentimen positif, kita dapat mengetahui sentimen institusional secara keseluruhan dengan memplot rasio put terhadap call. Grafik di sebelah kanan memplot rasio put/call historis untuk instrumen ini.
Menggunakan Rasio Put/Call sebagai indikator sentimen investor mengatasi salah satu kekurangan utama dari penggunaan total kepemilikan institusional, yaitu sejumlah besar aset yang dikelola diinvestasikan secara pasif untuk melacak indeks. Dana yang dikelola secara pasif biasanya tidak membeli opsi, sehingga indikator rasio put/call lebih akurat dalam melacak sentimen dana yang dikelola secara aktif.
Pengajuan 13F dan NPORT
Detail pada pengajuan 13F tersedia gratis. Detail pada pengajuan NP memerlukan keanggotaan premium. Baris berwarna hijau menunjukkan posisi baru. Baris berwarna merah menunjukkan posisi yang sudah ditutup. Klik tautan ini ikon untuk melihat riwayat transaksi selengkapnya.
Tingkatkan
untuk membuka data premium dan mengekspor ke Excel ![]() .
.
| Tanggal File | Sumber | Investor | Ketik | Presyo ng Avg (Silangan) |
Saham | Δ Saham (%) |
Dilaporkan Nilai ($1000) |
Nilai Δ (%) |
Alokasi Port (%) |
|
|---|---|---|---|---|---|---|---|---|---|---|
| 2025-08-12 | 13F | Steward Partners Investment Advisory, Llc | 38,176 | 2,104.16 | 3,591 | 2,359.59 | ||||
| 2025-05-05 | 13F | Eagle Bay Advisors LLC | 0 | -100.00 | 0 | |||||
| 2025-08-12 | 13F | Jpmorgan Chase & Co | 1,072 | 136.12 | 101 | 163.16 | ||||
| 2025-08-29 | 13F | Centaurus Financial, Inc. | 5,249 | 1.04 | 0 | |||||
| 2025-07-15 | 13F | Financial Partners Group, Inc | 0 | -100.00 | 0 | |||||
| 2025-07-21 | 13F | Ameritas Advisory Services, LLC | 11,194 | -25.72 | 1,053 | -27.63 | ||||
| 2025-08-11 | 13F | Brass Tax Wealth Management, Inc | 0 | -100.00 | 0 | |||||
| 2025-08-14 | 13F | Snowden Capital Advisors LLC | 9,972 | -0.75 | 938 | 10.48 | ||||
| 2025-08-08 | 13F | Capital Investment Advisory Services, LLC | 1,625 | 0.00 | 153 | 10.95 | ||||
| 2025-05-14 | 13F | Boston Private Wealth Llc | 0 | -100.00 | 0 | |||||
| 2025-07-17 | 13F | Janney Montgomery Scott LLC | 28,042 | -3.52 | 3 | 0.00 | ||||
| 2025-07-07 | 13F | Investors Research Corp | 11,902 | 12.61 | 1,120 | 25.31 | ||||
| 2025-08-04 | 13F | Creative Financial Designs Inc /adv | 6,836 | -10.89 | 643 | -0.77 | ||||
| 2025-08-04 | 13F | Spire Wealth Management | 8,391 | -3.73 | 789 | 7.20 | ||||
| 2025-08-08 | 13F | Trustco Bank Corp N Y | 2,800 | 0.00 | 263 | 11.44 | ||||
| 2025-08-12 | 13F | Integrated Advisors Network LLC | 3,551 | -40.11 | 334 | -33.33 | ||||
| 2025-08-14 | 13F | Hilton Capital Management, LLC | 6,300 | -19.34 | 593 | -10.30 | ||||
| 2025-07-17 | 13F | Keystone Global Partners, LLC | 52,522 | -2.38 | 4,941 | 8.67 | ||||
| 2025-08-01 | 13F | Advisory Alpha, LLC | 2,684 | 2.48 | 252 | 14.03 | ||||
| 2025-07-17 | 13F | Beacon Capital Management, LLC | 63 | 0.00 | 6 | 0.00 | ||||
| 2025-08-08 | 13F | IMA Wealth, Inc. | 261 | 0.00 | 25 | 9.09 | ||||
| 2025-07-15 | 13F | Fifth Third Bancorp | 257 | 0.00 | 24 | 14.29 | ||||
| 2025-08-14 | 13F | Stifel Financial Corp | 60,545 | -4.22 | 5,695 | 6.61 | ||||
| 2025-08-18 | 13F/A | National Bank Of Canada /fi/ | 284 | 294.44 | 27 | 333.33 | ||||
| 2025-05-16 | 13F | Signature Estate & Investment Advisors Llc | 0 | -100.00 | 0 | |||||
| 2025-07-01 | 13F | Harbor Investment Advisory, Llc | 3,530 | -2.75 | 332 | 8.50 | ||||
| 2025-08-12 | 13F | Charles Schwab Investment Management Inc | 1,211,514 | -2.77 | 113,967 | 8.23 | ||||
| 2025-08-01 | 13F | Envestnet Asset Management Inc | 149,777 | -34.20 | 14,090 | -26.75 | ||||
| 2025-07-02 | 13F | Crumly & Associates Inc. | 4,216 | 0.00 | 397 | 11.24 | ||||
| 2025-08-13 | 13F | Advocacy Wealth Management Services, LLC | 27,955 | -18.17 | 2,630 | -8.94 | ||||
| 2025-08-14 | 13F | Dagco, Inc. | 350 | 0.00 | 33 | 10.34 | ||||
| 2025-08-18 | 13F | Geneos Wealth Management Inc. | 0 | -100.00 | 0 | |||||
| 2025-08-07 | 13F | Kestra Private Wealth Services, Llc | 23,118 | 11.40 | 2,175 | 24.02 | ||||
| 2025-04-23 | 13F | Mascagni Wealth Management, Inc. | 0 | -100.00 | 0 | |||||
| 2025-08-12 | 13F | Atlas Capital Advisors Llc | 55,346 | -12.20 | 5,206 | -2.27 | ||||
| 2025-08-14 | 13F | Quantinno Capital Management LP | 2,240 | 211 | ||||||
| 2025-08-14 | 13F | Susquehanna International Group, Llp | 25,900 | -16.49 | 2,436 | -7.02 | ||||
| 2025-08-11 | 13F | Regal Investment Advisors LLC | 18,372 | 6.57 | 1,728 | 18.68 | ||||
| 2025-08-12 | 13F | Franklin Resources Inc | 3,000 | -34.54 | 282 | -27.13 | ||||
| 2025-08-13 | 13F | Cary Street Partners Financial Llc | 0 | -100.00 | 0 | |||||
| 2025-07-17 | 13F | Wolff Wiese Magana Llc | 15 | 0.00 | 1 | 0.00 | ||||
| 2025-08-05 | 13F | Sigma Planning Corp | 24,022 | 2.47 | 2,260 | 14.03 | ||||
| 2025-08-14 | 13F | Bnp Paribas Arbitrage, Sa | 0 | -100.00 | 0 | |||||
| 2025-05-01 | 13F | Quest 10 Wealth Builders, Inc. | 0 | -100.00 | 0 | |||||
| 2025-07-16 | 13F | Fischer Financial Services, Inc. | 141,243 | 0.51 | 13,285 | 11.86 | ||||
| 2025-08-07 | 13F | Allworth Financial LP | 245 | 8.41 | 23 | 27.78 | ||||
| 2025-07-23 | 13F | Pillar Financial Advisors, LLC | 34 | 0.00 | 3 | 50.00 | ||||
| 2025-08-12 | 13F | Proequities, Inc. | 0 | 0 | ||||||
| 2025-07-14 | 13F | Ridgewood Investments LLC | 116 | 0.00 | 11 | 11.11 | ||||
| 2025-07-29 | 13F | Stratos Wealth Advisors, LLC | 7,038 | 8.73 | 662 | 21.02 | ||||
| 2025-08-04 | 13F | AlphaStar Capital Management, LLC | 10,790 | 1,015 | ||||||
| 2025-07-16 | 13F | Brown, Lisle/cummings, Inc. | 12 | 0.00 | 1 | 0.00 | ||||
| 2025-08-14 | 13F | Sunbelt Securities, Inc. | 8,323 | -3.99 | 811 | 10.79 | ||||
| 2025-05-15 | 13F/A | Orion Portfolio Solutions, LLC | 16,140 | -1.33 | 1,364 | -14.49 | ||||
| 2025-05-01 | 13F | Grant/GrossMendelsohn, LLC | 0 | -100.00 | 0 | -100.00 | ||||
| 2025-08-07 | 13F | Evoke Wealth, Llc | 2,377 | 224 | ||||||
| 2025-08-12 | 13F | Howe & Rusling Inc | 397 | 37 | ||||||
| 2025-08-06 | 13F | Aspetuck Financial Management LLC | 7,108 | 5.51 | 669 | 17.40 | ||||
| 2025-08-12 | 13F | SRS Capital Advisors, Inc. | 406 | 38 | ||||||
| 2025-08-15 | 13F | Kestra Advisory Services, LLC | 80,617 | 9.19 | 7,584 | 21.54 | ||||
| 2025-05-05 | 13F | Lindbrook Capital, Llc | 209 | 0.00 | 18 | -15.00 | ||||
| 2025-07-16 | 13F | Southern Capital Advisors, Llc | 17,237 | 9.79 | 1,622 | 22.25 | ||||
| 2025-07-24 | 13F | Robertson Stephens Wealth Management, LLC | 4,113 | -3.72 | 387 | 6.93 | ||||
| 2025-08-14 | 13F | GWM Advisors LLC | 15,200 | -9.38 | 1,430 | 0.85 | ||||
| 2025-08-12 | 13F | BlackRock, Inc. | 1 | -99.94 | 0 | -100.00 | ||||
| 2025-08-06 | 13F | Soltis Investment Advisors LLC | 6,701 | -3.94 | 630 | 6.96 | ||||
| 2025-07-22 | 13F | Yoder Wealth Management, Inc. | 42,187 | 2.00 | 3,969 | 13.53 | ||||
| 2025-08-08 | 13F | Pnc Financial Services Group, Inc. | 1,456 | -10.01 | 137 | 0.00 | ||||
| 2025-08-04 | 13F | Pensionmark Financial Group, Llc | 6,267 | -5.19 | 590 | 5.56 | ||||
| 2025-08-04 | 13F | Atria Investments Llc | 4,658 | -45.41 | 438 | -39.25 | ||||
| 2025-08-13 | 13F | KDK Private Wealth Management, LLC | 16,333 | -1.03 | 1,536 | 10.27 | ||||
| 2025-07-16 | 13F/A | CX Institutional | 34,586 | 25.53 | 3 | 50.00 | ||||
| 2025-08-13 | 13F | Fisher Asset Management, LLC | 70,644 | 0.19 | 6,646 | 11.53 | ||||
| 2025-07-31 | 13F | Moser Wealth Advisors, LLC | 48 | 5 | ||||||
| 2025-05-02 | 13F | Dakota Wealth Management | 0 | -100.00 | 0 | |||||
| 2025-08-01 | 13F | Penobscot Wealth Management | 32,417 | 9.20 | 3,049 | 21.57 | ||||
| 2025-07-30 | 13F | Gables Capital Management Inc. | 192 | 0.00 | 18 | 12.50 | ||||
| 2025-08-06 | 13F | Agf Management Ltd | 274,125 | 1.50 | 25,787 | 12.98 | ||||
| 2025-07-16 | 13F | Signature Resources Capital Management, LLC | 512 | 48 | ||||||
| 2025-08-15 | 13F | Morgan Stanley | 182,082 | 14.74 | 17,129 | 27.73 | ||||
| 2025-08-08 | 13F | Cetera Investment Advisers | 52,344 | -10.05 | 4,924 | 0.14 | ||||
| 2025-08-11 | 13F | Brown Brothers Harriman & Co | 1,839 | 173 | ||||||
| 2025-08-11 | 13F | SFI Advisors, LLC | 50,029 | -4.88 | 4,706 | 5.90 | ||||
| 2025-08-14 | 13F | Benjamin Edwards Inc | 4,033 | -18.01 | 379 | -8.67 | ||||
| 2025-07-14 | 13F | Hoey Investments, Inc | 83 | 0.00 | 8 | 0.00 | ||||
| 2025-08-08 | 13F | Meridian Wealth Management, LLC | 8,999 | -3.86 | 847 | 6.95 | ||||
| 2025-04-23 | 13F | Chevy Chase Trust Holdings, Inc. | 0 | -100.00 | 0 | |||||
| 2025-08-13 | 13F | Jones Financial Companies Lllp | 10,192 | 3.65 | 964 | 15.88 | ||||
| 2025-08-14 | 13F | Glenmede Investment Management, LP | 442 | 42 | ||||||
| 2025-04-24 | 13F | Wingate Wealth Advisors, Inc. | 0 | -100.00 | 0 | |||||
| 2025-08-12 | 13F | O'shaughnessy Asset Management, Llc | 20,170 | 14.30 | 1,897 | 27.23 | ||||
| 2025-08-13 | 13F | Colonial Trust Advisors | 831 | 0.00 | 78 | 11.43 | ||||
| 2025-05-15 | 13F | Minot DeBlois Advisors LLC | 0 | -100.00 | 0 | |||||
| 2025-08-14 | 13F | Bank Of America Corp /de/ | 923,778 | -41.65 | 86,900 | -35.05 | ||||
| 2025-07-25 | 13F | Apollon Wealth Management, LLC | 106,915 | 2.17 | 10,058 | 13.73 | ||||
| 2025-08-14 | 13F | EP Wealth Advisors, Inc. | 20,229 | -5.24 | 1,903 | 5.43 | ||||
| 2025-08-12 | 13F | Coldstream Capital Management Inc | 0 | -100.00 | 0 | |||||
| 2025-03-21 | 13F | Prostatis Group LLC | 0 | -100.00 | 0 | |||||
| 2025-07-31 | 13F | Cambridge Investment Research Advisors, Inc. | 32,439 | -8.62 | 3 | 0.00 | ||||
| 2025-08-08 | 13F | Crossmark Global Holdings, Inc. | 8,730 | 0.00 | 822 | 11.38 | ||||
| 2025-08-14 | 13F | UBS Group AG | 21,249 | -17.57 | 1,999 | -8.26 | ||||
| 2025-08-06 | 13F | Richard Bernstein Advisors LLC | 506,198 | -45.95 | 47,621 | -39.84 | ||||
| 2025-08-13 | 13F | Renaissance Technologies Llc | 0 | -100.00 | 0 | |||||
| 2025-08-06 | 13F | Csenge Advisory Group | 2,711 | -7.76 | 250 | 7.30 | ||||
| 2025-04-29 | 13F | Element Wealth, LLC | 0 | -100.00 | 0 | |||||
| 2025-07-08 | 13F | Nbc Securities, Inc. | 5,725 | 0.56 | 1 | |||||
| 2025-08-14 | 13F | Fmr Llc | 44,542 | 16.11 | 4,190 | 29.28 | ||||
| 2025-07-24 | 13F | IFP Advisors, Inc | 1,347 | 0.00 | 127 | 11.50 | ||||
| 2025-05-14 | 13F | Oarsman Capital, Inc. | 0 | -100.00 | 0 | -100.00 | ||||
| 2025-08-05 | 13F | Dunhill Financial, LLC | 123 | 0.00 | 12 | 10.00 | ||||
| 2025-05-12 | 13F | Founders Financial Securities Llc | 0 | -100.00 | 0 | |||||
| 2025-07-28 | 13F | Harbour Investments, Inc. | 67 | 63.41 | 6 | 100.00 | ||||
| 2025-08-12 | 13F | AlphaCore Capital LLC | 185 | 17 | ||||||
| 2025-08-14 | 13F | Citadel Advisors Llc | Call | 2,400 | -20.00 | 226 | -11.07 | |||
| 2025-07-10 | 13F | Charter Oak Capital Management, LLC | 6,891 | -9.33 | 648 | 0.93 | ||||
| 2025-08-14 | 13F | CoreCap Advisors, LLC | 1,434 | 52.39 | 135 | 69.62 | ||||
| 2025-08-14 | 13F | Mercer Global Advisors Inc /adv | 4,694 | 7.86 | 442 | 20.16 | ||||
| 2025-08-08 | 13F | Capital Investment Counsel, Inc | 0 | -100.00 | 0 | |||||
| 2025-08-14 | 13F | Kovitz Investment Group Partners, LLC | 14,148 | -54.64 | 1,331 | -49.53 | ||||
| 2025-08-19 | 13F | Advisory Services Network, LLC | 7,269 | -84.71 | 697 | -82.65 | ||||
| 2025-08-12 | 13F | CIBC Private Wealth Group, LLC | 123 | -38.19 | 12 | -21.43 | ||||
| 2025-07-23 | 13F | Monte Financial Group, LLC | 2,518 | 237 | ||||||
| 2025-07-24 | 13F | Blair William & Co/il | 646 | -11.14 | 61 | -1.64 | ||||
| 2025-08-19 | 13F | Newbridge Financial Services Group, Inc. | 42 | 0.00 | 4 | 0.00 | ||||
| 2025-08-01 | 13F | Chilton Capital Management Llc | 527 | -2.23 | 50 | 8.89 | ||||
| 2025-07-09 | 13F | Tounjian Advisory Partners, Llc | 7,778 | -3.21 | 657 | -3.24 | ||||
| 2025-07-15 | 13F | MCF Advisors LLC | 46 | 0.00 | 4 | 33.33 | ||||
| 2025-08-14 | 13F | Jane Street Group, Llc | 29,207 | 5.00 | 2,748 | 16.89 | ||||
| 2025-08-14 | 13F | Raymond James Financial Inc | 12,375 | 8.97 | 1,164 | 21.38 | ||||
| 2025-04-18 | 13F | Global Trust Asset Management, LLC | 0 | -100.00 | 0 | |||||
| 2025-08-12 | 13F | Guerra Advisors Inc | 40,462 | 32.67 | 3,806 | 47.69 | ||||
| 2025-08-14 | 13F | Wells Fargo & Company/mn | 24,309 | -11.66 | 2,287 | -1.68 | ||||
| 2025-07-25 | 13F | Ellis Investment Partners, LLC | 13,541 | -1.63 | 1,274 | 9.46 | ||||
| 2025-08-04 | 13F | Amplius Wealth Advisors, LLC | 2,391 | 0.93 | 225 | 12.00 | ||||
| 2025-07-28 | 13F | Rosenberg Matthew Hamilton | 2,434 | 0.00 | 229 | 11.22 | ||||
| 2025-08-01 | 13F | Transcend Wealth Collective, Llc | 0 | -100.00 | 0 | |||||
| 2025-06-30 | NP | Northern Lights Fund Trust - PFG Fidelity Institutional AM® Equity Sector Strategy Fund Class R Shares | 932,856 | 157.89 | 78,845 | 115.21 | ||||
| 2025-08-01 | 13F | Bessemer Group Inc | 0 | -100.00 | 0 | |||||
| 2025-07-17 | 13F | Fifth Third Securities, Inc. | 4,003 | 0.00 | 377 | 11.24 | ||||
| 2025-08-05 | 13F | Lifeworks Advisors, LLC | 24,831 | -4.32 | 2,336 | 6.48 | ||||
| 2025-07-25 | 13F | Atria Wealth Solutions, Inc. | 12,651 | -49.56 | 1,213 | -42.76 | ||||
| 2025-05-01 | 13F | Q3 Asset Management | 0 | -100.00 | 0 | |||||
| 2025-09-04 | 13F/A | Advisor Group Holdings, Inc. | 101,608 | 48.17 | 9,504 | 63.61 | ||||
| 2025-07-29 | 13F | Private Trust Co Na | 47 | 38.24 | 4 | 100.00 | ||||
| 2025-07-28 | 13F | BRYN MAWR TRUST Co | 200 | 0.00 | 19 | 12.50 | ||||
| 2025-08-26 | 13F/A | Thrivent Financial For Lutherans | 23,026 | -19.43 | 2 | 0.00 | ||||
| 2025-08-11 | 13F | TD Waterhouse Canada Inc. | 250 | 0.00 | 24 | 9.52 | ||||
| 2025-07-17 | 13F | Avondale Wealth Management | 1,248 | 0.00 | 117 | 11.43 | ||||
| 2025-07-22 | 13F | Grimes & Company, Inc. | 2,959 | 278 | ||||||
| 2025-08-14 | 13F | Citadel Advisors Llc | 0 | -100.00 | 0 | |||||
| 2025-05-02 | 13F | Cullen/frost Bankers, Inc. | 0 | -100.00 | 0 | |||||
| 2025-08-21 | 13F | Pathway Financial Advisers, LLC | 16,339 | 1.26 | 1,537 | 12.77 | ||||
| 2025-08-13 | 13F | Level Four Advisory Services, Llc | 7,927 | 0.37 | 746 | 11.69 | ||||
| 2025-08-14 | 13F | Old Mission Capital Llc | 4,705 | 443 | ||||||
| 2025-08-11 | 13F | Aptus Capital Advisors, LLC | 35 | 0.00 | 3 | 50.00 | ||||
| 2025-07-11 | 13F | Farther Finance Advisors, LLC | 8,349 | -25.80 | 785 | -18.31 | ||||
| 2025-08-14 | 13F | Mml Investors Services, Llc | 5,259 | -74.78 | 0 | -100.00 | ||||
| 2025-07-15 | 13F | Lynch & Associates/in | 18,262 | 0.45 | 1,718 | 11.78 | ||||
| 2025-08-27 | 13F/A | Brinker Capital Investments, LLC | 16,987 | 5.25 | 1,598 | 17.24 | ||||
| 2025-07-23 | 13F | Heck Capital Advisors, LLC | 8,516 | -55.24 | 801 | -50.19 | ||||
| 2025-08-14 | 13F | Redwood Financial Network Corp | 2,614 | 246 | ||||||
| 2025-08-13 | 13F | Green Harvest Asset Management LLC | 6,440 | -4.39 | 606 | 6.33 | ||||
| 2025-04-23 | 13F | PMV Capital Advisers, LLC | 0 | -100.00 | 0 | |||||
| 2025-08-08 | 13F | Hartland & Co., LLC | 618 | 0.00 | 58 | 11.54 | ||||
| 2025-05-01 | 13F | High Note Wealth, LLC | 0 | -100.00 | 0 | |||||
| 2025-07-09 | 13F | Bank of New Hampshire | 84 | 0.00 | 8 | 0.00 | ||||
| 2025-07-31 | 13F | Sage Mountain Advisors LLC | 1,011 | 0.00 | 95 | 11.76 | ||||
| 2025-08-05 | 13F | Bank of New York Mellon Corp | 5,040 | -49.07 | 474 | -43.30 | ||||
| 2025-08-14 | 13F | Qube Research & Technologies Ltd | 1,954 | -12.10 | 184 | -2.14 | ||||
| 2025-07-24 | 13F | Ronald Blue Trust, Inc. | 1,377 | -42.12 | 130 | -35.82 | ||||
| 2025-07-25 | 13F | Envestnet Portfolio Solutions, Inc. | 0 | -100.00 | 0 | |||||
| 2025-07-30 | 13F | Princeton Global Asset Management LLC | 549 | 0.00 | 52 | 10.87 | ||||
| 2025-08-19 | 13F | National Asset Management, Inc. | 5,536 | -6.58 | 521 | -9.88 | ||||
| 2025-08-05 | 13F | EPG Wealth Management LLC | 44 | 0.00 | 4 | 33.33 | ||||
| 2025-08-08 | 13F | Glassman Wealth Services | 0 | -100.00 | 0 | |||||
| 2025-05-08 | NP | QALTX - Quantified Alternative Investment Fund Investor Class Shares | 0 | -100.00 | 0 | -100.00 | ||||
| 2025-07-28 | 13F | J.Safra Asset Management Corp | 6,869 | -28.22 | 650 | -19.68 | ||||
| 2025-08-14 | 13F | Hrt Financial Lp | 0 | -100.00 | 0 | |||||
| 2025-08-11 | 13F | Mach-1 Financial Group, Inc. | 0 | -100.00 | 0 | |||||
| 2025-07-10 | 13F | Wealth Enhancement Advisory Services, Llc | 6,827 | -3.36 | 655 | 9.55 | ||||
| 2025-08-01 | 13F | SYM FINANCIAL Corp | 524 | 49 | ||||||
| 2025-08-11 | 13F | Pineridge Advisors LLC | 91 | 0.00 | 9 | 14.29 | ||||
| 2025-04-30 | 13F | Round Rock Advisors, LLC | 0 | -100.00 | 0 | |||||
| 2025-07-24 | 13F | Us Bancorp \de\ | 63 | 0.00 | 6 | 0.00 | ||||
| 2025-08-11 | 13F | HighTower Advisors, LLC | 83,953 | 108.96 | 7,897 | 132.61 | ||||
| 2025-08-12 | 13F | MAI Capital Management | 808 | -8.29 | 76 | 2.70 | ||||
| 2025-08-12 | 13F | J.w. Cole Advisors, Inc. | 19,225 | 143.35 | 1,809 | 171.06 | ||||
| 2025-05-02 | 13F | Capital A Wealth Management, LLC | 63 | 425.00 | 5 | 400.00 | ||||
| 2025-08-14 | 13F | Glen Eagle Advisors, LLC | 1,404 | 0.00 | 132 | 11.86 | ||||
| 2025-08-13 | 13F | Whalerock Point Partners, Llc | 3,678 | 0.03 | 346 | 11.29 | ||||
| 2025-04-29 | 13F | Hm Payson & Co | 172 | 0.00 | 15 | -12.50 | ||||
| 2025-08-25 | 13F/A | Promus Capital, LLC | 210 | 0.00 | 20 | 11.76 | ||||
| 2025-07-08 | 13F | Ehrlich Financial Group | 2,199 | -45.11 | 207 | -39.05 | ||||
| 2025-07-10 | 13F | Fulton Bank, N.a. | 2,310 | -34.69 | 217 | -27.18 | ||||
| 2025-08-05 | 13F | GHP Investment Advisors, Inc. | 36 | 0.00 | 3 | 0.00 | ||||
| 2025-08-04 | 13F | Linscomb & Williams, Inc. | 3,455 | 0.00 | 325 | 11.68 | ||||
| 2025-08-14 | 13F | IHT Wealth Management, LLC | 4,564 | 429 | ||||||
| 2025-08-06 | 13F | Decker Retirement Planning Inc. | 364 | 0.00 | 34 | 13.33 | ||||
| 2025-08-08 | 13F | Independence Financial Advisors, LLC | 58,594 | 5,512 | ||||||
| 2025-08-08 | 13F | Creative Planning | 5,361 | 2.56 | 504 | 14.29 | ||||
| 2025-07-28 | 13F | Axxcess Wealth Management, Llc | 0 | -100.00 | 0 | |||||
| 2025-08-14 | 13F | D. E. Shaw & Co., Inc. | 2,148 | 202 | ||||||
| 2025-08-04 | 13F | Arkadios Wealth Advisors | 2,706 | 4.52 | 255 | 16.51 | ||||
| 2025-08-12 | 13F | PKS Advisory Services, LLC | 3,251 | 0.03 | 306 | 11.31 | ||||
| 2025-07-23 | 13F | Proffitt & Goodson Inc | 695 | 0.00 | 65 | 12.07 | ||||
| 2025-08-15 | 13F | CI Private Wealth, LLC | 2,410 | -41.16 | 227 | -34.68 | ||||
| 2025-08-04 | 13F | Assetmark, Inc | 65,079 | 16.65 | 6,122 | 29.85 | ||||
| 2025-08-13 | 13F | Colonial Trust Co / SC | 605 | -40.34 | 57 | -34.12 | ||||
| 2025-07-30 | 13F | Brookstone Capital Management | 0 | -100.00 | 0 | |||||
| 2025-08-11 | 13F | Beaumont Capital Management, LLC | 0 | -100.00 | 0 | |||||
| 2025-08-13 | 13F | Summit Financial, LLC | 8,277 | 6.88 | 779 | 18.96 | ||||
| 2025-07-16 | 13F | American National Bank | 7,054 | 1.38 | 664 | 12.76 | ||||
| 2025-08-11 | 13F | Principal Securities, Inc. | 11 | -90.68 | 1 | -90.91 | ||||
| 2025-07-07 | 13F | Roxbury Financial LLC | 133 | 3.10 | 13 | 9.09 | ||||
| 2025-08-14 | 13F | Goldman Sachs Group Inc | 0 | -100.00 | 0 | |||||
| 2025-04-30 | 13F | Personal Cfo Solutions, Llc | 0 | -100.00 | 0 | |||||
| 2025-07-08 | 13F | Parallel Advisors, LLC | 35 | 0.00 | 3 | 50.00 | ||||
| 2025-08-14 | 13F | Integrated Wealth Concepts LLC | 2,405 | 226 | ||||||
| 2025-08-05 | 13F | Simplex Trading, Llc | 102 | 131.82 | 0 | |||||
| 2025-08-13 | 13F | Northwestern Mutual Wealth Management Co | 41,619 | -35.95 | 3,915 | -28.70 | ||||
| 2025-08-05 | 13F | Bank Of Montreal /can/ | 112 | -6.67 | 11 | 0.00 | ||||
| 2025-08-06 | 13F | Stonebridge Financial Planning Group, LLC | 8,710 | 3.54 | 819 | 15.35 | ||||
| 2025-07-22 | 13F | DAVENPORT & Co LLC | 0 | -100.00 | 0 | |||||
| 2025-08-14 | 13F | Comerica Bank | 1,779 | -22.45 | 167 | -13.47 | ||||
| 2025-08-04 | 13F | Barnes Dennig Private Wealth Management LLC | 253 | 0.00 | 24 | 9.52 | ||||
| 2025-08-07 | 13F | Addison Advisors LLC | 522 | 0.00 | 49 | 11.36 | ||||
| 2025-07-21 | 13F | HighMark Wealth Management LLC | 190 | 0.00 | 18 | 6.25 | ||||
| 2025-07-22 | 13F | Gsa Capital Partners Llp | 5,157 | 0 | ||||||
| 2025-08-06 | 13F | AE Wealth Management LLC | 679,914 | 4.51 | 63,959 | 16.33 | ||||
| 2025-08-01 | 13F | Schmidt P J Investment Management Inc | 14,208 | 34.05 | 1,337 | 49.27 | ||||
| 2025-07-23 | 13F | Magnolia Capital Management Ltd | 7,685 | 0.00 | 1 | |||||
| 2025-07-23 | 13F | Hall Capital Management Co Inc | 5,407 | -7.68 | 509 | 2.83 | ||||
| 2025-08-12 | 13F | Pathstone Holdings, LLC | 2,812 | -66.91 | 265 | -64.71 | ||||
| 2025-07-17 | 13F | Smith, Salley & Associates | 24,274 | 0.43 | 2,283 | 11.80 | ||||
| 2025-08-06 | 13F | Kcm Investment Advisors Llc | 50,632 | -0.09 | 4,763 | 11.21 | ||||
| 2025-08-08 | 13F | Gts Securities Llc | 0 | -100.00 | 0 | |||||
| 2025-08-14 | 13F | Mariner, LLC | 53,836 | 5.28 | 5,064 | 17.20 | ||||
| 2025-07-16 | 13F | Signaturefd, Llc | 618 | -1.59 | 58 | 9.43 | ||||
| 2025-08-13 | 13F | Lido Advisors, LLC | 1,359,670 | -8.97 | 127,904 | 1.33 | ||||
| 2025-08-14 | 13F | Van Eck Associates Corp | 111 | 0.00 | 0 | |||||
| 2025-05-13 | 13F | ASB Consultores, LLC | 0 | -100.00 | 0 | |||||
| 2025-08-05 | 13F | Huntington National Bank | 0 | |||||||
| 2025-08-14 | 13F/A | Rockefeller Capital Management L.P. | 13,950 | 2.78 | 1,312 | 14.39 | ||||
| 2025-07-16 | 13F | Patron Partners Advisors, Llc | 0 | -100.00 | 0 | |||||
| 2025-08-06 | 13F | Mcrae Capital Management Inc | 3,239 | 305 | ||||||
| 2025-07-15 | 13F | Elevated Capital Advisors, LLC | 12,080 | 0.00 | 1,021 | 0.00 | ||||
| 2025-07-24 | 13F | Morton Brown Family Wealth, LLC | 106 | 0.00 | 10 | 12.50 | ||||
| 2025-08-13 | 13F | Congress Wealth Management LLC / DE / | 3,310 | -73.41 | 312 | -70.44 | ||||
| 2025-08-06 | 13F | Valued Wealth Advisors LLC | 50 | 0.00 | 5 | 0.00 | ||||
| 2025-08-13 | 13F | Russell Investments Group, Ltd. | 129 | -43.67 | 12 | -36.84 | ||||
| 2025-07-14 | 13F | GAMMA Investing LLC | 128 | 0.00 | 12 | 20.00 | ||||
| 2025-05-06 | 13F | Advisors Preferred, LLC | 0 | -100.00 | 0 | |||||
| 2025-07-30 | 13F | VCI Wealth Management LLC | 7,876 | 6.69 | 741 | 18.78 | ||||
| 2025-08-01 | 13F | Purkiss Capital Advisors LLC | 6,377 | -9.19 | 600 | 1.01 | ||||
| 2025-08-12 | 13F | Global Retirement Partners, LLC | 1,582 | -7.00 | 149 | -10.30 | ||||
| 2025-07-07 | 13F | Versant Capital Management, Inc | 352 | 0.00 | 33 | 13.79 | ||||
| 2025-08-12 | 13F | Eley Financial Management, Inc | 4,503 | -5.06 | 424 | 4.44 | ||||
| 2025-07-21 | 13F | Exchange Capital Management, Inc. | 28,357 | -2.48 | 2,668 | 8.55 | ||||
| 2025-07-17 | 13F | Sound Income Strategies, LLC | 153 | 0.00 | 14 | 16.67 | ||||
| 2025-07-22 | 13F | Valley National Advisers Inc | 20 | 0.00 | 0 | |||||
| 2025-08-07 | 13F | PFG Advisors | 665,707 | 22,112.45 | 47,085 | 18,510.67 | ||||
| 2025-08-14 | 13F | Cubist Systematic Strategies, LLC | 0 | -100.00 | 0 | |||||
| 2025-08-14 | 13F | Royal Bank Of Canada | 24,237 | -80.76 | 2,280 | -78.59 | ||||
| 2025-08-12 | 13F | Coston, McIsaac & Partners | 229 | 0.44 | 0 | |||||
| 2025-07-21 | 13F | Barrett & Company, Inc. | 211 | 0.00 | 20 | 11.76 | ||||
| 2025-08-14 | 13F | Ameriprise Financial Inc | 71,296 | 69.68 | 6,707 | 88.85 | ||||
| 2025-05-16 | 13F/A | Kestra Investment Management, LLC | 0 | -100.00 | 0 | |||||
| 2025-07-16 | 13F | Beaumont Financial Advisors, LLC | 18,996 | 1,787 | ||||||
| 2025-08-11 | 13F | Tidemark, LLC | 168 | 0.00 | 16 | 7.14 | ||||
| 2025-05-06 | 13F | Venturi Wealth Management, LLC | 0 | -100.00 | 0 | |||||
| 2025-05-09 | 13F | Belvedere Trading LLC | Call | 0 | -100.00 | 0 | ||||
| 2025-08-08 | 13F | Smithfield Trust Co | 3,931 | 9.62 | 0 | |||||
| 2025-07-25 | 13F | Cwm, Llc | 30 | -97.82 | 0 | |||||
| 2025-07-28 | 13F | Interchange Capital Partners, LLC | 160 | -94.88 | 287 | 8.71 | ||||
| 2025-08-06 | 13F | Maltin Wealth Management, Inc. | 34,141 | 2.89 | 3,212 | 14.51 | ||||
| 2025-04-28 | 13F | UMA Financial Services, Inc. | 0 | -100.00 | 0 | |||||
| 2025-04-30 | 13F | Stratos Wealth Partners, LTD. | 0 | -100.00 | 0 | |||||
| 2025-07-17 | 13F | Centennial Wealth Advisory LLC | 4,664 | -1.62 | 440 | 10.00 | ||||
| 2025-08-12 | 13F | LPL Financial LLC | 113,979 | 0.04 | 10,722 | 11.36 | ||||
| 2025-08-14 | 13F | Syon Capital Llc | 5,975 | 562 | ||||||
| 2025-08-06 | 13F | Commonwealth Equity Services, Llc | 119,589 | 3.30 | 11 | 22.22 | ||||
| 2025-08-13 | 13F | Northern Trust Corp | 2,709 | 0.00 | 255 | 11.40 | ||||
| 2025-08-15 | 13F | Tower Research Capital LLC (TRC) | 0 | -100.00 | 0 | |||||
| 2025-08-01 | 13F | Rossby Financial, LCC | 93 | 0.00 | 9 | 14.29 | ||||
| 2025-08-11 | 13F | Citigroup Inc | 28,847 | 61.45 | 2,714 | 79.79 | ||||
| 2025-08-13 | 13F | Flow Traders U.s. Llc | 0 | -100.00 | 0 |