Mga Batayang Estadistika
| Pemilik Institusional | 214 total, 210 long only, 2 short only, 2 long/short - change of -2.26% MRQ |
| Alokasi Portofolio Rata-rata | 0.2286 % - change of -31.87% MRQ |
| Saham Institusional (Jangka Panjang) | 6,689,339 (ex 13D/G) - change of -1.62MM shares -19.49% MRQ |
| Nilai Institusional (Jangka Panjang) | $ 615,343 USD ($1000) |
Kepemilikan Institusional dan Pemegang Saham
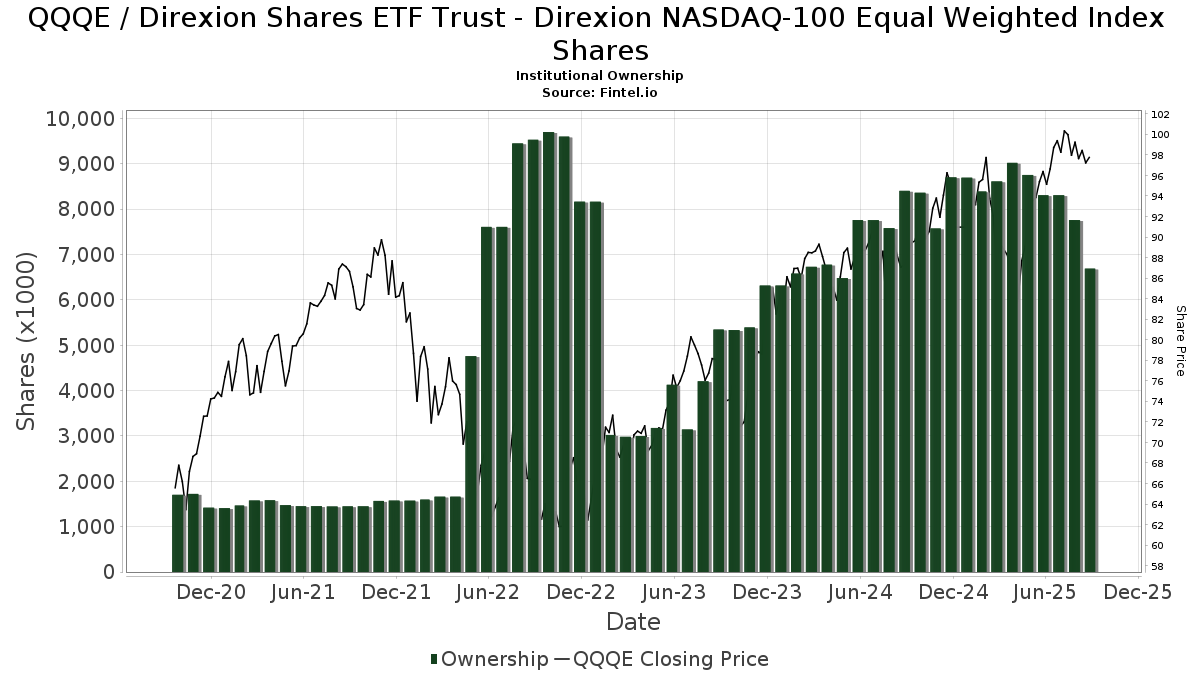
Direxion Shares ETF Trust - Direxion NASDAQ-100 Equal Weighted Index Shares (US:QQQE) memiliki 214 pemilik institusional dan pemegang saham yang telah mengajukan formulir 13D/G atau 13F kepada Komisi Bursa Efek (Securities Exchange Commission/SEC). Lembaga-lembaga ini memegang total 7,004,539 saham. Pemegang saham terbesar meliputi Goldman Sachs Group Inc, Bank Of America Corp /de/, Ameriprise Financial Inc, Morgan Stanley, Waddell & Associates, Llc, Endurance Services Ltd, LPL Financial LLC, Frisch Financial Group, Inc., Bnp Paribas Arbitrage, Sa, and UBS Group AG .
Struktur kepemilikan institusional Direxion Shares ETF Trust - Direxion NASDAQ-100 Equal Weighted Index Shares (NasdaqGM:QQQE) menunjukkan posisi terkini di perusahaan oleh institusi dan dana, serta perubahan terbaru dalam ukuran posisi. Pemegang saham utama dapat mencakup investor individu, reksa dana, dana lindung nilai, atau institusi. Jadwal 13D menunjukkan bahwa investor memegang (atau pernah memegang) lebih dari 5% saham perusahaan dan bermaksud (atau pernah bermaksud) untuk secara aktif mengejar perubahan strategi bisnis. Jadwal 13G menunjukkan investasi pasif lebih dari 5%.
The share price as of September 5, 2025 is 97.94 / share. Previously, on September 6, 2024, the share price was 85.18 / share. This represents an increase of 14.98% over that period.
Skor Sentimen Dana
Skor Sentimen Dana (sebelumnya dikenal sebagai Skor Akumulasi Kepemilikan) menemukan saham-saham yang paling banyak dibeli oleh dana. Ini adalah hasil dari model kuantitatif multi-faktor yang canggih yang mengidentifikasi perusahaan dengan tingkat akumulasi institusional tertinggi. Model penilaian menggunakan kombinasi dari total peningkatan pemilik yang diungkapkan, perubahan dalam alokasi portofolio pada pemilik tersebut, dan metrik lainnya. Angka berkisar dari 0 hingga 100, dengan angka yang lebih tinggi menunjukkan tingkat akumulasi yang lebih tinggi dibandingkan dengan perusahaan sejenisnya, dan 50 adalah rata-ratanya.
Frekuensi Pembaruan: Setiap Hari
Lihat Ownership Explorer, yang menyediakan daftar perusahaan dengan peringkat tertinggi.
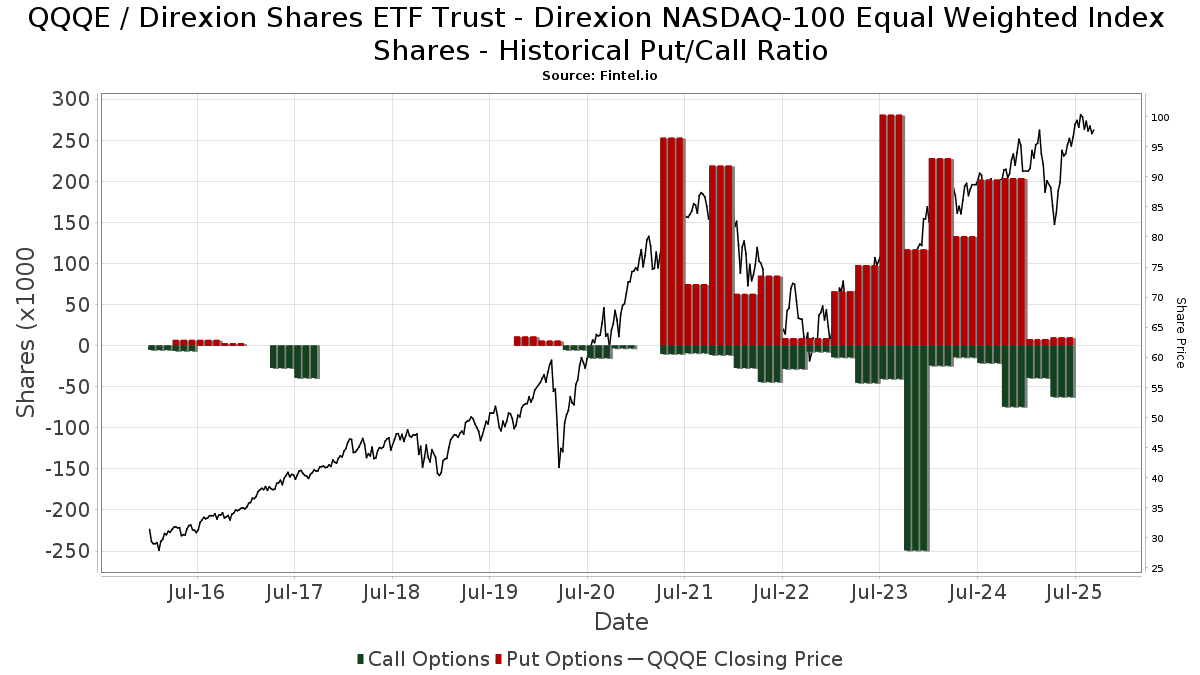
Rasio Put/Call Institusional
Selain melaporkan isu ekuitas dan utang standar, institusi dengan aset di bawah manajemen lebih dari 100 juta dolar AS juga harus mengungkapkan kepemilikan opsi put dan call mereka. Karena opsi put umumnya menunjukkan sentimen negatif, dan opsi call menunjukkan sentimen positif, kita dapat mengetahui sentimen institusional secara keseluruhan dengan memplot rasio put terhadap call. Grafik di sebelah kanan memplot rasio put/call historis untuk instrumen ini.
Menggunakan Rasio Put/Call sebagai indikator sentimen investor mengatasi salah satu kekurangan utama dari penggunaan total kepemilikan institusional, yaitu sejumlah besar aset yang dikelola diinvestasikan secara pasif untuk melacak indeks. Dana yang dikelola secara pasif biasanya tidak membeli opsi, sehingga indikator rasio put/call lebih akurat dalam melacak sentimen dana yang dikelola secara aktif.
Pengajuan 13F dan NPORT
Detail pada pengajuan 13F tersedia gratis. Detail pada pengajuan NP memerlukan keanggotaan premium. Baris berwarna hijau menunjukkan posisi baru. Baris berwarna merah menunjukkan posisi yang sudah ditutup. Klik tautan ini ikon untuk melihat riwayat transaksi selengkapnya.
Tingkatkan
untuk membuka data premium dan mengekspor ke Excel ![]() .
.
| Tanggal File | Sumber | Investor | Ketik | Presyo ng Avg (Silangan) |
Saham | Δ Saham (%) |
Dilaporkan Nilai ($1000) |
Nilai Δ (%) |
Alokasi Port (%) |
|
|---|---|---|---|---|---|---|---|---|---|---|
| 2025-07-22 | 13F | Old National Bancorp /in/ | 3,460 | 1.76 | 340 | 14.86 | ||||
| 2025-05-02 | 13F | Transcendent Capital Group LLC | 0 | -100.00 | 0 | |||||
| 2025-08-12 | 13F | Retirement Planning Co of New England, Inc. | 8,367 | 3.07 | 823 | 16.27 | ||||
| 2025-08-18 | 13F/A | National Bank Of Canada /fi/ | 1,334 | -21.67 | 131 | -12.16 | ||||
| 2025-05-15 | 13F | Vermillion & White Wealth Management Group, LLC | 0 | -100.00 | 0 | |||||
| 2025-07-02 | 13F | Howard Financial Services, Ltd. | 3,553 | 18.24 | 349 | 33.72 | ||||
| 2025-08-13 | 13F | Victory Financial Group, Llc | 2,609 | 4.57 | 256 | 17.97 | ||||
| 2025-08-19 | 13F | Advisory Services Network, LLC | 6,459 | -29.79 | 635 | -20.82 | ||||
| 2025-08-13 | 13F | Virtue Capital Management, LLC | 0 | -100.00 | 0 | |||||
| 2025-07-14 | 13F | Sowell Financial Services LLC | 7,801 | -6.61 | 767 | 5.22 | ||||
| 2025-08-12 | 13F | Proequities, Inc. | 0 | 0 | ||||||
| 2025-08-12 | 13F | Jefferies Financial Group Inc. | 2,330 | 229 | ||||||
| 2025-05-05 | 13F | Private Advisor Group, LLC | 0 | -100.00 | 0 | |||||
| 2025-07-28 | 13F | Mutual Advisors, LLC | 10,888 | 6.18 | 1,093 | 22.70 | ||||
| 2025-07-17 | 13F | Beacon Capital Management, LLC | 660 | -5.04 | 65 | 6.67 | ||||
| 2025-08-14 | 13F | Jane Street Group, Llc | Call | 13,500 | 1,327 | |||||
| 2025-08-13 | 13F | Jones Financial Companies Lllp | 42,836 | 8.87 | 4,177 | 21.75 | ||||
| 2025-08-05 | 13F | Bank of New York Mellon Corp | 5,696 | -25.64 | 560 | -16.19 | ||||
| 2025-08-08 | 13F | Hudock, Inc. | 2,199 | 216 | ||||||
| 2025-08-05 | 13F | Cherry Tree Wealth Management, LLC | 0 | -100.00 | 0 | |||||
| 2025-08-12 | 13F | CIBC Private Wealth Group, LLC | 250 | 0.00 | 25 | 26.32 | ||||
| 2025-07-24 | 13F | Stonebridge Financial Group, LLC | 0 | -100.00 | 0 | |||||
| 2025-08-04 | 13F | Arkadios Wealth Advisors | 4,007 | 394 | ||||||
| 2025-08-14 | 13F | Goldman Sachs Group Inc | 900,000 | 80.00 | 88,479 | 102.96 | ||||
| 2025-07-25 | 13F | Atria Wealth Solutions, Inc. | 0 | -100.00 | 0 | |||||
| 2025-07-29 | 13F | Harbor Asset Planning, Inc. | 629 | 62 | ||||||
| 2025-07-11 | 13F | Farther Finance Advisors, LLC | 56 | 6 | ||||||
| 2025-04-01 | 13F | Modus Advisors, LLC | 0 | -100.00 | 0 | -100.00 | ||||
| 2025-07-10 | 13F | Marshall Financial Group LLC | 11,866 | -9.69 | 1,171 | 2.18 | ||||
| 2025-08-11 | 13F | Cannon Advisors, Inc. | 25,487 | 7.65 | 2,506 | 21.37 | ||||
| 2025-05-15 | 13F | Hbk Investments L P | Put | 0 | -100.00 | 0 | ||||
| 2025-08-13 | 13F | Healthcare Of Ontario Pension Plan Trust Fund | 43,000 | 0.00 | 4,227 | 12.75 | ||||
| 2025-07-08 | 13F | Nbc Securities, Inc. | 87 | 0.00 | 0 | |||||
| 2025-08-11 | 13F | Citigroup Inc | 50,675 | -0.01 | 4,982 | 12.74 | ||||
| 2025-07-22 | 13F | Wealthcare Advisory Partners LLC | 2,251 | 221 | ||||||
| 2025-08-05 | 13F | Welch & Forbes Llc | 0 | -100.00 | 0 | |||||
| 2025-08-05 | 13F | Key FInancial Inc | 4,649 | 0.00 | 457 | 12.84 | ||||
| 2025-07-10 | 13F | Kmg Fiduciary Partners, Llc | 6,205 | -72.27 | 610 | -68.72 | ||||
| 2025-07-31 | 13F | Optimum Investment Advisors | 25 | 0.00 | 2 | 0.00 | ||||
| 2025-08-18 | 13F | Hollencrest Capital Management | 983 | 0.00 | 97 | 12.94 | ||||
| 2025-08-11 | 13F | Regal Investment Advisors LLC | 20,712 | 0.30 | 2,036 | 13.11 | ||||
| 2025-08-13 | 13F | Cerity Partners LLC | 3,601 | 0.00 | 354 | 13.10 | ||||
| 2025-07-14 | 13F | AdvisorNet Financial, Inc | 724 | 0.00 | 71 | 12.70 | ||||
| 2025-07-24 | 13F | Galvin, Gaustad & Stein, LLC | 2,295 | 0.00 | 226 | 12.50 | ||||
| 2025-07-30 | 13F | D.a. Davidson & Co. | 8,083 | -64.96 | 795 | -60.52 | ||||
| 2025-08-13 | 13F | Wambolt & Associates, LLC | 22,471 | -1.86 | 2,210 | 10.17 | ||||
| 2025-07-22 | 13F | Berkshire Money Management, Inc. | 56,591 | -27.86 | 5,563 | -18.66 | ||||
| 2025-07-30 | 13F | FNY Investment Advisers, LLC | 220 | 0.00 | 0 | |||||
| 2025-08-07 | 13F | Runnymede Capital Advisors, Inc. | 0 | -100.00 | 0 | |||||
| 2025-07-10 | 13F | Focus Financial Network, Inc. | 5,847 | -10.31 | 576 | 1.23 | ||||
| 2025-08-08 | 13F | Thoroughbred Financial Services, Llc | 2,391 | -16.28 | 0 | |||||
| 2025-07-22 | 13F | SOL Capital Management CO | 43,101 | -15.48 | 4 | 0.00 | ||||
| 2025-08-01 | 13F | Envestnet Asset Management Inc | 46,294 | -57.30 | 4,551 | -51.85 | ||||
| 2025-07-30 | 13F | LifeWealth Investments, LLC | 16,246 | 25.34 | 1,597 | 41.33 | ||||
| 2025-08-14 | 13F | Jane Street Group, Llc | 27,473 | 185.70 | 2,701 | 222.20 | ||||
| 2025-08-29 | 13F | Total Investment Management Inc | 4,995 | -99.30 | 491 | -99.22 | ||||
| 2025-08-19 | 13F | Cape Investment Advisory, Inc. | 106 | 0.00 | 10 | 11.11 | ||||
| 2025-08-14 | 13F | Ancora Advisors, LLC | 469 | 0.00 | 46 | 15.00 | ||||
| 2025-08-05 | 13F | Sigma Planning Corp | 2,322 | -33.08 | 228 | -24.50 | ||||
| 2025-07-07 | 13F | Nova Wealth Management, Inc. | 160 | 0.00 | 16 | 15.38 | ||||
| 2025-08-11 | 13F | Pineridge Advisors LLC | 29 | 0.00 | 3 | 0.00 | ||||
| 2025-08-14 | 13F | Bnp Paribas Arbitrage, Sa | 201,400 | 98.62 | 19,800 | 123.95 | ||||
| 2025-08-04 | 13F | Spire Wealth Management | 536 | -39.16 | 53 | -31.58 | ||||
| 2025-08-14 | 13F | Helium Advisors LLC | 4,162 | 0.07 | 409 | 12.98 | ||||
| 2025-08-15 | 13F/A | Florida Financial Advisors, Llc | 3,570 | -5.08 | 351 | 7.03 | ||||
| 2025-07-31 | 13F | CAP Partners, LLC | 13,214 | -59.18 | 1,299 | -53.97 | ||||
| 2025-08-13 | 13F | Quadrant Capital Group Llc | 0 | -100.00 | 0 | |||||
| 2025-07-29 | 13F | International Assets Investment Management, Llc | 2,585 | 0.00 | 254 | 12.89 | ||||
| 2025-04-30 | 13F | Weil Company, Inc. | 0 | -100.00 | 0 | |||||
| 2025-07-18 | 13F | Truist Financial Corp | 47,021 | 16.82 | 4,623 | 31.72 | ||||
| 2025-07-21 | 13F | Tilia Fiduciary Partners, Inc. | 4,314 | -0.58 | 424 | 12.17 | ||||
| 2025-08-08 | 13F | Kingsview Wealth Management, LLC | 2,532 | 249 | ||||||
| 2025-07-29 | 13F | Activest Wealth Management | 0 | 0 | ||||||
| 2025-08-13 | 13F | Avestar Capital, LLC | 88,163 | 21.51 | 8,675 | 37.12 | ||||
| 2025-08-15 | 13F | First Heartland Consultants, Inc. | 2,807 | -14.00 | 276 | -3.17 | ||||
| 2025-07-24 | 13F | Aurora Private Wealth, Inc. | 2,309 | -18.55 | 0 | |||||
| 2025-07-17 | 13F | White Pine Investment CO | 33,658 | -0.05 | 3 | 50.00 | ||||
| 2025-08-08 | 13F | Gts Securities Llc | 4,668 | 459 | ||||||
| 2025-08-11 | 13F | Hexagon Capital Partners LLC | 0 | -100.00 | 0 | |||||
| 2025-08-14 | 13F | Ameriprise Financial Inc | 631,319 | 0.92 | 62,072 | 13.81 | ||||
| 2025-07-23 | 13F | Clear Creek Financial Management, LLC | 3,134 | -24.50 | 308 | -14.68 | ||||
| 2025-08-14 | 13F | Bank Of America Corp /de/ | 655,343 | -34.05 | 64,427 | -25.64 | ||||
| 2025-05-16 | 13F/A | Kestra Investment Management, LLC | 0 | -100.00 | 0 | |||||
| 2025-08-13 | 13F | B&D White Capital Company, LLC | 22,771 | -90.22 | 2,237 | -88.98 | ||||
| 2025-08-14 | 13F | Integrated Wealth Concepts LLC | 3,751 | 0.00 | 369 | 12.54 | ||||
| 2025-05-14 | 13F | Huntington National Bank | 10 | 800.00 | ||||||
| 2025-07-23 | 13F | Prime Capital Investment Advisors, LLC | 0 | -100.00 | 0 | |||||
| 2025-08-12 | 13F | Calton & Associates, Inc. | 2,278 | 224 | ||||||
| 2025-04-15 | 13F | GPS Wealth Strategies Group, LLC | 0 | -100.00 | 0 | -100.00 | ||||
| 2025-07-24 | 13F | Eastern Bank | 253 | -4.53 | 25 | 4.35 | ||||
| 2025-05-13 | 13F | Equitable Holdings, Inc. | 0 | -100.00 | 0 | |||||
| 2025-07-23 | 13F | Sax Wealth Advisors, Llc | 6,854 | -3.38 | 674 | 8.90 | ||||
| 2025-08-13 | 13F | Northwestern Mutual Wealth Management Co | 52,349 | 25.65 | 5,146 | 41.69 | ||||
| 2025-08-14 | 13F | Wells Fargo & Company/mn | 274 | -99.82 | 27 | -99.80 | ||||
| 2025-08-27 | 13F/A | Brinker Capital Investments, LLC | 3,806 | -4.78 | 374 | 7.47 | ||||
| 2025-07-23 | 13F | Element Wealth, LLC | 3,966 | 0.00 | 390 | 12.75 | ||||
| 2025-08-12 | 13F | Jpmorgan Chase & Co | 150 | -1.32 | 15 | 7.69 | ||||
| 2025-08-11 | 13F | Promethium Advisors,llc | 3,807 | -72.54 | 375 | -69.07 | ||||
| 2025-08-13 | 13F | Beacon Pointe Advisors, LLC | 29,959 | 37.06 | 2,945 | 54.59 | ||||
| 2025-07-09 | 13F | Dynamic Advisor Solutions LLC | 0 | -100.00 | 0 | |||||
| 2025-08-08 | 13F | Avantax Advisory Services, Inc. | 11,153 | 0.90 | 1,096 | 13.81 | ||||
| 2025-08-11 | 13F/A | Purus Wealth Management, LLC | 2,918 | -12.63 | 287 | -1.72 | ||||
| 2025-05-28 | NP | TFAGX - TFA AlphaGen Growth Fund Class I | 14,400 | 1,256 | ||||||
| 2025-08-12 | 13F | LPL Financial LLC | 328,793 | 3.67 | 32,324 | 16.89 | ||||
| 2025-08-11 | 13F | Western Wealth Management, LLC | 4,649 | 12.05 | 457 | 26.59 | ||||
| 2025-07-14 | 13F | Signature Securities Group Corporation | 13,082 | 1.47 | 1,288 | 14.50 | ||||
| 2025-08-04 | 13F | Kovack Advisors, Inc. | 0 | -100.00 | 0 | |||||
| 2025-08-11 | 13F | HighTower Advisors, LLC | 84,904 | 2.75 | 8,347 | 15.85 | ||||
| 2025-07-15 | 13F | Armis Advisers, LLC | 3,070 | 0.00 | 302 | 12.27 | ||||
| 2025-08-14 | 13F | Mariner, LLC | 10,435 | 7.36 | 1,026 | 21.02 | ||||
| 2025-08-08 | 13F | TD Capital Management LLC | 340 | 0.00 | 33 | 13.79 | ||||
| 2025-08-12 | 13F | BlackRock, Inc. | 327 | 81.67 | 32 | 113.33 | ||||
| 2025-08-12 | 13F | Mmbg Investment Advisors Co. | 2,280 | 224 | ||||||
| 2025-08-13 | 13F | Renaissance Technologies Llc | 4,376 | 430 | ||||||
| 2025-08-13 | 13F | Dana Investment Advisors, Inc. | 2,879 | -41.27 | 283 | -33.72 | ||||
| 2025-04-09 | 13F | RFG Advisory, LLC | 0 | -100.00 | 0 | |||||
| 2025-08-04 | 13F | Migdal Insurance & Financial Holdings Ltd. | 8,174 | -9.06 | 1 | |||||
| 2025-08-14 | 13F | Qube Research & Technologies Ltd | 34 | 3 | ||||||
| 2025-08-13 | 13F | Legacy Capital Wealth Partners, LLC | 0 | -100.00 | 0 | |||||
| 2025-08-12 | 13F | Archer Investment Corp | 32 | 0.00 | 3 | 50.00 | ||||
| 2025-05-09 | 13F | Headlands Technologies LLC | 0 | -100.00 | 0 | |||||
| 2025-04-28 | 13F | Strategic Financial Concepts, LLC | 0 | -100.00 | 0 | -100.00 | ||||
| 2025-08-19 | 13F | Anchor Investment Management, LLC | 3 | 0.00 | 0 | |||||
| 2025-08-05 | 13F | Harel Insurance Investments & Financial Services Ltd. | 55 | -81.97 | 0 | |||||
| 2025-05-15 | 13F | Polar Asset Management Partners Inc. | 0 | -100.00 | 0 | -100.00 | ||||
| 2025-07-15 | 13F | Carr Financial Group Corp | 18,518 | -11.05 | 1,821 | 0.28 | ||||
| 2025-07-22 | 13F | Merit Financial Group, LLC | 2,301 | -17.38 | 226 | -6.61 | ||||
| 2025-07-08 | 13F | Parallel Advisors, LLC | 5,126 | 0.00 | 504 | 12.78 | ||||
| 2025-07-21 | 13F | Warner Financial, Inc | 15,534 | 0.02 | 2 | 0.00 | ||||
| 2025-07-22 | 13F | DAVENPORT & Co LLC | 11,146 | -27.15 | 1,096 | -17.85 | ||||
| 2025-08-06 | 13F | First Horizon Advisors, Inc. | 166 | 0.00 | 16 | 14.29 | ||||
| 2025-08-05 | 13F | Bank Of Montreal /can/ | 1,821 | 0.00 | 179 | 13.29 | ||||
| 2025-05-15 | 13F/A | Orion Portfolio Solutions, LLC | 3,997 | -2.65 | 349 | -5.43 | ||||
| 2025-06-10 | 13F | Birchbrook, Inc. | 0 | -100.00 | 0 | |||||
| 2025-08-14 | 13F | Mml Investors Services, Llc | 3,314 | -6.52 | 0 | |||||
| 2025-08-08 | 13F | Kaizen Financial Strategies | 2,467 | -0.32 | 243 | 12.56 | ||||
| 2025-08-15 | 13F | Kestra Advisory Services, LLC | 21,396 | 13.02 | 2,103 | 27.45 | ||||
| 2025-08-15 | 13F | Morgan Stanley | 494,258 | 9.16 | 48,591 | 23.08 | ||||
| 2025-08-18 | 13F | Front Row Advisors LLC | 246 | -40.00 | 24 | -31.43 | ||||
| 2025-08-12 | 13F | Global Retirement Partners, LLC | 2,609 | 52.66 | 257 | 67.32 | ||||
| 2025-08-14 | 13F/A | Rockefeller Capital Management L.P. | 12,858 | -0.35 | 1,264 | 12.36 | ||||
| 2025-08-06 | 13F | Commonwealth Equity Services, Llc | 56,459 | -0.48 | 6 | 25.00 | ||||
| 2025-08-13 | 13F | Colonial Trust Co / SC | 3,181 | 0.00 | 313 | 12.64 | ||||
| 2025-07-02 | 13F | Capital Market Strategies LLC | 6,423 | -1.15 | 631 | 11.48 | ||||
| 2025-07-31 | 13F | Buckingham Strategic Partners | 2,361 | 0.08 | 232 | 13.17 | ||||
| 2025-08-13 | 13F/A | StoneX Group Inc. | 0 | -100.00 | 0 | -100.00 | ||||
| 2025-08-13 | 13F | Quadrature Capital Ltd | 2,872 | 6.02 | 282 | 20.00 | ||||
| 2025-07-17 | 13F | Gleason Group, Inc. | 306 | 0.00 | 30 | 15.38 | ||||
| 2025-04-14 | 13F | BCS Wealth Management | 0 | -100.00 | 0 | |||||
| 2025-08-14 | 13F | Jane Street Group, Llc | Put | 0 | -100.00 | 0 | ||||
| 2025-08-04 | 13F | Amplius Wealth Advisors, LLC | 3,630 | 0.64 | 357 | 13.38 | ||||
| 2025-08-07 | 13F | Curtis Advisory Group, LLC | 0 | -100.00 | 0 | |||||
| 2025-08-12 | 13F | Gladstone Institutional Advisory LLC | 4,422 | 0.00 | 435 | 12.73 | ||||
| 2025-08-14 | 13F | GWM Advisors LLC | 239 | 25.13 | 24 | 43.75 | ||||
| 2025-07-10 | 13F | Wealth Enhancement Advisory Services, Llc | 2,826 | -32.87 | 281 | -23.43 | ||||
| 2025-07-24 | 13F | Ronald Blue Trust, Inc. | 59 | 0.00 | 6 | 0.00 | ||||
| 2025-08-13 | 13F | Baird Financial Group, Inc. | 2,140 | -53.12 | 210 | -47.24 | ||||
| 2025-07-11 | 13F | Seacrest Wealth Management, Llc | 6,676 | -0.83 | 656 | 11.95 | ||||
| 2025-08-11 | 13F | Shoker Investment Counsel, Inc. | 17,212 | -10.12 | 1,692 | 1.38 | ||||
| 2025-08-18 | 13F | Wolverine Trading, Llc | 22,797 | 162.55 | 2,223 | 193.53 | ||||
| 2025-07-09 | 13F | Presidio Capital Management, LLC | 2,829 | -4.68 | 278 | 7.75 | ||||
| 2025-07-17 | 13F | Raleigh Capital Management Inc. | 0 | -100.00 | 0 | |||||
| 2025-05-14 | 13F | Smartleaf Asset Management LLC | 0 | -100.00 | 0 | |||||
| 2025-08-12 | 13F | Ameritas Investment Partners, Inc. | 10,633 | 11.71 | 1,045 | 26.06 | ||||
| 2025-08-12 | 13F | Change Path, LLC | 14,742 | 203.27 | 1,449 | 242.55 | ||||
| 2025-07-08 | 13F | Morris Retirement Advisors, LLC | 120,418 | 21.23 | 11,838 | 36.70 | ||||
| 2025-08-11 | 13F | Principal Securities, Inc. | 136 | -18.07 | 13 | -7.14 | ||||
| 2025-08-04 | 13F | Atria Investments Llc | 0 | -100.00 | 0 | |||||
| 2025-08-11 | 13F | Cascade Wealth Advisors, Inc | 2,555 | -20.28 | 249 | -7.09 | ||||
| 2025-06-26 | NP | SPECX - Alger Spectra Fund Class A | Short | -226,281 | -0.00 | -19,843 | -6.89 | |||
| 2025-07-23 | 13F | Sachetta, LLC | 115 | 0.00 | 11 | 10.00 | ||||
| 2025-07-22 | 13F | Diligent Investors, LLC | 0 | -100.00 | 0 | |||||
| 2025-08-14 | 13F | Warren Averett Asset Management, LLC | 11,756 | -1.01 | 1,156 | 11.59 | ||||
| 2025-07-15 | 13F | LeConte Wealth Management, LLC | 95,828 | -17.78 | 9,421 | -7.30 | ||||
| 2025-07-25 | 13F | Envestnet Portfolio Solutions, Inc. | 0 | -100.00 | 0 | |||||
| 2025-08-14 | 13F | Royal Bank Of Canada | 107,896 | -65.22 | 10,607 | -60.79 | ||||
| 2025-08-14 | 13F | Comerica Bank | 13,884 | 2.87 | 1,365 | 15.99 | ||||
| 2025-08-14 | 13F | Evergreen Capital Management Llc | 3,542 | 0.00 | 349 | 12.62 | ||||
| 2025-05-01 | 13F | Steel Peak Wealth Management LLC | 0 | -100.00 | 0 | |||||
| 2025-08-14 | 13F | Cascades Capital Asset Management, LLC | 4,794 | 471 | ||||||
| 2025-08-13 | 13F | First Trust Advisors Lp | 4,197 | 413 | ||||||
| 2025-05-12 | 13F | Meitav Dash Investments Ltd | 0 | -100.00 | 0 | |||||
| 2025-08-06 | 13F | North Capital, Inc. | 50 | 0.00 | 5 | 0.00 | ||||
| 2025-08-14 | 13F | Raymond James Financial Inc | 31,196 | -0.25 | 3,067 | 12.47 | ||||
| 2025-07-15 | 13F | Oxinas Partners Wealth Management LLC | 7,729 | -8.65 | 760 | 2.99 | ||||
| 2025-07-30 | 13F | Crewe Advisors LLC | 1,380 | 0.00 | 136 | 12.50 | ||||
| 2025-07-21 | 13F | DHJJ Financial Advisors, Ltd. | 3,911 | 5.67 | 384 | 19.25 | ||||
| 2025-08-14 | 13F | Raymond James Financial Inc | Put | 200 | 19 | |||||
| 2025-07-14 | 13F | Abound Wealth Management | 92 | 0.00 | 9 | 12.50 | ||||
| 2025-08-12 | 13F | Tradition Wealth Management, LLC | 16,545 | -12.62 | 1,627 | -1.45 | ||||
| 2025-08-14 | 13F | STAR Financial Bank | 4,336 | 426 | ||||||
| 2025-08-14 | 13F | Riggs Asset Managment Co. Inc. | 36 | 0.00 | 4 | 0.00 | ||||
| 2025-07-10 | 13F | Fulton Bank, N.a. | 8,902 | 2.85 | 875 | 16.05 | ||||
| 2025-04-25 | 13F | New Wave Wealth Advisors Llc | 0 | -100.00 | 0 | |||||
| 2025-08-18 | 13F | Geneos Wealth Management Inc. | 429 | 0.00 | 42 | 13.51 | ||||
| 2025-07-08 | 13F | Prism Advisors, Inc. | 12,799 | 1,258 | ||||||
| 2025-08-12 | 13F | Mystic Asset Management, Inc. | 13,565 | 0.74 | 1,334 | 13.54 | ||||
| 2025-08-12 | 13F | Steward Partners Investment Advisory, Llc | 92 | 0.00 | 9 | 12.50 | ||||
| 2025-07-21 | 13F | Ameritas Advisory Services, LLC | 23,072 | 4.86 | 2,268 | 17.63 | ||||
| 2025-08-14 | 13F | Beaird Harris Wealth Management, LLC | 624 | 0.00 | 61 | 12.96 | ||||
| 2025-08-08 | 13F | MTM Investment Management, LLC | 6,060 | 8.16 | 596 | 21.18 | ||||
| 2025-08-11 | 13F | Blue Bell Private Wealth Management, Llc | 454 | 1.11 | 45 | 12.82 | ||||
| 2025-06-30 | NP | ASTIX - Astor Dynamic Allocation Fund Class I shares | 30,322 | 0.00 | 2,659 | -6.90 | ||||
| 2025-08-18 | 13F | Wolverine Trading, Llc | Call | 0 | -100.00 | 0 | -100.00 | |||
| 2025-08-14 | 13F | Susquehanna International Group, Llp | Put | 10,600 | 1,042 | |||||
| 2025-05-07 | 13F | Allen Investment Management LLC | 0 | -100.00 | 0 | -100.00 | ||||
| 2025-08-14 | 13F | Susquehanna International Group, Llp | 19,378 | -8.06 | 1,905 | 3.70 | ||||
| 2025-05-06 | 13F | Rothschild & Co Wealth Management UK Ltd | 0 | -100.00 | 0 | |||||
| 2025-08-14 | 13F | Susquehanna International Group, Llp | Call | 15,200 | 52.00 | 1,494 | 71.53 | |||
| 2025-08-06 | 13F | Paulson Wealth Management Inc. | 4,827 | -8.72 | 475 | 2.82 | ||||
| 2025-08-14 | 13F | Fmr Llc | 2,198 | -13.23 | 216 | -1.82 | ||||
| 2025-08-07 | 13F | Allworth Financial LP | 0 | 0 | ||||||
| 2025-08-14 | 13F | Beck Capital Management, Llc | 14,685 | -21.12 | 1,444 | -11.09 | ||||
| 2025-04-22 | 13F | RFP Financial Group LLC | 0 | -100.00 | 0 | |||||
| 2025-08-11 | 13F | TD Waterhouse Canada Inc. | 4,800 | 86.05 | 472 | 109.33 | ||||
| 2025-08-12 | 13F | Waddell & Associates, Llc | 395,063 | 2.13 | 38,839 | 15.15 | ||||
| 2025-08-05 | 13F | Simplex Trading, Llc | 256 | 0 | ||||||
| 2025-08-14 | 13F | IHT Wealth Management, LLC | 4,829 | 475 | ||||||
| 2025-08-08 | 13F | Cetera Investment Advisers | 27,739 | -4.10 | 2,727 | 8.13 | ||||
| 2025-08-08 | 13F | Calamos Advisors LLC | Call | 33,400 | 75.79 | 2,912 | 70.79 | |||
| 2025-08-14 | 13F | Capstone Investment Advisors, Llc | 9,045 | -47.43 | 889 | -40.73 | ||||
| 2025-05-13 | 13F | Heck Capital Advisors, LLC | 0 | -100.00 | 0 | -100.00 | ||||
| 2025-08-14 | 13F | Citadel Advisors Llc | Put | 0 | -100.00 | 0 | ||||
| 2025-08-14 | 13F | Citadel Advisors Llc | Call | 0 | -100.00 | 0 | ||||
| 2025-07-31 | 13F | LJI Wealth Management, LLC | 2,321 | 0.00 | 228 | 12.87 | ||||
| 2025-06-10 | 13F/A | Militia Capital Partners, LP | 0 | -100.00 | 0 | -100.00 | ||||
| 2025-08-14 | 13F | Private Capital Management, LLC | 9,966 | 6.32 | 980 | 19.83 | ||||
| 2025-07-28 | 13F | Triton Wealth Management, PLLC | 0 | -100.00 | 0 | |||||
| 2025-07-30 | 13F | St. Johns Investment Management Company, LLC | 30 | 0.00 | 3 | 0.00 | ||||
| 2025-05-12 | 13F | Waterloo Capital, L.P. | 0 | -100.00 | 0 | |||||
| 2025-07-31 | 13F | PKO Investment Management Joint-Stock Co | 100,000 | -76.19 | 9,831 | -73.15 | ||||
| 2025-07-29 | NP | EBI - Longview Advantage ETF | 0 | -100.00 | 0 | -100.00 | ||||
| 2025-07-17 | 13F | Janney Montgomery Scott LLC | 2,091 | 0 | ||||||
| 2025-08-14 | 13F | UBS Group AG | 190,843 | -10.16 | 18,762 | 1.30 | ||||
| 2025-07-22 | 13F | Hickory Asset Management, Inc. | 0 | -100.00 | 0 | |||||
| 2025-07-01 | 13F | Burkett Financial Services, Llc | 0 | -100.00 | 0 | |||||
| 2025-08-01 | 13F | Anson Capital, Inc. | 2,858 | 281 | ||||||
| 2025-07-25 | 13F | Astoria Portfolio Advisors LLC. | 2,692 | -1.97 | 269 | 16.96 | ||||
| 2025-08-14 | 13F | Citadel Advisors Llc | 0 | -100.00 | 0 | |||||
| 2025-07-17 | 13F | HB Wealth Management, LLC | 16,440 | 0.00 | 1,616 | 12.77 | ||||
| 2025-08-11 | 13F | Mill Creek Capital Advisors, LLC | 4,522 | 0.00 | 445 | 12.69 | ||||
| 2025-08-14 | 13F | Frisch Financial Group, Inc. | 225,817 | -6.12 | 22 | 10.00 | ||||
| 2025-08-07 | 13F | Parkside Financial Bank & Trust | 434 | 43 | ||||||
| 2025-08-14 | 13F | Stifel Financial Corp | 4,059 | -0.59 | 399 | 12.39 | ||||
| 2025-08-28 | NP | TFAFX - Tactical Growth Allocation Fund Class I | 430 | -86.56 | 42 | -84.95 | ||||
| 2025-08-06 | 13F | Kcm Investment Advisors Llc | 2,210 | 217 | ||||||
| 2025-07-23 | 13F | Traphagen Investment Advisors Llc | 4,515 | 2.80 | 444 | 15.97 | ||||
| 2025-08-13 | 13F | GeoWealth Management, LLC | 0 | -100.00 | 0 | |||||
| 2025-06-02 | 13F/A | Deutsche Bank Ag\ | 0 | -100.00 | 0 | |||||
| 2025-08-14 | 13F | D. E. Shaw & Co., Inc. | 6,483 | 0.00 | 637 | 12.74 | ||||
| 2025-08-08 | 13F | SBI Securities Co., Ltd. | 54 | -80.65 | 5 | -79.17 | ||||
| 2025-05-01 | 13F | Quest 10 Wealth Builders, Inc. | 224 | 0.00 | 20 | -5.00 | ||||
| 2025-07-24 | 13F | IFP Advisors, Inc | 2,227 | 7.69 | 219 | 21.11 | ||||
| 2025-07-28 | 13F | Axxcess Wealth Management, Llc | 0 | -100.00 | 0 | |||||
| 2025-08-05 | 13F | American Capital Advisory, LLC | 792 | 49.15 | 78 | 67.39 | ||||
| 2025-08-12 | 13F | Integrated Advisors Network LLC | 2,653 | -8.49 | 261 | 3.17 | ||||
| 2025-05-08 | 13F | Us Bancorp \de\ | 0 | -100.00 | 0 | |||||
| 2025-07-25 | 13F | Cwm, Llc | 13,349 | 138.55 | 1 | |||||
| 2025-05-29 | NP | TFAQX - TFA Quantitative Fund Class I | 13,500 | 3.05 | 1,177 | 1.29 | ||||
| 2025-07-25 | 13F | Total Clarity Wealth Management, Inc. | 2,037 | 200 | ||||||
| 2025-07-22 | 13F | BridgePort Financial Solutions, LLC | 2,255 | 222 | ||||||
| 2025-05-14 | 13F | Monterey Private Wealth, Inc. | 3,700 | -3.57 | 323 | -6.40 | ||||
| 2025-07-18 | 13F | QTR Family Wealth, LLC | 14,685 | -0.13 | 1,444 | 12.56 | ||||
| 2025-08-08 | 13F | Creative Planning | 43,504 | -12.07 | 4,277 | -0.86 | ||||
| 2025-07-17 | 13F | Global Trust Asset Management, LLC | 423 | 0.00 | 42 | 13.89 | ||||
| 2025-05-15 | 13F | Hilltop Holdings Inc. | 0 | -100.00 | 0 | |||||
| 2025-08-08 | 13F | IMA Wealth, Inc. | 63 | 0.00 | 6 | 20.00 | ||||
| 2025-08-11 | 13F | Nations Financial Group Inc, /ia/ /adv | 48,286 | -5.61 | 4,747 | 6.43 | ||||
| 2025-07-11 | 13F | Kaydan Wealth Management, Inc. | 2,397 | 0.00 | 236 | 12.98 | ||||
| 2025-06-26 | NP | KCEVX - Knights of Columbus Long/Short Equity Fund Investor Shares | Short | -88,919 | -7,797 | |||||
| 2025-07-14 | 13F | Legacy Capital Group California, Inc. | 0 | -100.00 | 0 | |||||
| 2025-07-07 | 13F | Investors Research Corp | 57 | 0.00 | 6 | 25.00 | ||||
| 2025-08-14 | 13F | Endurance Services Ltd | 347,500 | 0.00 | 34,163 | 12.75 | ||||
| 2025-08-15 | 13F | Tower Research Capital LLC (TRC) | 31,263 | 468.73 | 3,073 | 541.54 | ||||
| 2025-08-13 | 13F | Gateway Wealth Partners, LLC | 25,940 | -0.49 | 2,550 | 12.24 | ||||
| 2025-09-04 | 13F/A | Advisor Group Holdings, Inc. | 39,139 | 27.82 | 3,850 | 44.25 | ||||
| 2025-07-14 | 13F | Brady Martz Wealth Solutions, LLC | 2,361 | 0.04 | 232 | 13.17 | ||||
| 2025-08-18 | 13F | Goodman Advisory Group, LLC | 300 | -25.74 | 29 | -17.14 | ||||
| 2025-07-31 | 13F | Cambridge Investment Research Advisors, Inc. | 15,420 | 16.77 | 2 | 0.00 | ||||
| 2025-08-06 | 13F | AE Wealth Management LLC | 0 | -100.00 | 0 | |||||
| 2025-07-22 | 13F | DT Investment Partners, LLC | 1,051 | 0.00 | 103 | 13.19 | ||||
| 2025-07-18 | 13F | Astor Investment Management LLC | 0 | -100.00 | 0 |