Mga Batayang Estadistika
| Pemilik Institusional | 415 total, 413 long only, 1 short only, 1 long/short - change of 4.51% MRQ |
| Alokasi Portofolio Rata-rata | 0.7525 % - change of -5.67% MRQ |
| Saham Institusional (Jangka Panjang) | 137,523,568 (ex 13D/G) - change of -3.00MM shares -2.13% MRQ |
| Nilai Institusional (Jangka Panjang) | $ 3,332,952 USD ($1000) |
Kepemilikan Institusional dan Pemegang Saham
SPDR Series Trust - SPDR Bloomberg Short Term High Yield Bond ETF (US:SJNK) memiliki 415 pemilik institusional dan pemegang saham yang telah mengajukan formulir 13D/G atau 13F kepada Komisi Bursa Efek (Securities Exchange Commission/SEC). Lembaga-lembaga ini memegang total 137,523,568 saham. Pemegang saham terbesar meliputi Ameriprise Financial Inc, Grimes & Company, Inc., Wright Fund Managment, LLC, LPL Financial LLC, Wells Fargo & Company/mn, Northern Lights Fund Trust - Sierra Tactical Bond Fund Investor Class Shares, Neuberger Berman Group LLC, State of New Jersey Common Pension Fund D, Wealthfront Advisers Llc, and Empirical Financial Services, LLC d.b.a. Empirical Wealth Management .
Struktur kepemilikan institusional SPDR Series Trust - SPDR Bloomberg Short Term High Yield Bond ETF (ARCA:SJNK) menunjukkan posisi terkini di perusahaan oleh institusi dan dana, serta perubahan terbaru dalam ukuran posisi. Pemegang saham utama dapat mencakup investor individu, reksa dana, dana lindung nilai, atau institusi. Jadwal 13D menunjukkan bahwa investor memegang (atau pernah memegang) lebih dari 5% saham perusahaan dan bermaksud (atau pernah bermaksud) untuk secara aktif mengejar perubahan strategi bisnis. Jadwal 13G menunjukkan investasi pasif lebih dari 5%.
The share price as of September 5, 2025 is 25.50 / share. Previously, on September 6, 2024, the share price was 25.40 / share. This represents an increase of 0.39% over that period.

Skor Sentimen Dana
Skor Sentimen Dana (sebelumnya dikenal sebagai Skor Akumulasi Kepemilikan) menemukan saham-saham yang paling banyak dibeli oleh dana. Ini adalah hasil dari model kuantitatif multi-faktor yang canggih yang mengidentifikasi perusahaan dengan tingkat akumulasi institusional tertinggi. Model penilaian menggunakan kombinasi dari total peningkatan pemilik yang diungkapkan, perubahan dalam alokasi portofolio pada pemilik tersebut, dan metrik lainnya. Angka berkisar dari 0 hingga 100, dengan angka yang lebih tinggi menunjukkan tingkat akumulasi yang lebih tinggi dibandingkan dengan perusahaan sejenisnya, dan 50 adalah rata-ratanya.
Frekuensi Pembaruan: Setiap Hari
Lihat Ownership Explorer, yang menyediakan daftar perusahaan dengan peringkat tertinggi.
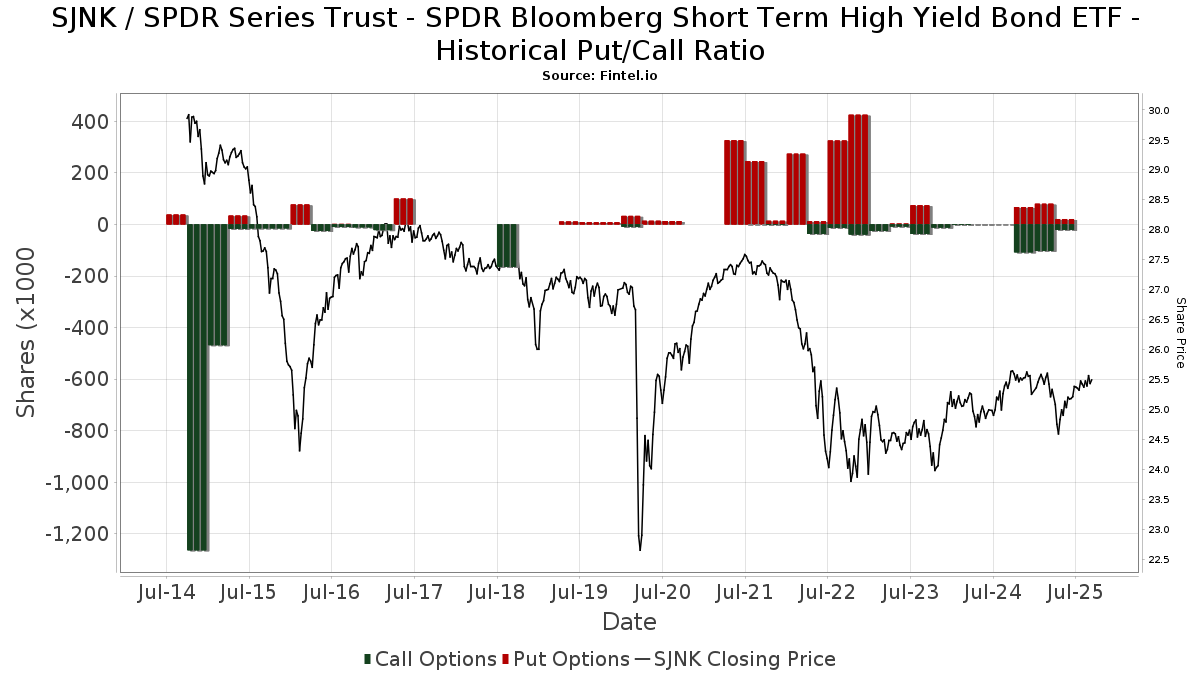
Rasio Put/Call Institusional
Selain melaporkan isu ekuitas dan utang standar, institusi dengan aset di bawah manajemen lebih dari 100 juta dolar AS juga harus mengungkapkan kepemilikan opsi put dan call mereka. Karena opsi put umumnya menunjukkan sentimen negatif, dan opsi call menunjukkan sentimen positif, kita dapat mengetahui sentimen institusional secara keseluruhan dengan memplot rasio put terhadap call. Grafik di sebelah kanan memplot rasio put/call historis untuk instrumen ini.
Menggunakan Rasio Put/Call sebagai indikator sentimen investor mengatasi salah satu kekurangan utama dari penggunaan total kepemilikan institusional, yaitu sejumlah besar aset yang dikelola diinvestasikan secara pasif untuk melacak indeks. Dana yang dikelola secara pasif biasanya tidak membeli opsi, sehingga indikator rasio put/call lebih akurat dalam melacak sentimen dana yang dikelola secara aktif.
Pengajuan 13F dan NPORT
Detail pada pengajuan 13F tersedia gratis. Detail pada pengajuan NP memerlukan keanggotaan premium. Baris berwarna hijau menunjukkan posisi baru. Baris berwarna merah menunjukkan posisi yang sudah ditutup. Klik tautan ini ikon untuk melihat riwayat transaksi selengkapnya.
Tingkatkan
untuk membuka data premium dan mengekspor ke Excel ![]() .
.
| Tanggal File | Sumber | Investor | Ketik | Presyo ng Avg (Silangan) |
Saham | Δ Saham (%) |
Dilaporkan Nilai ($1000) |
Nilai Δ (%) |
Alokasi Port (%) |
|
|---|---|---|---|---|---|---|---|---|---|---|
| 2025-06-25 | NP | SHIAX - Western Asset Short Duration High Income Fund Class A | 192,650 | 0.00 | 4,814 | -2.23 | ||||
| 2025-08-06 | 13F | Hallmark Capital Management Inc | 7,188 | -63.11 | 183 | -62.65 | ||||
| 2025-07-29 | 13F | Sigma Investment Counselors Inc | 1,544,552 | 1.33 | 39,355 | 2.62 | ||||
| 2025-08-11 | 13F | Synergy Investment Management, LLC | 0 | -100.00 | 0 | |||||
| 2025-07-03 | 13F | TrueWealth Advisors, LLC | 151,401 | -1.12 | 3,858 | 0.13 | ||||
| 2025-08-04 | 13F | Arkadios Wealth Advisors | 23,019 | 0.60 | 587 | 1.91 | ||||
| 2025-04-21 | 13F | Kingswood Wealth Advisors, Llc | 0 | -100.00 | 0 | |||||
| 2025-08-14 | 13F | Royal Bank Of Canada | 678,127 | 712.85 | 17,279 | 722.81 | ||||
| 2025-07-21 | 13F | Ameriflex Group, Inc. | 220 | -81.02 | 6 | -82.76 | ||||
| 2025-08-11 | 13F | CFS Investment Advisory Services, LLC | 27,714 | 4.21 | 1 | |||||
| 2025-08-06 | 13F | ZEGA Investments, LLC | 600,900 | -28.60 | 15,311 | -27.69 | ||||
| 2025-08-11 | 13F | Howard Wealth Management, Llc | 44,983 | 7.98 | 1,146 | 9.35 | ||||
| 2025-07-21 | 13F | Fortis Capital Advisors, LLC | 0 | -100.00 | 0 | |||||
| 2025-08-05 | 13F | Lifeworks Advisors, LLC | 12,806 | 29.93 | 326 | 31.98 | ||||
| 2025-07-29 | 13F | Private Trust Co Na | 1,582 | -94.36 | 40 | -94.33 | ||||
| 2025-08-06 | 13F | Golden State Wealth Management, LLC | 24 | 0.00 | 1 | |||||
| 2025-07-29 | NP | WAVLX - Wavelength Interest Rate Neutral Fund | 280,963 | -9.35 | 7,089 | -10.81 | ||||
| 2025-07-24 | 13F | Ronald Blue Trust, Inc. | 4,737 | 1.89 | 121 | 3.45 | ||||
| 2025-08-08 | 13F | Financial Gravity Companies, Inc. | 590 | -26.89 | 15 | -25.00 | ||||
| 2025-07-22 | 13F | Peoples Bank /oh | 9,094 | 0.00 | 232 | 1.32 | ||||
| 2025-07-30 | 13F | Greatmark Investment Partners, Inc. | 0 | -100.00 | 0 | |||||
| 2025-08-13 | 13F | Virtus Investment Advisers, Inc. | 0 | -100.00 | 0 | |||||
| 2025-07-18 | 13F | Cantor Fitzgerald Investment Adviser L.p. | 403,848 | -1.70 | 10,290 | -0.45 | ||||
| 2025-07-24 | 13F | Capital Advisors, Ltd. LLC | 35,064 | 0.00 | 1 | |||||
| 2025-07-25 | 13F | Sequoia Financial Advisors, LLC | 63,256 | -66.75 | 1,612 | -66.34 | ||||
| 2025-08-13 | 13F | Providence Capital Advisors, LLC | 40 | 1 | ||||||
| 2025-08-13 | 13F | Icon Advisers Inc/co | 30,000 | 200.00 | 764 | 204.38 | ||||
| 2025-08-13 | 13F | 1832 Asset Management L.P. | 703,175 | 3.40 | 17,917 | 4.71 | ||||
| 2025-07-31 | 13F | Mason & Associates Inc | 277,853 | -46.10 | 7,080 | -45.42 | ||||
| 2025-07-09 | 13F | Beacon Financial Group | 17,786 | -23.55 | 453 | -22.56 | ||||
| 2025-08-05 | 13F | iA Global Asset Management Inc. | 2,419,136 | 1,806.33 | 62 | 1,933.33 | ||||
| 2025-07-23 | 13F | RMG Wealth Management LLC | 2,455,713 | 62,337 | ||||||
| 2025-08-14 | 13F | Hancock Whitney Corp | 25,271 | -0.60 | 644 | 0.63 | ||||
| 2025-07-24 | 13F | IFP Advisors, Inc | 2,985 | 9.22 | 76 | 11.76 | ||||
| 2025-05-08 | 13F | Nicolet Advisory Services, Llc | 0 | -100.00 | 0 | |||||
| 2025-06-26 | NP | FIXP - FolioBeyond Enhanced Fixed Income Premium ETF | 86,363 | 2,158 | ||||||
| 2025-07-28 | 13F | Rosenberg Matthew Hamilton | 57,111 | -2.67 | 1,455 | -1.42 | ||||
| 2025-08-14 | 13F | D. E. Shaw & Co., Inc. | 162,500 | -33.94 | 4,140 | -33.11 | ||||
| 2025-04-21 | 13F | Bay Colony Advisory Group, Inc d/b/a Bay Colony Advisors | 0 | -100.00 | 0 | -100.00 | ||||
| 2025-08-26 | 13F/A | Thrivent Financial For Lutherans | 1,394,700 | 0.00 | 36 | 2.94 | ||||
| 2025-05-06 | 13F | WT Wealth Management | 105,656 | 188.16 | 2,658 | 187.35 | ||||
| 2025-08-29 | NP | AIIFX - Timber Point Alternative Income Fund Institutional Class Shares | 155,000 | 34.78 | 3,949 | 36.50 | ||||
| 2025-05-15 | 13F | Qube Research & Technologies Ltd | 0 | -100.00 | 0 | |||||
| 2025-07-17 | 13F | Moss Adams Wealth Advisors LLC | 16,644 | 2.46 | 424 | 3.92 | ||||
| 2025-07-23 | 13F | Opulen Financial Group LLC | 30,124 | -1.40 | 768 | -0.13 | ||||
| 2025-08-14 | 13F | Lebenthal Global Advisors, LLC | 376,978 | 115.29 | 9,605 | 118.05 | ||||
| 2025-08-14 | 13F | Peapack Gladstone Financial Corp | 27,510 | 6.11 | 1 | |||||
| 2025-08-14 | 13F | Transamerica Financial Advisors, Inc. | 11 | 0.00 | 0 | |||||
| 2025-07-11 | 13F | SILVER OAK SECURITIES, Inc | 0 | -100.00 | 0 | |||||
| 2025-08-14 | 13F | Bank Of America Corp /de/ | 2,789,991 | 11.50 | 71,089 | 12.91 | ||||
| 2025-08-13 | 13F | Crabel Capital Management, LLC | 276,892 | 152.95 | 7,055 | 156.17 | ||||
| 2025-05-30 | NP | IOBAX - ICON FLEXIBLE BOND FUND Investor Class | 10,000 | -75.00 | 252 | -74.85 | ||||
| 2025-07-28 | 13F | Essex LLC | 1,050,861 | -3.52 | 26,776 | -2.29 | ||||
| 2025-07-22 | 13F | Valeo Financial Advisors, LLC | 22,975 | -0.55 | 585 | 0.69 | ||||
| 2025-08-12 | 13F | Steward Partners Investment Advisory, Llc | 208,733 | -9.71 | 5,319 | -8.56 | ||||
| 2025-08-08 | 13F | Avantax Advisory Services, Inc. | 31,952 | 3.46 | 814 | 4.76 | ||||
| 2025-07-18 | 13F | PFG Investments, LLC | 0 | -100.00 | 0 | |||||
| 2025-07-17 | 13F | BayBridge Capital Group, LLC | 153,499 | 2.08 | 3,911 | 3.38 | ||||
| 2025-07-16 | 13F | Register Financial Advisors LLC | 200 | 0.00 | 5 | 0.00 | ||||
| 2025-08-15 | 13F | Global View Capital Management LLC | 28,410 | 4.55 | 724 | 5.86 | ||||
| 2025-08-14 | 13F | Smartleaf Asset Management LLC | 3,784 | 15.90 | 96 | 17.07 | ||||
| 2025-07-16 | 13F | St Germain D J Co Inc | 432 | 6.67 | 11 | 10.00 | ||||
| 2025-08-08 | 13F | Larson Financial Group LLC | 850 | 0.00 | 22 | 0.00 | ||||
| 2025-08-13 | 13F | Colonial Trust Co / SC | 11,700 | 0.00 | 298 | 1.36 | ||||
| 2025-07-10 | 13F | Capital Advisory Group Advisory Services, LLC | 15,000 | 0.00 | 382 | 1.33 | ||||
| 2025-07-11 | 13F | Farther Finance Advisors, LLC | 5,356 | -17.81 | 136 | -16.56 | ||||
| 2025-08-14 | 13F | Banque Transatlantique SA | 0 | -100.00 | 0 | |||||
| 2025-07-24 | 13F | Costello Asset Management, INC | 89 | 0.00 | 2 | 0.00 | ||||
| 2025-08-01 | 13F | First National Trust Co | 163,503 | 17.09 | 4,166 | 18.59 | ||||
| 2025-07-09 | 13F | VisionPoint Advisory Group, LLC | 74,278 | 19.43 | 1,893 | 20.97 | ||||
| 2025-08-13 | 13F | Townsquare Capital Llc | 0 | -100.00 | 0 | |||||
| 2025-08-04 | 13F | Pensionmark Financial Group, Llc | 200,795 | 2.59 | 5,116 | 3.90 | ||||
| 2025-08-12 | 13F | RiverFront Investment Group, LLC | 362,365 | 9,233 | ||||||
| 2025-08-11 | 13F | Aptus Capital Advisors, LLC | 1,569 | 366.96 | 40 | 387.50 | ||||
| 2025-08-12 | 13F | Pacer Advisors, Inc. | 79,365 | 0.00 | 2,022 | 1.30 | ||||
| 2025-08-12 | 13F | Western Asset Management Company, LLC | 221,350 | 14.90 | 5,640 | 16.34 | ||||
| 2025-08-11 | 13F | Summit Wealth Partners, LLC | 13,999 | -52.79 | 357 | -52.28 | ||||
| 2025-05-06 | NP | KAMIX - Kensington Managed Income Fund Institutional Class Shares | 1,450,000 | 0.00 | 36,482 | -0.36 | ||||
| 2025-08-14 | 13F | Headlands Technologies LLC | 0 | -100.00 | 0 | -100.00 | ||||
| 2025-08-08 | 13F | Meridian Wealth Management, LLC | 10,626 | -9.99 | 271 | -9.09 | ||||
| 2025-08-12 | 13F | Jpmorgan Chase & Co | 419,449 | -58.24 | 10,688 | -57.71 | ||||
| 2025-07-31 | 13F | Topsail Wealth Management, LLC | 4,435 | 0.00 | 113 | 1.80 | ||||
| 2025-09-04 | 13F/A | Advisor Group Holdings, Inc. | 957,993 | 169.40 | 24,223 | 170.70 | ||||
| 2025-07-14 | 13F | Proathlete Wealth Management Llc | 1,905 | 0.00 | 49 | 2.13 | ||||
| 2025-08-11 | 13F | Anfield Capital Management, LLC | 93 | 0.00 | 2 | 0.00 | ||||
| 2025-07-30 | 13F | BTS Asset Management, Inc. | 23,660 | 603 | ||||||
| 2025-07-15 | 13F | Heritage Oak Wealth Advisors Llc | 71,378 | -0.67 | 1,819 | 0.55 | ||||
| 2025-05-15 | 13F | Hrt Financial Lp | 0 | -100.00 | 0 | |||||
| 2025-07-11 | 13F | Cypress Financial Planning Llc | 53,094 | 2.29 | 1,353 | 3.60 | ||||
| 2025-04-28 | 13F | Strategic Financial Concepts, LLC | 0 | -100.00 | 0 | -100.00 | ||||
| 2025-07-30 | 13F | Strategic Blueprint, LLC | 40,214 | 20.17 | 1,025 | 21.76 | ||||
| 2025-08-13 | 13F | Renaissance Technologies Llc | 1,324,300 | 16.01 | 33,743 | 17.49 | ||||
| 2025-07-08 | 13F | Parallel Advisors, LLC | 5,710 | 0.00 | 145 | 1.40 | ||||
| 2025-08-05 | 13F | Tme Financial, Inc. | 8,683 | 1.39 | 221 | 2.79 | ||||
| 2025-08-13 | 13F | Flow Traders U.s. Llc | 28,910 | 101.44 | 1 | |||||
| 2025-07-29 | 13F | Commons Capital, Llc | 0 | -100.00 | 0 | |||||
| 2025-08-14 | 13F | Stifel Financial Corp | 718,173 | -0.13 | 18,299 | 1.14 | ||||
| 2025-07-16 | 13F | ORG Wealth Partners, LLC | 68 | 0.00 | 2 | 0.00 | ||||
| 2025-08-13 | 13F | Healthcare Of Ontario Pension Plan Trust Fund | 1,000,000 | 0.00 | 25,480 | 1.27 | ||||
| 2025-08-06 | 13F | Csenge Advisory Group | 47,615 | 308.89 | 1,201 | 318.47 | ||||
| 2025-08-01 | 13F | Envestnet Asset Management Inc | 2,741,395 | 2.66 | 69,626 | 3.63 | ||||
| 2025-06-20 | NP | ABXB - TrimTabs Donoghue Forlines Tactical High Yield ETF | 1,066 | -83.10 | 27 | -83.85 | ||||
| 2025-08-20 | 13F/A | Coppell Advisory Solutions LLC | 46,323 | -35.06 | 1,178 | -34.32 | ||||
| 2025-08-14 | 13F | Two Sigma Securities, Llc | 36,980 | 350.26 | 942 | 357.28 | ||||
| 2025-03-28 | NP | DYFI - IDX DYNAMIC FIXED INCOME ETF | 211,551 | -51.59 | 5,407 | -51.43 | ||||
| 2025-08-05 | 13F | NewSquare Capital LLC | 0 | 0 | ||||||
| 2025-08-06 | 13F | AE Wealth Management LLC | 118,169 | 5.62 | 3,011 | 6.97 | ||||
| 2025-08-13 | 13F | Millstone Evans Group, LLC | 969 | 0.00 | 25 | 0.00 | ||||
| 2025-08-27 | NP | ACTIX - Advisors Capital Tactical Fixed Income Fund | 599,300 | 16.01 | 15,270 | 17.49 | ||||
| 2025-08-05 | 13F | Fullcircle Wealth Llc | 26,340 | 668 | ||||||
| 2025-08-14 | 13F | GWM Advisors LLC | 41,015 | 23.10 | 1,045 | 24.70 | ||||
| 2025-08-08 | 13F | SBI Securities Co., Ltd. | 20,537 | 4.72 | 523 | 6.09 | ||||
| 2025-08-12 | 13F | SRS Capital Advisors, Inc. | 3,633 | -17.75 | 93 | -17.12 | ||||
| 2025-08-11 | 13F | Private Advisor Group, LLC | 60,475 | -3.34 | 1,541 | -2.16 | ||||
| 2025-07-14 | 13F | Park Avenue Securities Llc | 373,269 | 0.76 | 10 | 0.00 | ||||
| 2025-08-05 | 13F | EPG Wealth Management LLC | 424 | 0.00 | 11 | 0.00 | ||||
| 2025-07-21 | 13F | Curran Financial Partners, LLC | 528,055 | 4.33 | 13,455 | 5.65 | ||||
| 2025-07-28 | 13F | Copia Wealth Management | 132 | 3 | ||||||
| 2025-08-08 | 13F | Emerald Investment Partners, Llc | 40 | 1 | ||||||
| 2025-08-12 | 13F | Choate Investment Advisors | 13,880 | 0.00 | 354 | 1.15 | ||||
| 2025-08-14 | 13F | Wiley Bros.-aintree Capital, Llc | 294,224 | -16.55 | 7,497 | -15.42 | ||||
| 2025-07-11 | 13F | Matthew Goff Investment Advisor, LLC | 0 | -100.00 | 0 | |||||
| 2025-07-11 | 13F/A | Umb Bank N A/mo | 800 | 0.00 | 20 | 0.00 | ||||
| 2025-08-13 | 13F | Everstar Asset Management, LLC | 42,076 | 0.00 | 1,072 | 1.32 | ||||
| 2025-08-12 | 13F | Atlas Capital Advisors Llc | 0 | -100.00 | 0 | |||||
| 2025-07-28 | 13F | Axxcess Wealth Management, Llc | 10,151 | 0.00 | 259 | 1.18 | ||||
| 2025-07-28 | 13F | Private Wealth Asset Management, LLC | 898 | 0.00 | 23 | 0.00 | ||||
| 2025-08-28 | NP | PLFLX - Aristotle Floating Rate Income Fund Class A | 1,169,350 | -14.07 | 29,795 | -12.98 | ||||
| 2025-08-13 | 13F | Continuum Advisory, LLC | 0 | -100.00 | 0 | |||||
| 2025-08-14 | 13F | Diversify Advisory Services, LLC | 224,274 | 317.45 | 5,694 | 321.78 | ||||
| 2025-04-21 | 13F | ORG Partners LLC | 0 | -100.00 | 0 | |||||
| 2025-08-13 | 13F | Northwestern Mutual Wealth Management Co | 147,072 | -72.62 | 3,747 | -72.27 | ||||
| 2025-07-29 | 13F | Oxbow Advisors, LLC | 10,177 | 259 | ||||||
| 2025-08-14 | 13F | Glen Eagle Advisors, LLC | 52 | 0.00 | 1 | 0.00 | ||||
| 2025-07-11 | 13F | Brendel Financial Advisors LLC | 104,366 | 2.04 | 3 | 0.00 | ||||
| 2025-08-14 | 13F | Hilltop Holdings Inc. | 17,998 | 0.76 | 459 | 2.00 | ||||
| 2025-05-13 | 13F | Eldridge Investment Advisors, Inc. | 0 | -100.00 | 0 | |||||
| 2025-08-12 | 13F | Proequities, Inc. | 0 | 0 | ||||||
| 2025-08-13 | 13F | Summit Financial, LLC | 9,415 | -12.35 | 240 | -11.48 | ||||
| 2025-08-14 | 13F | Raymond James Financial Inc | 675,948 | -22.02 | 17,223 | -21.03 | ||||
| 2025-08-28 | NP | ABHIX - High-yield Fund Investor Class This fund is a listed as child fund of American Century Companies Inc and if that institution has disclosed ownership in this security, then these positions will not be double counted when calculating total shares and total value | 44,700 | 0.00 | 1,139 | 1.25 | ||||
| 2025-08-07 | 13F | Lakeridge Wealth Management LLC | 20,502 | 30.98 | 522 | 32.82 | ||||
| 2025-08-06 | 13F | Commonwealth Equity Services, Llc | 239,830 | -4.37 | 6 | 0.00 | ||||
| 2025-08-13 | 13F | Quadrature Capital Ltd | 617,893 | 15,753 | ||||||
| 2025-04-01 | 13F | Massmutual Trust Co Fsb/adv | 0 | -100.00 | 0 | |||||
| 2025-08-14 | 13F | Kovitz Investment Group Partners, LLC | 269,055 | 6,856 | ||||||
| 2025-07-08 | 13F | Moulton Wealth Management, Inc | 440,775 | 255.23 | 11,196 | 258.70 | ||||
| 2025-07-30 | 13F | Whittier Trust Co | 4,657 | 0.00 | 119 | 0.85 | ||||
| 2025-07-28 | 13F | Duncker Streett & Co Inc | 5,631 | 0.00 | 143 | 1.42 | ||||
| 2025-08-14 | 13F | BlueCrest Capital Management Ltd | 129,687 | 3,304 | ||||||
| 2025-08-05 | 13F | Sigma Planning Corp | 9,032 | 230 | ||||||
| 2025-08-11 | 13F | Cornerstone Planning Group LLC | 0 | -100.00 | 0 | |||||
| 2025-07-31 | 13F | Ballast Advisors Llc | 18,198 | 4.69 | 464 | 5.95 | ||||
| 2025-08-12 | 13F | FreeGulliver LLC | 0 | -100.00 | 0 | |||||
| 2025-08-12 | 13F | Employees' Retirement Fund of the City of Fort Worth | 726,800 | 0.00 | 18,286 | 0.00 | ||||
| 2025-08-04 | 13F | AMG National Trust Bank | 24,000 | 612 | ||||||
| 2025-08-14 | 13F | Capstone Investment Advisors, Llc | 732,801 | 77.56 | 18,672 | 79.82 | ||||
| 2025-07-10 | 13F | Tompkins Financial Corp | 2,051 | 0.00 | 52 | 1.96 | ||||
| 2025-07-22 | 13F | Private Wealth Group, LLC | 57,442 | 0.40 | 1,464 | 1.67 | ||||
| 2025-08-28 | NP | Northern Lights Fund Trust - Sierra Tactical Bond Fund Investor Class Shares | 4,025,200 | -24.22 | 102,562 | -23.25 | ||||
| 2025-07-30 | 13F | Mid-American Wealth Advisory Group, Inc. | 202 | 5 | ||||||
| 2025-08-11 | 13F | Tidemark, LLC | 8,248 | 0.32 | 210 | 1.94 | ||||
| 2025-08-06 | 13F | First Horizon Advisors, Inc. | 1,576 | 360.82 | 40 | 400.00 | ||||
| 2025-07-25 | 13F | We Are One Seven, LLC | 70,285 | 6.18 | 1,791 | 7.51 | ||||
| 2025-08-04 | 13F | Adell Harriman & Carpenter Inc | 180,854 | -0.66 | 4,608 | 0.61 | ||||
| 2025-08-11 | 13F | HighTower Advisors, LLC | 581,346 | -5.40 | 14,813 | -4.20 | ||||
| 2025-07-29 | 13F | SAM Advisors, LLC | 233,442 | 5.84 | 5,948 | 7.19 | ||||
| 2025-08-14 | 13F | Blue Capital, Inc. | 135,938 | -12.53 | 3,464 | -11.75 | ||||
| 2025-08-05 | 13F | Bank of New York Mellon Corp | 1,082,644 | -27.47 | 27,586 | -26.54 | ||||
| 2025-08-14 | 13F | Holt Capital Advisors, L.L.C. dba Holt Capital Partners, L.P. | 312,199 | -3.35 | 7,955 | -2.13 | ||||
| 2025-05-14 | 13F | GM Advisory Group, Inc. | 0 | -100.00 | 0 | |||||
| 2025-08-14 | 13F | Susquehanna International Group, Llp | 0 | -100.00 | 0 | |||||
| 2025-07-17 | 13F | Paradigm Financial Partners, Llc | 27,799 | -5.59 | 708 | -4.32 | ||||
| 2025-07-31 | 13F | Sharper & Granite LLC | 241,070 | 2.60 | 6,116 | 3.45 | ||||
| 2025-08-13 | 13F | Russell Investments Group, Ltd. | 0 | -100.00 | 0 | |||||
| 2025-08-07 | 13F | Fidelis Capital Partners, LLC | 14,204 | 16.20 | 360 | 17.65 | ||||
| 2025-07-31 | 13F | Wright Fund Managment, LLC | 5,311,500 | 0.00 | 133,637 | 0.00 | ||||
| 2025-08-13 | 13F | Invesco Ltd. | 166,957 | 0.00 | 4,254 | 1.29 | ||||
| 2025-04-23 | 13F | Win Advisors, Inc | 0 | -100.00 | 0 | |||||
| 2025-08-15 | 13F | Equitable Holdings, Inc. | 343,664 | 14.75 | 8,757 | 16.20 | ||||
| 2025-08-13 | 13F | Trustmark National Bank Trust Department | 263,393 | 1.01 | 6,711 | 2.30 | ||||
| 2025-08-18 | NP | PACIFIC SELECT FUND - Floating Rate Income Portfolio Class I | 171,016 | 0.00 | 4,357 | 1.28 | ||||
| 2025-08-13 | 13F | Guggenheim Capital Llc | 332,304 | 11.29 | 8,467 | 12.71 | ||||
| 2025-05-12 | 13F | Independent Advisor Alliance | 0 | -100.00 | 0 | |||||
| 2025-08-14 | 13F | McIlrath & Eck, LLC | 1,126 | 0.00 | 29 | 0.00 | ||||
| 2025-08-14 | 13F | Mercer Global Advisors Inc /adv | 37,778 | -7.33 | 963 | -6.15 | ||||
| 2025-07-25 | 13F | Endowment Wealth Management, Inc. | 8,394 | 214 | ||||||
| 2025-08-11 | 13F | Shenkman Capital Management Inc | 600,880 | 114.57 | 15,280 | 116.89 | ||||
| 2025-08-12 | 13F | Insigneo Advisory Services, Llc | 21,005 | 535 | ||||||
| 2025-08-14 | 13F | IHT Wealth Management, LLC | 41,782 | -8.58 | 1,065 | -7.40 | ||||
| 2025-05-15 | 13F | Marshall Wace, Llp | 0 | -100.00 | 0 | |||||
| 2025-06-24 | NP | NSTLX - Neuberger Berman Strategic Income Fund Institutional Class | 1,408,040 | 35,187 | ||||||
| 2025-08-08 | 13F | Cetera Investment Advisers | 521,593 | 21.07 | 13,290 | 22.61 | ||||
| 2025-08-11 | 13F | Insight 2811, Inc. | 36,206 | 2.32 | 923 | 3.60 | ||||
| 2025-08-13 | 13F | Capital Analysts, Inc. | 44,259 | 25.10 | 1 | |||||
| 2025-04-21 | 13F | Nelson, Van Denburg & Campbell Wealth Management Group, LLC | 0 | -100.00 | 0 | |||||
| 2025-07-18 | 13F/A | MJT & Associates Financial Advisory Group, Inc. | 69 | 0.00 | 2 | 0.00 | ||||
| 2025-08-08 | 13F | Kingsview Wealth Management, LLC | 260,519 | 4.75 | 6,638 | 6.09 | ||||
| 2025-07-09 | 13F | WealthCare Investment Partners, LLC | 65,898 | 10.46 | 1,674 | 13.96 | ||||
| 2025-07-21 | 13F | Empirical Financial Services, LLC d.b.a. Empirical Wealth Management | 3,145,151 | 4.70 | 80,138 | 6.03 | ||||
| 2025-07-11 | 13F | AA Financial Advisors, LLC | 33,962 | 9.22 | 865 | 10.61 | ||||
| 2025-08-14 | 13F | Comerica Bank | 45,738 | -10.24 | 1,165 | -9.13 | ||||
| 2025-08-18 | 13F/A | National Bank Of Canada /fi/ | 1,771 | -1.06 | 45 | 0.00 | ||||
| 2025-08-27 | 13F/A | Brinker Capital Investments, LLC | 9,822 | -1.27 | 250 | 0.00 | ||||
| 2025-04-15 | 13F | Integrated Advisors Network LLC | 0 | -100.00 | 0 | |||||
| 2025-08-07 | 13F | PFG Advisors | 134,879 | -21.39 | 3,437 | -20.39 | ||||
| 2025-08-11 | 13F | Sykon Capital Llc | 72,770 | -20.62 | 1,854 | -19.60 | ||||
| 2025-08-12 | 13F | Horizon Financial Services, Llc | 64,448 | 3.12 | 1,642 | 4.45 | ||||
| 2025-08-12 | 13F | O'shaughnessy Asset Management, Llc | 20,217 | 370.05 | 515 | 376.85 | ||||
| 2025-08-12 | 13F | Vestor Capital, Llc | 687 | -83.83 | 0 | |||||
| 2025-07-14 | 13F | Toth Financial Advisory Corp | 1,045 | 0.00 | 27 | 0.00 | ||||
| 2025-08-04 | 13F | Atria Investments Llc | 711,195 | 234.69 | 18,121 | 238.96 | ||||
| 2025-08-04 | 13F | Assetmark, Inc | 2,259,428 | 20.41 | 57,570 | 21.94 | ||||
| 2025-08-04 | 13F | MeadowBrook Investment Advisors LLC | 1,260 | 0.00 | 32 | 3.23 | ||||
| 2025-07-15 | 13F | Missouri Trust & Investment Co | 213,506 | -0.89 | 5,440 | 0.37 | ||||
| 2025-07-31 | 13F | Guardian Wealth Advisors, LLC | 137,555 | -10.58 | 3,505 | -9.46 | ||||
| 2025-05-13 | 13F | Global Endowment Management, LP | 0 | -100.00 | 0 | |||||
| 2025-08-01 | 13F | Boyd Watterson Asset Management Llc/oh | 1,379 | -87.77 | 35 | -87.63 | ||||
| 2025-07-22 | 13F | Belpointe Asset Management LLC | 0 | -100.00 | 0 | |||||
| 2025-08-14 | 13F | Susquehanna International Group, Llp | Put | 8,800 | -85.19 | 224 | -85.01 | |||
| 2025-07-29 | 13F | Stratos Wealth Partners, LTD. | 50,970 | -83.46 | 1,299 | -83.26 | ||||
| 2025-08-08 | 13F | Smithfield Trust Co | 49,036 | 0.00 | 1 | 0.00 | ||||
| 2025-07-31 | 13F | State of New Jersey Common Pension Fund D | 3,689,415 | -9.78 | 94,006 | -8.63 | ||||
| 2025-07-23 | 13F | Eagle Strategies LLC | 12,046 | 0.32 | 307 | 1.32 | ||||
| 2025-07-10 | 13F | Wealth Enhancement Advisory Services, Llc | 116,736 | 19.22 | 2,965 | 20.38 | ||||
| 2025-07-31 | 13F | Cambridge Investment Research Advisors, Inc. | 49,584 | -19.70 | 1 | 0.00 | ||||
| 2025-08-07 | 13F | Readystate Asset Management Lp | 122,310 | 848.14 | 3,116 | 861.73 | ||||
| 2025-08-14 | 13F | Bnp Paribas Arbitrage, Sa | 80,700 | 0.28 | 2,056 | 1.58 | ||||
| 2025-07-25 | 13F | Allspring Global Investments Holdings, LLC | 868,026 | 22,117 | ||||||
| 2025-08-08 | 13F | Creative Planning | 191,152 | -2.65 | 4,871 | -1.42 | ||||
| 2025-08-22 | NP | PPIAX - DWS Short Duration Fund Class A | 450,000 | 100.00 | 11,466 | 102.54 | ||||
| 2025-08-01 | 13F | Financial Counselors Inc | 0 | -100.00 | 0 | |||||
| 2025-05-01 | 13F | Stephens Inc /ar/ | 0 | -100.00 | 0 | |||||
| 2025-08-07 | 13F | Palouse Capital Management, Inc. | 1,947 | -58.36 | 50 | -58.12 | ||||
| 2025-08-12 | 13F | Howe & Rusling Inc | 493 | 13 | ||||||
| 2025-07-15 | 13F | Financial Partners Group, Inc | 272,774 | -39.48 | 6,950 | -38.71 | ||||
| 2025-08-13 | 13F | Sumitomo Mitsui Financial Group, Inc. | 2,023,706 | 5.59 | 51,564 | 6.94 | ||||
| 2025-07-17 | 13F | City Holding Co | 0 | -100.00 | 0 | |||||
| 2025-07-31 | 13F | Wealthfront Advisers Llc | 3,479,826 | 6.49 | 88,666 | 7.85 | ||||
| 2025-08-14 | 13F | Citadel Advisors Llc | 144,526 | 3,683 | ||||||
| 2025-08-14 | 13F | Citadel Advisors Llc | Put | 12,400 | -40.95 | 316 | -40.34 | |||
| 2025-08-15 | 13F | Captrust Financial Advisors | 10,572 | -0.37 | 269 | 1.13 | ||||
| 2025-07-08 | 13F | Adamsbrown Wealth Consultants Llc | 12,720 | 0.00 | 324 | 1.25 | ||||
| 2025-08-14 | 13F | Clark Capital Management Group, Inc. | 2,866,902 | -1.79 | 73,049 | -0.54 | ||||
| 2025-08-13 | 13F | Edgestream Partners, L.P. | 27,402 | 698 | ||||||
| 2025-08-14 | 13F | Citadel Advisors Llc | Call | 21,000 | -79.57 | 535 | -79.31 | |||
| 2025-04-18 | 13F | Optivise Advisory Services LLC | 0 | -100.00 | 0 | |||||
| 2025-07-31 | 13F | Oppenheimer & Co Inc | 38,504 | 8.30 | 981 | 9.73 | ||||
| 2025-08-06 | 13F | ETF Store, Inc. | 8,620 | -23.60 | 220 | -22.61 | ||||
| 2025-07-22 | 13F | Grimes & Company, Inc. | 6,641,043 | -18.60 | 169,214 | -17.56 | ||||
| 2025-08-06 | 13F | Mark Sheptoff Financial Planning, Llc | 97 | 2 | ||||||
| 2025-08-14 | 13F | Financial Engines Advisors L.L.C. | 20,862 | 532 | ||||||
| 2025-08-15 | 13F | Tower Research Capital LLC (TRC) | 179 | 5 | ||||||
| 2025-08-18 | 13F | Front Row Advisors LLC | 150 | 0.00 | 4 | 0.00 | ||||
| 2025-05-14 | 13F | Oarsman Capital, Inc. | 0 | -100.00 | 0 | -100.00 | ||||
| 2025-08-14 | 13F | Little Harbor Advisors, LLC | 232,470 | -18.62 | 6 | -28.57 | ||||
| 2025-07-07 | 13F | Thurston, Springer, Miller, Herd & Titak, Inc. | 150 | 0.00 | 4 | 0.00 | ||||
| 2025-08-11 | 13F | Western Wealth Management, LLC | 15,607 | 5.98 | 398 | 7.30 | ||||
| 2025-07-30 | 13F | Bogart Wealth, LLC | 44,477 | 20.12 | 1,133 | 21.70 | ||||
| 2025-07-25 | 13F | Cwm, Llc | 465,755 | -18.61 | 12 | -21.43 | ||||
| 2025-08-13 | 13F | Twin Peaks Wealth Advisors, LLC | 84 | 2 | ||||||
| 2025-08-11 | 13F | Delta Asset Management Llc/tn | 376 | 0.00 | 10 | 0.00 | ||||
| 2025-07-16 | 13F | Gradient Capital Advisors, LLC | 11,565 | 0.00 | 295 | 1.38 | ||||
| 2025-05-14 | 13F | Quartz Partners, LLC | 0 | -100.00 | 0 | |||||
| 2025-07-09 | 13F | Sterling Manor Financial, LLC | 279,839 | -0.03 | 7,130 | 1.25 | ||||
| 2025-08-12 | 13F | WealthTrak Capital Management LLC | 53,312 | 1,358 | ||||||
| 2025-08-07 | 13F | Midwest Trust Co | 37,420 | 953 | ||||||
| 2025-08-19 | 13F | Advisory Services Network, LLC | 59,900 | 33.35 | 1,523 | 34.78 | ||||
| 2025-07-15 | 13F | Hidden Cove Wealth Management, LLC | 177,931 | 18.58 | 4,534 | 20.08 | ||||
| 2025-04-30 | 13F | Sofos Investments, Inc. | 607 | -71.98 | 15 | -72.22 | ||||
| 2025-08-28 | NP | TFAFX - Tactical Growth Allocation Fund Class I | 7,300 | 7.35 | 186 | 8.77 | ||||
| 2025-07-23 | 13F | Fulton Breakefield Broenniman Llc | 450,699 | -5.13 | 11,484 | -3.92 | ||||
| 2025-08-12 | 13F | CFC Planning Co LLC | 38,840 | -16.37 | 990 | -15.33 | ||||
| 2025-08-11 | 13F | Strategic Wealth Partners, Ltd. | 643 | 16 | ||||||
| 2025-07-17 | 13F | Altus Wealth Management, LLC | 86,448 | 6.27 | 2,203 | 7.62 | ||||
| 2025-07-25 | 13F | Atria Wealth Solutions, Inc. | 36,038 | 15.47 | 918 | 16.94 | ||||
| 2025-08-12 | 13F | Ameritas Investment Partners, Inc. | 2,665 | 3.29 | 68 | 4.69 | ||||
| 2025-08-08 | 13F | Wrapmanager Inc | 12,742 | -9.37 | 325 | -8.22 | ||||
| 2025-05-30 | NP | NB Crossroads Private Markets Access Fund LLC | 0 | -100.00 | 0 | -100.00 | ||||
| 2025-07-16 | 13F | Ironwood Wealth Management, Inc. | 322,893 | 0.01 | 8,166 | 3.91 | ||||
| 2025-07-28 | 13F | Harbour Investments, Inc. | 994 | -33.69 | 25 | -32.43 | ||||
| 2025-08-13 | 13F | Virtus Fixed Income Advisers, LLC | 35,960 | 916 | ||||||
| 2025-04-07 | 13F | AdvisorNet Financial, Inc | 0 | -100.00 | 0 | |||||
| 2025-05-05 | 13F | Gries Financial Llc | 0 | -100.00 | 0 | |||||
| 2025-08-11 | 13F | Covestor Ltd | 0 | -100.00 | 0 | |||||
| 2025-08-28 | NP | BTSAX - BTS Managed Income Fund Class A Shares | 22,338 | 86.91 | 569 | 89.04 | ||||
| 2025-08-06 | 13F | New Millennium Group LLC | 171 | -11.40 | 4 | 0.00 | ||||
| 2025-08-11 | 13F | Wealthgarden F.s. Llc | 83,529 | 33.22 | 2,124 | 34.69 | ||||
| 2025-08-13 | 13F | Great Diamond Partners, LLC | 100,981 | 0.81 | 2,573 | 2.06 | ||||
| 2025-08-12 | 13F | Longfellow Investment Management Co Llc | 118,150 | 0.00 | 3,010 | 1.28 | ||||
| 2025-07-29 | 13F | Disciplined Investments, LLC | 342,722 | 4.61 | 8,733 | 5.95 | ||||
| 2025-07-30 | 13F | Phoenix Holdings Ltd. | 33,927 | 0.00 | 864 | 1.29 | ||||
| 2025-07-17 | 13F | KG&L Capital Management,LLC | 61,740 | -1.94 | 1,573 | -0.69 | ||||
| 2025-08-11 | 13F | BluePath Capital Management, LLC | 22,544 | -26.92 | 574 | -26.03 | ||||
| 2025-07-24 | 13F | Bernard Wealth Management Corp. | 807 | -0.86 | 21 | 0.00 | ||||
| 2025-04-22 | 13F | Advisor Resource Council | 0 | -100.00 | 0 | |||||
| 2025-05-15 | 13F/A | Orion Portfolio Solutions, LLC | 9,948 | 2.15 | 250 | 2.04 | ||||
| 2025-05-14 | 13F | Caitlin John, LLC | 0 | -100.00 | 0 | |||||
| 2025-08-14 | 13F | Toroso Investments, LLC | 320,199 | 8,159 | ||||||
| 2025-05-05 | 13F | Transce3nd, LLC | 0 | -100.00 | 0 | |||||
| 2025-08-04 | 13F | Creative Financial Designs Inc /adv | 1,741 | 0.52 | 44 | 2.33 | ||||
| 2025-08-05 | 13F | ADG Wealth Management Group, LLC | 0 | -100.00 | 0 | |||||
| 2025-08-14 | 13F | Fairview Capital Investment Management, Llc | 150,619 | -1.26 | 3,838 | -0.03 | ||||
| 2025-08-14 | 13F | Snowden Capital Advisors LLC | 103,482 | -0.08 | 2,637 | 1.19 | ||||
| 2025-08-14 | 13F | Goldman Sachs Group Inc | 18,065 | -85.47 | 460 | -85.29 | ||||
| 2025-04-15 | 13F | SG Americas Securities, LLC | 0 | -100.00 | 0 | |||||
| 2025-08-07 | 13F | Allworth Financial LP | 40,151 | -16.18 | 1,023 | -14.61 | ||||
| 2025-05-12 | 13F | SOUTH STATE Corp | 0 | -100.00 | 0 | |||||
| 2025-07-21 | 13F | Ameritas Advisory Services, LLC | 1,596 | 41 | ||||||
| 2025-05-08 | 13F | Endeavor Private Wealth, Inc. | 0 | -100.00 | 0 | |||||
| 2025-08-12 | 13F | Personal Cfo Solutions, Llc | 13,201 | -5.81 | 336 | -4.55 | ||||
| 2025-07-18 | 13F | Truist Financial Corp | 534,991 | -28.45 | 13,632 | -27.54 | ||||
| 2025-08-14 | 13F | Old Mission Capital Llc | 125,973 | -52.67 | 3,210 | -52.08 | ||||
| 2025-07-15 | 13F | EWG Elevate Inc. | 47,175 | -68.10 | 1,202 | -67.70 | ||||
| 2025-07-02 | 13F | Howard Financial Services, Ltd. | 842,349 | 4.76 | 21,463 | 6.09 | ||||
| 2025-07-18 | 13F | SOA Wealth Advisors, LLC. | 688 | 1.93 | 18 | 6.25 | ||||
| 2025-07-14 | 13F | Narus Financial Partners, LLC | 30,082 | 94.18 | 766 | 96.92 | ||||
| 2025-08-14 | 13F | Certified Advisory Corp | 338,175 | -0.69 | 8,617 | 0.57 | ||||
| 2025-08-14 | 13F | Boston Private Wealth Llc | 0 | -100.00 | 0 | |||||
| 2025-08-14 | 13F | Mariner, LLC | 838,810 | 97.86 | 21,373 | 100.38 | ||||
| 2025-08-01 | 13F | Rossby Financial, LCC | 16,664 | 2,640.79 | 425 | 2,726.67 | ||||
| 2025-06-30 | NP | FLRT - Pacer Pacific Asset Floating Rate High Income ETF | 79,365 | 1,983 | ||||||
| 2025-07-10 | 13F | Rockland Trust Co | 30,132 | -0.20 | 768 | 1.05 | ||||
| 2025-07-23 | 13F | Stonegate Investment Group, LLC | 9,590 | 19.88 | 244 | 21.39 | ||||
| 2025-08-07 | 13F | 1620 Investment Advisors, Inc. | 450 | 0.00 | 11 | 0.00 | ||||
| 2025-07-09 | 13F | Chesley Taft & Associates LLC | 35,550 | 0.00 | 906 | 1.23 | ||||
| 2025-07-22 | 13F | Sage Financial Group Inc | 14,023 | -58.17 | 357 | -57.65 | ||||
| 2025-07-22 | 13F | Wealthcare Advisory Partners LLC | 9,171 | 234 | ||||||
| 2025-08-13 | 13F | Johnson Financial Group, Inc. | 34,000 | 866 | ||||||
| 2025-08-15 | 13F | Morgan Stanley | 2,094,695 | -1.42 | 53,373 | -0.17 | ||||
| 2025-08-13 | 13F | Jones Financial Companies Lllp | 57,321 | 18.93 | 1,458 | 20.31 | ||||
| 2025-05-14 | 13F | Jane Street Group, Llc | 0 | -100.00 | 0 | |||||
| 2025-08-12 | 13F | Global Retirement Partners, LLC | 127,886 | 48.30 | 3,259 | 49.66 | ||||
| 2025-07-09 | 13F | Sapient Capital Llc | 63,475 | 0.00 | 1,617 | 1.25 | ||||
| 2025-08-13 | 13F | Baird Financial Group, Inc. | 56,889 | -13.74 | 1,450 | -12.66 | ||||
| 2025-07-28 | NP | JSOSX - JPMorgan Strategic Income Opportunities Fund Class I | 286,781 | 7,235 | ||||||
| 2025-08-22 | NP | RMIF - LHA Risk-Managed Income ETF | 232,470 | -18.62 | 5,923 | -17.59 | ||||
| 2025-08-13 | 13F | EverSource Wealth Advisors, LLC | 27 | -3.57 | 1 | |||||
| 2025-08-12 | 13F | Franklin Resources Inc | 1,428 | 36 | ||||||
| 2025-07-25 | 13F | Concurrent Investment Advisors, LLC | 9,350 | 238 | ||||||
| 2025-08-18 | 13F | Geneos Wealth Management Inc. | 27,012 | -9.15 | 688 | -8.02 | ||||
| 2025-08-06 | 13F | Rialto Wealth Management, LLC | 9 | 0.00 | 0 | |||||
| 2025-08-28 | NP | GPIFX - GuidePath(R) Flexible Income Allocation Fund Service Shares | 345,059 | 64.87 | 8,792 | 66.99 | ||||
| 2025-08-12 | 13F | Osborne Partners Capital Management, Llc | 0 | -100.00 | 0 | |||||
| 2025-08-13 | 13F | Virtue Capital Management, LLC | 0 | -100.00 | 0 | |||||
| 2025-04-29 | 13F | Hm Payson & Co | 1,535 | 0.00 | 39 | 0.00 | ||||
| 2025-08-11 | 13F | Angeles Investment Advisors, LLC | 989,520 | -76.40 | 25,213 | -76.10 | ||||
| 2025-08-13 | 13F | Cary Street Partners Financial Llc | 8,278 | -1.78 | 211 | -0.94 | ||||
| 2025-08-14 | 13F | Ameriprise Financial Inc | 15,779,630 | -15.52 | 401,509 | -15.32 | ||||
| 2025-07-23 | 13F | Axos Invest Inc. | 122,875 | -2.70 | 3,131 | -1.48 | ||||
| 2025-08-08 | 13F | Arcadia Investment Management Corp/mi | 275 | 0.00 | 7 | 16.67 | ||||
| 2025-08-15 | 13F | Prevail Innovative Wealth Advisors, Llc | 61,222 | 1,560 | ||||||
| 2025-07-28 | 13F | Courier Capital Llc | 19,535 | -15.34 | 498 | -14.31 | ||||
| 2025-08-14 | 13F | Millennium Management Llc | 19,878 | 506 | ||||||
| 2025-04-15 | 13F | Transform Wealth, LLC | 58,169 | -57.95 | 1,464 | -58.10 | ||||
| 2025-08-26 | NP | PSFRX - Virtus Newfleet Senior Floating Rate Fund Class A | 35,960 | -21.75 | 916 | -20.76 | ||||
| 2025-07-16 | 13F | American National Bank | 156 | 0.00 | 4 | 0.00 | ||||
| 2025-08-08 | 13F | Capital Investment Advisory Services, LLC | 1,270 | 0.32 | 32 | 3.23 | ||||
| 2025-08-12 | 13F | Running Point Capital Advisors, LLC | 7,819 | 199 | ||||||
| 2025-07-31 | 13F | Sumitomo Mitsui Trust Holdings, Inc. | 338,000 | 8,612 | ||||||
| 2025-08-06 | 13F | Vestmark Advisory Solutions, Inc. | 14,369 | 1.05 | 366 | 2.52 | ||||
| 2025-08-08 | 13F | Good Life Advisors, LLC | 780,200 | 10.26 | 19,879 | 11.67 | ||||
| 2025-07-10 | 13F | High Net Worth Advisory Group LLC | 36,000 | 0.00 | 917 | 1.33 | ||||
| 2025-07-29 | 13F | International Assets Investment Management, Llc | 32,599 | 1.37 | 831 | 2.60 | ||||
| 2025-08-12 | 13F | Jefferies Financial Group Inc. | 17,376 | 443 | ||||||
| 2025-08-14 | 13F | Hilton Capital Management, LLC | 175,195 | 4,464 | ||||||
| 2025-07-25 | 13F | Richardson Financial Services Inc. | 2,424 | 6.27 | 61 | 7.02 | ||||
| 2025-07-18 | 13F | Union Bancaire Privee, UBP SA | 319,600 | 100.25 | 8,127 | 102.57 | ||||
| 2025-07-24 | 13F | Eastern Bank | 2 | -96.00 | 0 | -100.00 | ||||
| 2025-08-06 | 13F | Destiny Capital Corp/CO | 10,320 | 0.00 | 263 | 1.16 | ||||
| 2025-08-04 | 13F | Spire Wealth Management | 0 | -100.00 | 0 | |||||
| 2025-08-14 | 13F | Warren Averett Asset Management, LLC | 21,103 | 10.57 | 538 | 11.88 | ||||
| 2025-04-29 | 13F | Lee Danner & Bass Inc | 0 | -100.00 | 0 | |||||
| 2025-08-12 | 13F | Park Square Financial Group, LLC | 9,478 | -29.21 | 242 | -28.27 | ||||
| 2025-08-01 | 13F | Davy Global Fund Management Ltd | 11,210 | 1.53 | 286 | 2.89 | ||||
| 2025-08-13 | 13F | Hsbc Holdings Plc | 1,952 | 0.00 | 1,056 | -60.38 | ||||
| 2025-07-15 | 13F | Surience Private Wealth Llc | 115,325 | -13.73 | 2,938 | -12.64 | ||||
| 2025-08-08 | 13F | Advisors Capital Management, LLC | 1,669,016 | 5.83 | 42,527 | 7.18 | ||||
| 2025-08-14 | 13F | Wells Fargo & Company/mn | 4,521,088 | 6.62 | 115,197 | 7.97 | ||||
| 2025-07-16 | 13F | Meridian Financial, LLC | 11,124 | 283 | ||||||
| 2025-07-28 | 13F | Mutual Advisors, LLC | 156,830 | 3,991 | ||||||
| 2025-05-01 | 13F | Quest 10 Wealth Builders, Inc. | 400 | -30.80 | 10 | -28.57 | ||||
| 2025-07-21 | 13F | Ascent Group, LLC | 8,382 | -13.40 | 214 | -12.35 | ||||
| 2025-08-13 | 13F | Denver Wealth Management, Inc. | 33,859 | -1.24 | 863 | 0.00 | ||||
| 2025-08-14 | 13F | Integrated Wealth Concepts LLC | 34,359 | -15.22 | 875 | -14.13 | ||||
| 2025-08-08 | 13F | Hartland & Co., LLC | 443,064 | 66.58 | 11,289 | 68.72 | ||||
| 2025-08-13 | 13F | GeoWealth Management, LLC | 4,026 | 19.32 | 103 | 21.43 | ||||
| 2025-07-17 | 13F | Beacon Capital Management, LLC | 603 | 356.82 | 15 | 400.00 | ||||
| 2025-08-12 | 13F | Richard W. Paul & Associates, LLC | 7,767 | 96.38 | 198 | 98.99 | ||||
| 2025-07-22 | 13F | Valley National Advisers Inc | 554 | 0.00 | 0 | |||||
| 2025-07-22 | 13F | Global Assets Advisory, LLC | 174,966 | -52.18 | 4,432 | -50.83 | ||||
| 2025-08-08 | 13F | D'Orazio & Associates, Inc. | 24,388 | 0.00 | 621 | 1.31 | ||||
| 2025-08-14 | 13F | Fwl Investment Management, Llc | 79 | 102.56 | 2 | |||||
| 2025-08-06 | 13F | True Wealth Design, LLC | 275 | 0.00 | 7 | 16.67 | ||||
| 2025-08-01 | 13F | Advisory Alpha, LLC | 364,584 | 9.80 | 9,290 | 11.19 | ||||
| 2025-08-08 | 13F | Gts Securities Llc | 44,843 | -86.46 | 1,143 | -86.29 | ||||
| 2025-08-12 | 13F | Kensington Asset Management, LLC | 0 | -100.00 | 0 | |||||
| 2025-07-24 | 13F | Us Bancorp \de\ | 35,697 | 7.46 | 910 | 8.86 | ||||
| 2025-08-11 | 13F | Nomura Asset Management Co Ltd | 453,944 | 0.00 | 11,566 | 1.27 | ||||
| 2025-07-17 | 13F | Sound Income Strategies, LLC | 232,833 | -1.79 | 5,933 | -0.55 | ||||
| 2025-08-12 | 13F | Waterloo Capital, L.P. | 327,608 | 4.48 | 8,347 | 5.81 | ||||
| 2025-07-21 | 13F | Ntv Asset Management Llc | 33,467 | 8.87 | 853 | 10.22 | ||||
| 2025-07-21 | 13F | Greenwood Capital Associates Llc | 0 | -100.00 | 0 | |||||
| 2025-07-22 | 13F | Merit Financial Group, LLC | 258,251 | -45.63 | 6,580 | -44.94 | ||||
| 2025-08-12 | 13F | Gladstone Institutional Advisory LLC | 71,368 | -16.72 | 1,818 | -15.68 | ||||
| 2025-08-13 | 13F/A | Claudia M.p. Batlle, Crp (r) Llc | 35,186 | 13.19 | 897 | 14.58 | ||||
| 2025-08-05 | 13F | Bank Of Montreal /can/ | 122,935 | -9.71 | 3,132 | -8.55 | ||||
| 2025-05-29 | NP | TFAZX - TFA Tactical Income Fund Class I | 37,700 | 0.00 | 949 | -0.32 | ||||
| 2025-07-24 | 13F | Blair William & Co/il | 3,850 | 1.08 | 98 | 3.16 | ||||
| 2025-08-14 | 13F | Ausdal Financial Partners, Inc. | 13,758 | -20.56 | 351 | -19.54 | ||||
| 2025-07-29 | 13F | Calamos Wealth Management LLC | 31,201 | 5.73 | 795 | 7.14 | ||||
| 2025-08-11 | 13F | Nations Financial Group Inc, /ia/ /adv | 11,955 | -1.82 | 305 | -0.65 | ||||
| 2025-07-10 | 13F | Sunflower Bank, N.A. | 78,082 | 1.64 | 1,990 | 2.95 | ||||
| 2025-08-14 | 13F | UBS Group AG | 1,274,678 | 9.48 | 32,479 | 10.88 | ||||
| 2025-08-14 | 13F | CoreCap Advisors, LLC | 3,039 | -7.29 | 77 | -6.10 | ||||
| 2025-05-20 | 13F | Ilmarinen Mutual Pension Insurance Co | 0 | -100.00 | 0 | |||||
| 2025-08-12 | 13F | BlackRock, Inc. | 1 | 0 | ||||||
| 2025-07-30 | 13F | Whittier Trust Co Of Nevada Inc | 4,195 | -12.60 | 107 | -11.67 | ||||
| 2025-08-11 | 13F | Citigroup Inc | 2,947 | -1.57 | 75 | 0.00 | ||||
| 2025-08-04 | 13F | Horizon Wealth Management, LLC | 28,141 | -98.99 | 717 | -98.97 | ||||
| 2025-08-08 | 13F | Pnc Financial Services Group, Inc. | 999 | -97.77 | 25 | -97.78 | ||||
| 2025-04-22 | 13F | Castleview Partners, Llc | 0 | -100.00 | 0 | |||||
| 2025-07-08 | 13F | Nbc Securities, Inc. | 18,494 | -3.47 | 0 | |||||
| 2025-07-02 | 13F | Capital Market Strategies LLC | 13,084 | -16.04 | 333 | -15.05 | ||||
| 2025-05-12 | 13F | Avos Capital Management, LLC | 0 | -100.00 | 0 | |||||
| 2025-08-12 | 13F | Deutsche Bank Ag\ | 450,000 | 100.00 | 11,466 | 102.54 | ||||
| 2025-08-12 | 13F | CIBC Private Wealth Group, LLC | 3,017 | 0.17 | 77 | 5.56 | ||||
| 2025-07-17 | 13F | Janney Montgomery Scott LLC | 453,004 | 18.69 | 12 | 22.22 | ||||
| 2025-07-30 | 13F | TFB Advisors LLC | 12,908 | 45.82 | 329 | 47.75 | ||||
| 2025-04-22 | 13F | Bright Futures Wealth Management, LLC. | 25,701 | 37.18 | 632 | 31.94 | ||||
| 2025-08-06 | 13F | Adviser Investments LLC | 42,290 | -7.20 | 1,078 | -6.02 | ||||
| 2025-08-13 | 13F | Baker Avenue Asset Management, LP | 224,693 | -1.36 | 5,725 | -0.10 | ||||
| 2025-04-07 | 13F | GoalVest Advisory LLC | 0 | -100.00 | 0 | |||||
| 2025-08-14 | 13F | Cardiff Park Advisors, Llc | 52,095 | 1.08 | 1,327 | 2.39 | ||||
| 2025-08-13 | 13F | IAG Wealth Partners, LLC | 47,153 | -11.05 | 1,201 | -9.90 | ||||
| 2025-08-25 | 13F/A | Neuberger Berman Group LLC | 3,785,155 | 0.75 | 96,446 | 2.03 | ||||
| 2025-07-28 | NP | SSTHX - Wells Fargo Short-Term High Yield Bond Fund Class A | 868,026 | 114.33 | 21,900 | 110.90 | ||||
| 2025-07-10 | 13F | Farmers & Merchants Trust Co of Chambersburg PA | 280,784 | 11.37 | 7 | 16.67 | ||||
| 2025-07-22 | 13F | DAVENPORT & Co LLC | 540,980 | 5.02 | 13,784 | 6.36 | ||||
| 2025-08-15 | 13F | Kestra Advisory Services, LLC | 223,158 | -0.35 | 5,686 | 0.92 | ||||
| 2025-08-12 | 13F | LPL Financial LLC | 4,698,364 | 1.86 | 119,714 | 3.15 | ||||
| 2025-08-14 | 13F | Visionary Wealth Advisors | 151,798 | -1.21 | 3,868 | 0.05 | ||||
| 2025-05-15 | 13F | Keel Point, LLC | 0 | -100.00 | 0 | |||||
| 2025-07-03 | 13F | Garde Capital, Inc. | 2,525 | 0.00 | 64 | 1.59 | ||||
| 2025-08-15 | 13F | CI Private Wealth, LLC | 148,170 | 988.21 | 3,775 | 1,003.80 | ||||
| 2025-07-14 | 13F | Sowell Financial Services LLC | 79,495 | -3.16 | 2,026 | -1.94 | ||||
| 2025-08-12 | 13F | American Century Companies Inc | 44,700 | 0.00 | 1,139 | 1.25 | ||||
| 2025-07-17 | 13F | Fifth Third Securities, Inc. | 247,122 | 1.48 | 6,297 | 2.76 | ||||
| 2025-07-28 | 13F | Ritholtz Wealth Management | 9,946 | 253 | ||||||
| 2025-08-05 | 13F | Huntington National Bank | 0 | -100.00 | ||||||
| 2025-08-12 | 13F | MAI Capital Management | 9,319 | -4.00 | 237 | -2.87 | ||||
| 2025-07-31 | 13F | Hobart Private Capital, LLC | 38,247 | 0.26 | 975 | 1.56 | ||||
| 2025-07-30 | 13F | Covenant Partners, LLC | 7,239 | -2.52 | 184 | -1.08 | ||||
| 2025-07-31 | 13F | Cabot Wealth Management Inc | 175,881 | 4,481 | ||||||
| 2025-08-11 | 13F | Principal Securities, Inc. | 45,910 | -14.67 | 1,170 | -13.92 | ||||
| 2025-08-13 | 13F | AMJ Financial Wealth Management | 0 | -100.00 | 0 | |||||
| 2025-07-18 | 13F | Dogwood Wealth Management LLC | 2 | 0.00 | 0 | |||||
| 2025-07-23 | 13F | Friedenthal Financial | 11,712 | 3.71 | 298 | 4.93 | ||||
| 2025-08-13 | 13F | StoneX Group Inc. | 0 | -100.00 | 0 | -100.00 | ||||
| 2025-08-12 | 13F | XTX Topco Ltd | 9,733 | 248 | ||||||
| 2025-05-16 | 13F/A | Kestra Investment Management, LLC | 0 | -100.00 | 0 | |||||
| 2025-07-16 | 13F | Brown, Lisle/cummings, Inc. | 5,439 | -2.47 | 139 | -1.43 | ||||
| 2025-08-07 | 13F | 49 Wealth Management, Llc | 0 | -100.00 | 0 | |||||
| 2025-08-13 | 13F | Echo45 Advisors LLC | 330,441 | -0.15 | 8,420 | 1.12 | ||||
| 2025-08-04 | 13F | Great Lakes Retirement, Inc. | 0 | -100.00 | 0 | |||||
| 2025-08-29 | 13F | Centaurus Financial, Inc. | 125,313 | -29.66 | 3 | -25.00 | ||||
| 2025-08-14 | 13F | Arete Wealth Advisors, LLC | 21,420 | 5.57 | 1 | |||||
| 2025-07-25 | 13F | Envestnet Portfolio Solutions, Inc. | 34,911 | -18.63 | 890 | -17.61 | ||||
| 2025-07-22 | 13F | Berkshire Money Management, Inc. | 1,633,614 | -2.06 | 41,624 | -0.82 | ||||
| 2025-08-05 | 13F | Tsfg, Llc | 636 | -23.19 | 0 | |||||
| 2025-07-29 | 13F | Angeles Wealth Management, Llc | 781,264 | 0.70 | 19,907 | 1.98 | ||||
| 2025-07-25 | 13F | Apollon Wealth Management, LLC | 23,193 | -2.08 | 591 | -0.84 | ||||
| 2025-08-13 | 13F | Generation Capital Management LLC | 103,150 | 21.96 | 2,628 | 23.55 | ||||
| 2025-08-12 | 13F | Cumberland Partners Ltd | 11,640 | 7.13 | 297 | 8.42 | ||||
| 2025-08-05 | 13F | Key FInancial Inc | 20 | 0.00 | 1 | |||||
| 2025-07-31 | 13F | Oppenheimer Asset Management Inc. | 176,171 | 16.88 | 4,489 | 18.35 | ||||
| 2025-07-03 | 13F | Fiduciary Financial Group, Llc | 46,777 | 9.23 | 1,185 | 13.63 | ||||
| 2025-08-11 | 13F | Wbi Investments, Inc. | 13,870 | 53.01 | 353 | 54.82 | ||||
| 2025-08-14 | 13F | Dimension Capital Management Llc | 22,870 | -34.63 | 583 | -33.86 | ||||
| 2025-08-14 | 13F | Mml Investors Services, Llc | 159,082 | -24.08 | 4 | -20.00 | ||||
| 2025-04-25 | 13F | Albion Financial Group /ut | 0 | -100.00 | 0 | |||||
| 2025-08-07 | 13F | LFA - Lugano Financial Advisors SA | 113,950 | -0.84 | 2,869 | -0.76 | ||||
| 2025-07-15 | 13F | Td Private Client Wealth Llc | 126,204 | 5.47 | 3,216 | 6.81 | ||||
| 2025-07-22 | 13F | Olistico Wealth, LLC | 0 | -100.00 | 0 | |||||
| 2025-07-29 | 13F | Dumont & Blake Investment Advisors Llc | 77,233 | -0.19 | 1,968 | 1.08 | ||||
| 2025-08-01 | 13F | Ashton Thomas Private Wealth, LLC | 18,226 | 85.28 | 464 | 87.85 | ||||
| 2025-07-31 | 13F | Burke & Herbert Bank & Trust Co | 37,543 | 0.00 | 957 | 1.27 | ||||
| 2025-08-12 | 13F | Lionshead Wealth Management, LLC | 98,262 | 22.66 | 2,504 | 24.22 | ||||
| 2025-08-14 | 13F | Fmr Llc | 1,429 | -66.15 | 36 | -66.04 | ||||
| 2025-08-14 | 13F | Atomi Financial Group, Inc. | 8,201 | 209 | ||||||
| 2025-08-14 | 13F | Pacific Asset Management LLC | 1,381,734 | -9.80 | 35,207 | -8.66 |
Other Listings
| MX:SJNK |