Mga Batayang Estadistika
| Pemilik Institusional | 251 total, 251 long only, 0 short only, 0 long/short - change of 0.40% MRQ |
| Alokasi Portofolio Rata-rata | 0.4730 % - change of -10.99% MRQ |
| Saham Institusional (Jangka Panjang) | 48,759,114 (ex 13D/G) - change of -1.50MM shares -2.98% MRQ |
| Nilai Institusional (Jangka Panjang) | $ 2,833,802 USD ($1000) |
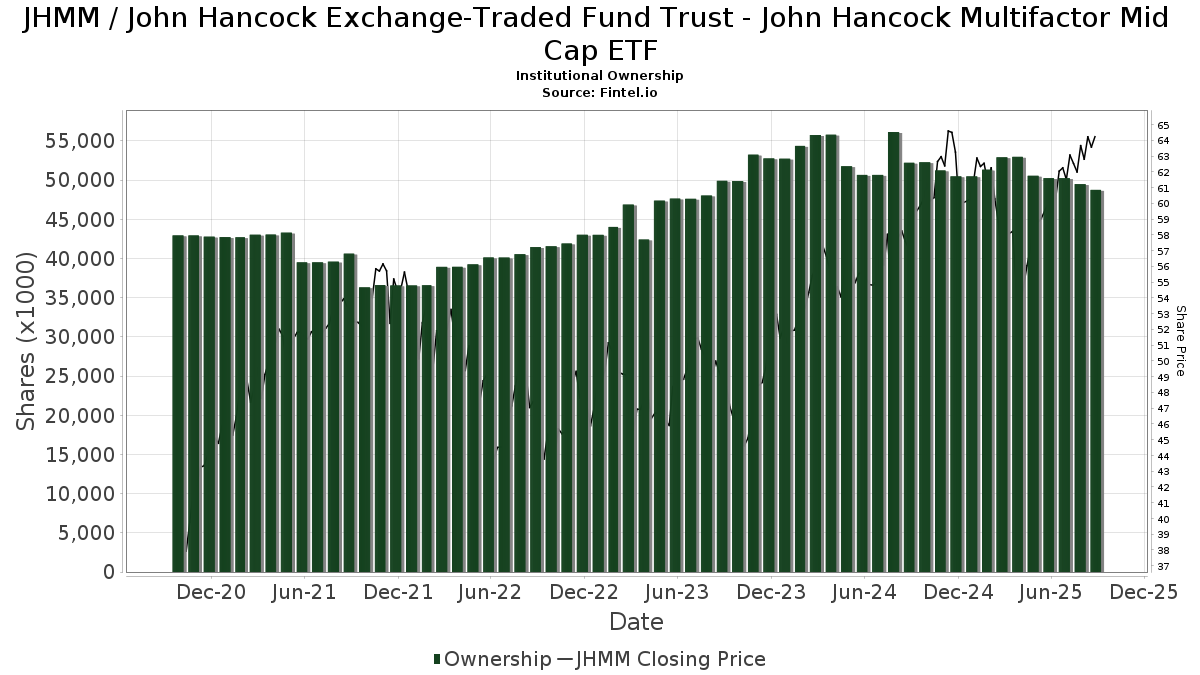
Kepemilikan Institusional dan Pemegang Saham
John Hancock Exchange-Traded Fund Trust - John Hancock Multifactor Mid Cap ETF (US:JHMM) memiliki 251 pemilik institusional dan pemegang saham yang telah mengajukan formulir 13D/G atau 13F kepada Komisi Bursa Efek (Securities Exchange Commission/SEC). Lembaga-lembaga ini memegang total 48,759,114 saham. Pemegang saham terbesar meliputi Ameriprise Financial Inc, LPL Financial LLC, Wells Fargo & Company/mn, Manufacturers Life Insurance Company, The, Morgan Stanley, Raymond James Financial Inc, UBS Group AG, JAIZX - Managed Volatility Growth Portfolio NAV, Commonwealth Equity Services, Llc, and Northwestern Mutual Wealth Management Co .
Struktur kepemilikan institusional John Hancock Exchange-Traded Fund Trust - John Hancock Multifactor Mid Cap ETF (ARCA:JHMM) menunjukkan posisi terkini di perusahaan oleh institusi dan dana, serta perubahan terbaru dalam ukuran posisi. Pemegang saham utama dapat mencakup investor individu, reksa dana, dana lindung nilai, atau institusi. Jadwal 13D menunjukkan bahwa investor memegang (atau pernah memegang) lebih dari 5% saham perusahaan dan bermaksud (atau pernah bermaksud) untuk secara aktif mengejar perubahan strategi bisnis. Jadwal 13G menunjukkan investasi pasif lebih dari 5%.
The share price as of September 5, 2025 is 64.50 / share. Previously, on September 6, 2024, the share price was 56.50 / share. This represents an increase of 14.16% over that period.
Skor Sentimen Dana
Skor Sentimen Dana (sebelumnya dikenal sebagai Skor Akumulasi Kepemilikan) menemukan saham-saham yang paling banyak dibeli oleh dana. Ini adalah hasil dari model kuantitatif multi-faktor yang canggih yang mengidentifikasi perusahaan dengan tingkat akumulasi institusional tertinggi. Model penilaian menggunakan kombinasi dari total peningkatan pemilik yang diungkapkan, perubahan dalam alokasi portofolio pada pemilik tersebut, dan metrik lainnya. Angka berkisar dari 0 hingga 100, dengan angka yang lebih tinggi menunjukkan tingkat akumulasi yang lebih tinggi dibandingkan dengan perusahaan sejenisnya, dan 50 adalah rata-ratanya.
Frekuensi Pembaruan: Setiap Hari
Lihat Ownership Explorer, yang menyediakan daftar perusahaan dengan peringkat tertinggi.
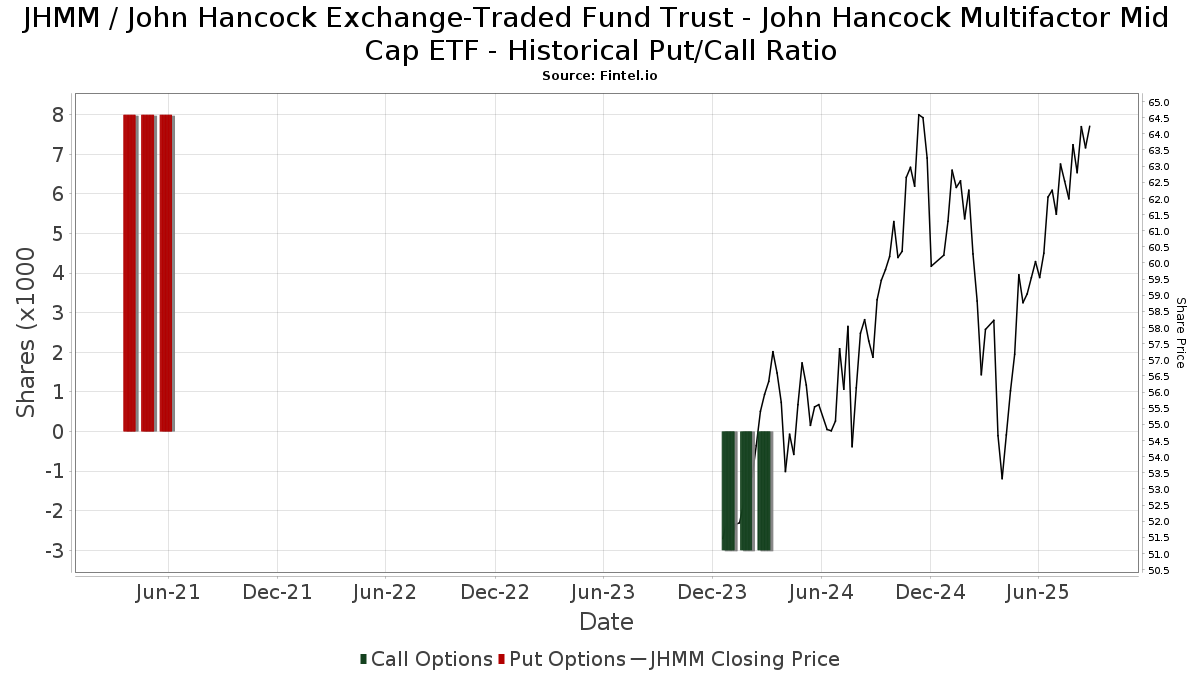
Rasio Put/Call Institusional
Selain melaporkan isu ekuitas dan utang standar, institusi dengan aset di bawah manajemen lebih dari 100 juta dolar AS juga harus mengungkapkan kepemilikan opsi put dan call mereka. Karena opsi put umumnya menunjukkan sentimen negatif, dan opsi call menunjukkan sentimen positif, kita dapat mengetahui sentimen institusional secara keseluruhan dengan memplot rasio put terhadap call. Grafik di sebelah kanan memplot rasio put/call historis untuk instrumen ini.
Menggunakan Rasio Put/Call sebagai indikator sentimen investor mengatasi salah satu kekurangan utama dari penggunaan total kepemilikan institusional, yaitu sejumlah besar aset yang dikelola diinvestasikan secara pasif untuk melacak indeks. Dana yang dikelola secara pasif biasanya tidak membeli opsi, sehingga indikator rasio put/call lebih akurat dalam melacak sentimen dana yang dikelola secara aktif.
Pengajuan 13F dan NPORT
Detail pada pengajuan 13F tersedia gratis. Detail pada pengajuan NP memerlukan keanggotaan premium. Baris berwarna hijau menunjukkan posisi baru. Baris berwarna merah menunjukkan posisi yang sudah ditutup. Klik tautan ini ikon untuk melihat riwayat transaksi selengkapnya.
Tingkatkan
untuk membuka data premium dan mengekspor ke Excel ![]() .
.
| Tanggal File | Sumber | Investor | Ketik | Presyo ng Avg (Silangan) |
Saham | Δ Saham (%) |
Dilaporkan Nilai ($1000) |
Nilai Δ (%) |
Alokasi Port (%) |
|
|---|---|---|---|---|---|---|---|---|---|---|
| 2025-07-08 | 13F | Choice Wealth Advisors, LLC | 198,734 | -0.37 | 12,149 | 6.29 | ||||
| 2025-07-29 | 13F | Chicago Partners Investment Group LLC | 60,643 | 10.24 | 3,824 | 21.63 | ||||
| 2025-07-25 | 13F | Sovereign Financial Group, Inc. | 13,481 | 0.00 | 824 | 6.74 | ||||
| 2025-08-12 | 13F/A | Cozad Asset Management Inc | 8,860 | 0.00 | 542 | 6.71 | ||||
| 2025-08-14 | 13F | Manufacturers Life Insurance Company, The | 3,163,181 | -4.63 | 193,365 | 1.74 | ||||
| 2025-08-06 | 13F | Vantage Financial Partners, LLC | 13,665 | 0.79 | 835 | 7.60 | ||||
| 2025-08-14 | 13F | Comerica Bank | 23,288 | -26.51 | 1,424 | -21.60 | ||||
| 2025-07-21 | 13F | Synergy Financial Management, LLC | 6,256 | 0.00 | 382 | 6.70 | ||||
| 2025-08-07 | 13F | Rossmore Private Capital | 15,421 | 0.00 | 943 | 6.68 | ||||
| 2025-07-14 | 13F | Farmers & Merchants Investments Inc | 105 | 0.00 | 6 | 0.00 | ||||
| 2025-08-12 | 13F | PSI Advisors, LLC | 0 | -100.00 | 0 | |||||
| 2025-07-23 | 13F | Indiana Trust & Investment Management CO | 0 | -100.00 | 0 | |||||
| 2025-08-19 | 13F | Anchor Investment Management, LLC | 385 | 0.00 | 24 | 4.55 | ||||
| 2025-07-23 | 13F | SpringVest Wealth Management LLC | 21,379 | -15.85 | 1,307 | -10.24 | ||||
| 2025-08-12 | 13F | AlphaCore Capital LLC | 83,280 | -0.12 | 5,091 | 6.55 | ||||
| 2025-07-28 | 13F | Private Wealth Asset Management, LLC | 1,143 | 7.12 | 70 | 13.11 | ||||
| 2025-07-17 | 13F | Coastline Trust Co | 9,929 | 0.00 | 607 | 6.69 | ||||
| 2025-07-18 | 13F | Truist Financial Corp | 48,117 | -85.93 | 2,941 | -84.99 | ||||
| 2025-08-14 | 13F | Royal Bank Of Canada | 1,497,555 | 0.96 | 91,546 | 7.71 | ||||
| 2025-08-08 | 13F | Intrua Financial, LLC | 0 | -100.00 | 0 | |||||
| 2025-07-22 | 13F | Mascoma Wealth Management LLC | 346 | 0.00 | 21 | 10.53 | ||||
| 2025-08-04 | 13F | Arkadios Wealth Advisors | 48,786 | 4.21 | 2,982 | 11.19 | ||||
| 2025-08-08 | 13F | Larson Financial Group LLC | 73,708 | -73.74 | 4,506 | -71.99 | ||||
| 2025-07-14 | 13F | Bank & Trust Co | 1,188 | 0.00 | 73 | 5.88 | ||||
| 2025-08-14 | 13F | Benjamin Edwards Inc | 18,800 | 11.90 | 1,149 | 19.44 | ||||
| 2025-08-29 | 13F | Evolution Wealth Management Inc. | 1,000 | 61 | ||||||
| 2025-08-13 | 13F | Flow Traders U.s. Llc | 0 | -100.00 | 0 | |||||
| 2025-07-18 | 13F | SigFig Wealth Management, LLC | 12,521 | -1.11 | 762 | 5.69 | ||||
| 2025-08-14 | 13F | Bank Of America Corp /de/ | 938,551 | 2.75 | 57,374 | 9.62 | ||||
| 2025-08-14 | 13F | Paragon Private Wealth Management, LLC | 33,872 | -7.35 | 2,071 | -1.15 | ||||
| 2025-08-05 | 13F | Plante Moran Financial Advisors, LLC | 0 | -100.00 | 0 | |||||
| 2025-04-29 | 13F | Resources Investment Advisors, LLC. | 0 | -100.00 | 0 | |||||
| 2025-08-14 | 13F | Synovus Financial Corp | 253,345 | -3.79 | 15,493 | 2.68 | ||||
| 2025-07-09 | 13F | WealthCare Investment Partners, LLC | 0 | -100.00 | 0 | |||||
| 2025-07-09 | 13F | VisionPoint Advisory Group, LLC | 3,722 | 228 | ||||||
| 2025-08-01 | 13F | Envestnet Asset Management Inc | 344,941 | -44.34 | 21,086 | -40.62 | ||||
| 2025-07-15 | 13F | Avaii Wealth Management, Llc | 21,411 | -2.40 | 1,309 | 4.06 | ||||
| 2025-08-06 | 13F | 360 Financial, Inc. | 5,206 | 0.00 | 318 | 6.71 | ||||
| 2025-08-05 | 13F | Gilbert & Cook, Inc. | 927,280 | 7.87 | 56,685 | 15.08 | ||||
| 2025-05-05 | 13F | PCA Investment Advisory Services Inc. | 0 | -100.00 | 0 | |||||
| 2025-08-04 | 13F | Assetmark, Inc | 7,697 | -5.63 | 471 | 0.64 | ||||
| 2025-07-07 | 13F | Investors Research Corp | 536 | 0.00 | 33 | 6.67 | ||||
| 2025-08-08 | 13F | Kingsview Wealth Management, LLC | 45,175 | 35.50 | 2,762 | 44.55 | ||||
| 2025-08-14 | 13F | TCG Advisory Services, LLC | 0 | -100.00 | 0 | |||||
| 2025-08-05 | 13F | GPS Wealth Strategies Group, LLC | 660 | -55.44 | 40 | -52.38 | ||||
| 2025-08-13 | 13F | Jones Financial Companies Lllp | 1,112,603 | 39.69 | 67,724 | 49.30 | ||||
| 2025-05-14 | 13F | WCG Wealth Advisors LLC | 0 | -100.00 | 0 | |||||
| 2025-08-05 | 13F | Westside Investment Management, Inc. | 107 | 0.00 | 7 | 0.00 | ||||
| 2025-07-08 | 13F | Baker Ellis Asset Management LLC | 205,511 | -1.46 | 12,563 | 5.12 | ||||
| 2025-07-30 | 13F/A | KPP Advisory Services LLC | 266,086 | 10.89 | 16,266 | 18.31 | ||||
| 2025-08-12 | 13F | Jpmorgan Chase & Co | 52,814 | 16.90 | 3,229 | 24.73 | ||||
| 2025-07-30 | 13F | D.a. Davidson & Co. | 32,850 | -3.74 | 2,008 | 2.71 | ||||
| 2025-08-11 | 13F | Forge Financial Services LLC | 95,417 | 2.15 | 5,841 | 9.12 | ||||
| 2025-07-31 | 13F/A | Interchange Capital Partners, LLC | 34,617 | 16.13 | 2,116 | 23.89 | ||||
| 2025-07-22 | 13F | Chung Wu Investment Group, LLC | 366 | 22 | ||||||
| 2025-08-06 | 13F | Hoxton Planning & Management, LLC | 3,748 | 0.00 | 229 | 7.01 | ||||
| 2025-08-05 | 13F | Frederick Financial Consultants, LLC | 54,862 | 7.01 | 3,354 | 14.16 | ||||
| 2025-05-02 | 13F | Transcendent Capital Group LLC | 0 | -100.00 | 0 | |||||
| 2025-07-16 | 13F | BankPlus Wealth Management LLC | 27,146 | 8.87 | 1,659 | 16.18 | ||||
| 2025-07-22 | 13F | DAVENPORT & Co LLC | 42,577 | 16.23 | 2,603 | 24.02 | ||||
| 2025-07-23 | 13F | Bellevue Asset Management, Llc | 729 | 0.00 | 45 | 7.32 | ||||
| 2025-07-15 | 13F | Fifth Third Bancorp | 1,525 | 0.00 | 93 | 6.90 | ||||
| 2025-08-11 | 13F | Private Advisor Group, LLC | 1,075,550 | -4.48 | 65,748 | 1.90 | ||||
| 2025-08-13 | 13F | Cresset Asset Management, LLC | 4,876 | 0.00 | 298 | 6.81 | ||||
| 2025-08-14 | 13F | Keystone Financial Services, LLC | 43,635 | -2.73 | 2,667 | 3.77 | ||||
| 2025-08-11 | 13F | Principal Securities, Inc. | 1,300 | 0.00 | 79 | 2.60 | ||||
| 2025-08-15 | 13F | Tower Research Capital LLC (TRC) | 12,233 | -8.80 | 748 | -2.73 | ||||
| 2025-08-05 | 13F | Atlas Wealth LLC | 59,467 | -9.28 | 3,669 | -2.34 | ||||
| 2025-07-16 | 13F | Stephenson National Bank & Trust | 466 | 13.11 | 28 | 21.74 | ||||
| 2025-07-30 | 13F | Crewe Advisors LLC | 965 | 0.00 | 59 | 5.45 | ||||
| 2025-08-13 | 13F | Renaissance Technologies Llc | 20,600 | -5.19 | 1,259 | 1.21 | ||||
| 2025-07-22 | 13F | Simplicity Wealth,LLC | 69,144 | 289.74 | 4,227 | 315.94 | ||||
| 2025-08-29 | NP | JAIYX - Managed Volatility Balanced Portfolio NAV | 1,039,862 | -3.63 | 63,567 | 2.81 | ||||
| 2025-07-30 | 13F | Eqis Capital Management, Inc. | 56,994 | -5.69 | 3,484 | 0.64 | ||||
| 2025-08-13 | 13F | MONECO Advisors, LLC | 26,422 | 0.09 | 1,615 | 6.81 | ||||
| 2025-08-12 | 13F | Private Management Group Inc | 3,404 | 208 | ||||||
| 2025-08-14 | 13F | Citadel Advisors Llc | 28,433 | 196.05 | 1,738 | 216.00 | ||||
| 2025-07-24 | 13F | Capital Advisors, Ltd. LLC | 57,885 | 0.01 | 4 | 0.00 | ||||
| 2025-05-02 | 13F | Graypoint LLC | 0 | -100.00 | 0 | -100.00 | ||||
| 2025-08-14 | 13F | Goodwin Investment Advisory | 7,154 | 437 | ||||||
| 2025-08-05 | 13F | Sigma Planning Corp | 4,362 | 267 | ||||||
| 2025-08-08 | 13F | Good Life Advisors, LLC | 35,267 | -25.20 | 2,156 | -20.21 | ||||
| 2025-09-04 | 13F/A | Advisor Group Holdings, Inc. | 245,736 | -2.60 | 15,025 | 3.91 | ||||
| 2025-08-14 | 13F | Fwl Investment Management, Llc | 0 | -100.00 | 0 | |||||
| 2025-07-18 | 13F | Foundry Financial Group, Inc. | 5,451 | -94.17 | 333 | -93.78 | ||||
| 2025-08-14 | 13F | Mercer Global Advisors Inc /adv | 20,730 | 3.41 | 1,267 | 10.37 | ||||
| 2025-04-23 | 13F | GHP Investment Advisors, Inc. | 0 | -100.00 | 0 | |||||
| 2025-08-11 | 13F | WPG Advisers, LLC | 58,047 | -2.97 | 3,548 | 3.53 | ||||
| 2025-07-25 | 13F | Priebe Wealth Holdings LLC | 3,353 | 205 | ||||||
| 2025-08-08 | 13F | Thoroughbred Financial Services, Llc | 0 | -100.00 | 0 | |||||
| 2025-07-08 | 13F | Zrc Wealth Management, Llc | 30,834 | 34.00 | 1,885 | 42.94 | ||||
| 2025-08-14 | 13F | Visionary Wealth Advisors | 8,770 | 31.70 | 536 | 40.68 | ||||
| 2025-08-14 | 13F | Graney & King, LLC | 65,944 | 9.35 | 4,031 | 16.67 | ||||
| 2025-07-15 | 13F | Signet Financial Management, Llc | 5,891 | -29.77 | 360 | -25.00 | ||||
| 2025-07-29 | 13F | Liberty Square Wealth Partners Llc | 18,013 | -3.28 | 1,101 | 3.19 | ||||
| 2025-08-12 | 13F | Weaver Consulting Group | 5,828 | 0.00 | 356 | 6.91 | ||||
| 2025-08-15 | 13F | Captrust Financial Advisors | 94,785 | -3.93 | 5,794 | 2.49 | ||||
| 2025-04-22 | 13F | Castleview Partners, Llc | 0 | -100.00 | 0 | |||||
| 2025-07-25 | 13F | Cwm, Llc | 7,666 | 1.78 | 0 | |||||
| 2025-08-06 | 13F | Golden State Wealth Management, LLC | 391 | -34.06 | 24 | -30.30 | ||||
| 2025-07-15 | 13F | Financial Management Professionals, Inc. | 870,301 | 4.73 | 53,200 | 11.73 | ||||
| 2025-08-19 | 13F | Advisory Services Network, LLC | 7,433 | 463 | ||||||
| 2025-08-12 | 13F | Waterloo Capital, L.P. | 18,067 | -24.48 | 1,104 | -19.42 | ||||
| 2025-07-02 | 13F | Dentgroup LLC | 0 | -100.00 | 0 | |||||
| 2025-07-18 | 13F | Cooper Financial Group | 32,247 | -3.02 | 1,971 | 3.46 | ||||
| 2025-07-23 | 13F | Valmark Advisers, Inc. | 38,474 | 2.17 | 2,352 | 8.99 | ||||
| 2025-07-09 | 13F | Fragasso Group Inc. | 100,717 | -6.70 | 6,157 | -0.47 | ||||
| 2025-07-21 | 13F | Future Financial Wealth Managment LLC | 333 | 0.00 | 20 | 5.26 | ||||
| 2025-08-05 | 13F | Tme Financial, Inc. | 29,572 | -71.73 | 1,808 | -69.85 | ||||
| 2025-07-17 | 13F | Elwood & Goetz Wealth Advisory Group, LLC | 4,745 | 290 | ||||||
| 2025-08-14 | 13F | Betterment LLC | 22,036 | 0.97 | 1 | 0.00 | ||||
| 2025-07-29 | 13F | Stratos Wealth Partners, LTD. | 225,739 | 2.16 | 13,799 | 8.99 | ||||
| 2025-08-06 | 13F | Rialto Wealth Management, LLC | 1,175 | 0.00 | 72 | 5.97 | ||||
| 2025-08-12 | 13F | Eldridge Investment Advisors, Inc. | 174,565 | -5.98 | 10,671 | 0.30 | ||||
| 2025-07-15 | 13F | SJS Investment Consulting Inc. | 1,402 | 0.00 | 86 | 6.25 | ||||
| 2025-08-13 | 13F | Russell Investments Group, Ltd. | 184 | 62.83 | 11 | 83.33 | ||||
| 2025-07-09 | 13F | Dynamic Advisor Solutions LLC | 422,933 | 2.14 | 25,854 | 8.96 | ||||
| 2025-08-05 | 13F | Huntington National Bank | 14 | -77.97 | ||||||
| 2025-07-17 | 13F | HB Wealth Management, LLC | 10,439 | -5.52 | 638 | 0.79 | ||||
| 2025-07-24 | 13F | Jfs Wealth Advisors, Llc | 818 | 0.49 | 50 | 6.52 | ||||
| 2025-05-12 | 13F | Independent Advisor Alliance | 0 | -100.00 | 0 | |||||
| 2025-07-15 | 13F | Well Done, LLC | 0 | -100.00 | 0 | |||||
| 2025-08-05 | 13F | Simplex Trading, Llc | 84 | 0 | ||||||
| 2025-05-05 | 13F | Csenge Advisory Group | 0 | -100.00 | 0 | |||||
| 2025-07-23 | 13F | BankPlus Trust Department | 126,051 | -0.03 | 7,705 | 6.66 | ||||
| 2025-07-16 | 13F | ORG Partners LLC | 3,365 | 300.12 | 208 | 331.25 | ||||
| 2025-04-29 | 13F | Lee Danner & Bass Inc | 0 | -100.00 | 0 | |||||
| 2025-05-15 | 13F | Human Investing LLC | 0 | -100.00 | 0 | |||||
| 2025-08-13 | 13F | Beacon Pointe Advisors, LLC | 13,067 | 31.74 | 799 | 40.49 | ||||
| 2025-08-12 | 13F | Cornerstone Wealth Management, LLC | 15,405 | -8.62 | 942 | -2.49 | ||||
| 2025-08-12 | 13F | Steward Partners Investment Advisory, Llc | 24,037 | -0.33 | 1,469 | 6.37 | ||||
| 2025-08-07 | 13F | PFG Advisors | 82,217 | 10.93 | 5,026 | 18.35 | ||||
| 2025-08-14 | 13F | GWM Advisors LLC | 136,398 | 99.67 | 8,338 | 113.03 | ||||
| 2025-07-17 | 13F | Nelson, Van Denburg & Campbell Wealth Management Group, LLC | 4,224 | -6.78 | 258 | -0.39 | ||||
| 2025-07-18 | 13F | Wetzel Investment Advisors, Inc. | 41,995 | 2,567 | ||||||
| 2025-08-11 | 13F | Perennial Investment Advisors, LLC | 5,411 | 0.00 | 331 | 6.45 | ||||
| 2025-08-14 | 13F | Palo Alto Wealth Advisors, Llc | 120,372 | -31.41 | 7,358 | -30.04 | ||||
| 2025-08-13 | 13F | Congress Wealth Management LLC / DE / | 15,971 | 113.57 | 976 | 127.51 | ||||
| 2025-08-12 | 13F | BlackRock, Inc. | 598 | 0.00 | 37 | 5.88 | ||||
| 2025-07-29 | 13F | Harbor Asset Planning, Inc. | 10,064 | 615 | ||||||
| 2025-08-29 | NP | JAIZX - Managed Volatility Growth Portfolio NAV | 1,889,229 | -5.43 | 115,489 | 0.89 | ||||
| 2025-08-13 | 13F | Summit Wealth Group Llc / Co | 30,775 | 1,881 | ||||||
| 2025-07-21 | 13F | Ameriflex Group, Inc. | 1,057 | -53.58 | 64 | -50.77 | ||||
| 2025-08-12 | 13F | MAI Capital Management | 200 | 0.00 | 12 | 9.09 | ||||
| 2025-08-11 | 13F | Advisor Resource Council | 0 | -100.00 | 0 | |||||
| 2025-08-26 | 13F/A | Thrivent Financial For Lutherans | 31,104 | -95.14 | 2 | -97.50 | ||||
| 2025-08-12 | 13F | Proequities, Inc. | 0 | 0 | ||||||
| 2025-07-17 | 13F | City Holding Co | 1,970 | 0.00 | 120 | 7.14 | ||||
| 2025-08-12 | 13F | FreeGulliver LLC | 19,751 | -11.79 | 1,207 | -5.85 | ||||
| 2025-07-29 | NP | EBI - Longview Advantage ETF | 0 | -100.00 | 0 | -100.00 | ||||
| 2025-08-04 | 13F | Bay Colony Advisory Group, Inc d/b/a Bay Colony Advisors | 16,179 | 7.54 | 989 | 15.42 | ||||
| 2025-08-14 | 13F | Ameriprise Financial Inc | 4,577,600 | -3.31 | 279,914 | 3.31 | ||||
| 2025-08-13 | 13F | IAG Wealth Partners, LLC | 48,648 | -31.38 | 2,974 | -26.81 | ||||
| 2025-05-01 | 13F | Bleakley Financial Group, LLC | 0 | -100.00 | 0 | |||||
| 2025-08-05 | 13F | Fourth Dimension Wealth, LLC | 702 | -12.47 | 43 | -6.67 | ||||
| 2025-08-14 | 13F | Integrated Wealth Concepts LLC | 190,115 | 1.76 | 11,622 | 8.56 | ||||
| 2025-08-12 | 13F | O'shaughnessy Asset Management, Llc | 7,799 | -5.08 | 477 | 1.28 | ||||
| 2025-07-17 | 13F | Janney Montgomery Scott LLC | 8,041 | 31.20 | 0 | |||||
| 2025-08-13 | 13F | Johnson Financial Group, Inc. | 67 | 0.00 | 4 | 33.33 | ||||
| 2025-08-14 | 13F | Wells Fargo & Company/mn | 3,560,730 | 1.07 | 217,667 | 7.82 | ||||
| 2025-08-04 | 13F | JDM Financial Group LLC | 213 | 0.00 | 13 | 8.33 | ||||
| 2025-08-18 | 13F | Geneos Wealth Management Inc. | 540 | 0.00 | 33 | 10.00 | ||||
| 2025-07-24 | 13F | Blair William & Co/il | 10,265 | 0.21 | 627 | 7.00 | ||||
| 2025-07-22 | 13F | D.B. Root & Company, LLC | 21,079 | -15.06 | 1,289 | -9.36 | ||||
| 2025-08-14 | 13F | UBS Group AG | 2,177,650 | 0.06 | 133,120 | 6.75 | ||||
| 2025-07-14 | 13F | Signature Securities Group Corporation | 45,950 | -3.27 | 2,809 | 3.20 | ||||
| 2025-05-06 | 13F | Greenwood Gearhart Inc | 0 | -100.00 | 0 | |||||
| 2025-07-30 | 13F | Onyx Bridge Wealth Group LLC | 38,533 | -18.41 | 2,356 | -12.97 | ||||
| 2025-08-06 | 13F | Prospera Financial Services Inc | 4,442 | 17.45 | 272 | 25.46 | ||||
| 2025-07-31 | 13F | Cambridge Investment Research Advisors, Inc. | 334,383 | -6.72 | 20 | 0.00 | ||||
| 2025-08-13 | 13F | Smith, Moore & Co. | 16,606 | 2.20 | 1,015 | 9.02 | ||||
| 2025-08-06 | 13F | Commonwealth Equity Services, Llc | 1,806,550 | -3.01 | 110 | 3.77 | ||||
| 2025-07-14 | 13F | Iams Wealth Management, Llc | 6,166 | -1.45 | 377 | 5.03 | ||||
| 2025-07-25 | 13F | Atria Wealth Solutions, Inc. | 87,275 | 33.61 | 5,432 | 45.16 | ||||
| 2025-05-16 | 13F | Coppell Advisory Solutions LLC | 0 | -100.00 | 0 | -100.00 | ||||
| 2025-08-07 | 13F | Allworth Financial LP | 7,683 | 0.09 | 470 | 9.58 | ||||
| 2025-07-17 | 13F | Raleigh Capital Management Inc. | 189 | 12 | ||||||
| 2025-07-24 | 13F | Ronald Blue Trust, Inc. | 459 | 0.44 | 28 | 7.69 | ||||
| 2025-08-14 | 13F | Stifel Financial Corp | 93,120 | -0.26 | 5,692 | 6.41 | ||||
| 2025-04-14 | 13F | NewSquare Capital LLC | 0 | 0 | ||||||
| 2025-08-14 | 13F | Mariner, LLC | 78,180 | -6.42 | 4,779 | -0.17 | ||||
| 2025-07-16 | 13F | Perigon Wealth Management, LLC | 24,382 | 5.74 | 1,490 | 12.79 | ||||
| 2025-08-14 | 13F | Two Sigma Securities, Llc | 6,517 | 2.15 | 398 | 9.04 | ||||
| 2025-07-24 | 13F | JNBA Financial Advisors | 32,694 | -0.39 | 1,999 | 6.28 | ||||
| 2025-08-04 | 13F | Amplius Wealth Advisors, LLC | 628,519 | 1.88 | 38,420 | 8.68 | ||||
| 2025-08-06 | 13F | Horan Securities, Inc. | 10,619 | 22.78 | 649 | 31.11 | ||||
| 2025-08-08 | 13F | Independence Financial Advisors, LLC | 7,960 | -2.13 | 487 | 4.29 | ||||
| 2025-07-14 | 13F | Enzi Wealth | 606,832 | -0.73 | 37,624 | 10.28 | ||||
| 2025-05-14 | 13F | Change Path, LLC | 0 | -100.00 | 0 | |||||
| 2025-08-14 | 13F | Sunbelt Securities, Inc. | 49 | 0.00 | 3 | 0.00 | ||||
| 2025-08-15 | 13F | Kestra Advisory Services, LLC | 124,613 | 15.57 | 7,618 | 23.29 | ||||
| 2025-07-29 | 13F | TFC Financial Management | 1,182 | 72 | ||||||
| 2025-08-13 | 13F | Cerity Partners LLC | 155,503 | 2,155.30 | 9,506 | 2,306.33 | ||||
| 2025-08-14 | 13F | Mml Investors Services, Llc | 5,422 | -15.44 | 0 | |||||
| 2025-07-28 | 13F | BRYN MAWR TRUST Co | 310 | 19 | ||||||
| 2025-07-16 | 13F | Magnus Financial Group LLC | 25,373 | -0.03 | 1,551 | 6.67 | ||||
| 2025-07-28 | 13F | Harbour Investments, Inc. | 2,331 | -21.22 | 142 | -15.98 | ||||
| 2025-07-31 | 13F/A | Avion Wealth | 58 | 0 | ||||||
| 2025-08-14 | 13F | CoreCap Advisors, LLC | 23,200 | 41.39 | 1,418 | 50.85 | ||||
| 2025-07-11 | 13F | Pinnacle Bancorp, Inc. | 2,456 | 0.00 | 150 | 7.14 | ||||
| 2025-08-18 | 13F | Tyler-Stone Wealth Management | 11,934 | 0.08 | 730 | 6.73 | ||||
| 2025-07-25 | 13F | Concurrent Investment Advisors, LLC | 33,690 | 30.03 | 2,059 | 38.75 | ||||
| 2025-07-25 | 13F | PrairieView Partners, LLC | 7 | 0 | ||||||
| 2025-08-04 | 13F | Creative Financial Designs Inc /adv | 32,582 | 1.20 | 1,992 | 7.97 | ||||
| 2025-07-22 | 13F | Valley National Advisers Inc | 400 | 0 | ||||||
| 2025-08-19 | 13F | Asset Dedication, LLC | 95 | 0.00 | 6 | 0.00 | ||||
| 2025-08-06 | 13F | AE Wealth Management LLC | 3,109 | 190 | ||||||
| 2025-08-14 | 13F | Susquehanna International Group, Llp | 15,716 | -46.15 | 961 | -42.58 | ||||
| 2025-08-06 | 13F | Wedbush Securities Inc | 3,580 | 0 | ||||||
| 2025-08-14 | 13F | Boston Private Wealth Llc | 0 | -100.00 | 0 | |||||
| 2025-08-12 | 13F | Garrett Wealth Advisory Group, LLC | 518,173 | 6.04 | 31,676 | 13.13 | ||||
| 2025-08-14 | 13F/A | Rockefeller Capital Management L.P. | 114,665 | -4.59 | 7,009 | 1.79 | ||||
| 2025-08-01 | 13F | Bessemer Group Inc | 5,354 | 0 | ||||||
| 2025-08-01 | 13F | Chilton Capital Management Llc | 125,118 | -5.03 | 7,648 | 1.32 | ||||
| 2025-08-14 | 13F | Wiley Bros.-aintree Capital, Llc | 126,322 | -19.32 | 7,719 | -13.43 | ||||
| 2025-07-21 | 13F | Patriot Financial Group Insurance Agency, LLC | 88,637 | -6.52 | 5,418 | -0.28 | ||||
| 2025-07-18 | 13F | Vicus Capital | 7,557 | 0.11 | 462 | 6.71 | ||||
| 2025-08-04 | 13F | Pensionmark Financial Group, Llc | 10,795 | 0.77 | 660 | 7.50 | ||||
| 2025-08-12 | 13F | Marshall & Sterling Wealth Advisors Inc. | 1,287 | 0.08 | 79 | 6.85 | ||||
| 2025-08-05 | 13F | Flynn Zito Capital Management, Llc | 61,709 | -3.79 | 3,772 | 2.64 | ||||
| 2025-08-08 | 13F | Symphony Financial Services, Inc. | 5,532 | 0.05 | 338 | 6.96 | ||||
| 2025-08-05 | 13F | EPG Wealth Management LLC | 8,676 | -12.28 | 530 | -6.36 | ||||
| 2025-08-12 | 13F | CIBC Private Wealth Group, LLC | 25 | 0.00 | 2 | 0.00 | ||||
| 2025-08-19 | 13F | MRP Capital Investments, LLC | 3,629 | 2.83 | 222 | 9.41 | ||||
| 2025-05-13 | 13F | Nations Financial Group Inc, /ia/ /adv | 0 | -100.00 | 0 | -100.00 | ||||
| 2025-08-14 | 13F | Sterling Wealth Management, Inc. | 5,440 | 0.00 | 333 | 2.47 | ||||
| 2025-08-08 | 13F | Adapt Wealth Advisors, Llc | 8,893 | -4.05 | 544 | 2.26 | ||||
| 2025-07-09 | 13F | Bank of New Hampshire | 368 | 0.00 | 22 | 4.76 | ||||
| 2025-08-01 | 13F | Transcend Wealth Collective, Llc | 0 | -100.00 | 0 | |||||
| 2025-08-14 | 13F | Great Valley Advisor Group, Inc. | 103,461 | -5.56 | 6,325 | 0.75 | ||||
| 2025-07-17 | 13F | Sound Income Strategies, LLC | 492 | 0.00 | 30 | 7.14 | ||||
| 2025-08-14 | 13F | Old Mission Capital Llc | 0 | -100.00 | 0 | |||||
| 2025-08-14 | 13F | Moneta Group Investment Advisors Llc | 9,708 | 24.25 | 593 | 32.66 | ||||
| 2025-05-01 | 13F | Smith Thornton Advisors LLC | 0 | -100.00 | 0 | |||||
| 2025-08-13 | 13F | Millstone Evans Group, LLC | 562 | 0.00 | 34 | 6.25 | ||||
| 2025-08-11 | 13F | HighTower Advisors, LLC | 20,411 | 326.74 | 1,248 | 355.11 | ||||
| 2025-07-22 | 13F | Grimes & Company, Inc. | 78,057 | -0.26 | 4,772 | 6.40 | ||||
| 2025-08-07 | 13F | Kestra Private Wealth Services, Llc | 102,866 | 18.63 | 6,288 | 26.57 | ||||
| 2025-08-13 | 13F | Legacy Capital Wealth Partners, LLC | 4,290 | 0.00 | 262 | 6.94 | ||||
| 2025-07-17 | 13F | ERn Financial, LLC | 57,401 | -73.70 | 3,509 | -71.94 | ||||
| 2025-07-09 | 13F | Key Client Fiduciary Advisors, LLC | 8,841 | -11.54 | 540 | -5.59 | ||||
| 2025-08-11 | 13F | Western Wealth Management, LLC | 10,757 | -1.45 | 658 | 5.12 | ||||
| 2025-07-21 | 13F | Ameritas Advisory Services, LLC | 177 | 11 | ||||||
| 2025-08-15 | 13F | Morgan Stanley | 2,988,204 | 5.00 | 182,669 | 12.02 | ||||
| 2025-08-04 | 13F | Linscomb & Williams, Inc. | 70,001 | 4.33 | 4,279 | 11.32 | ||||
| 2025-07-15 | 13F | FMA Wealth Management, LLC | 83,664 | 0.25 | 5,114 | 1.75 | ||||
| 2025-08-14 | 13F | Colony Group, LLC | 692,840 | 67.54 | 42,353 | 78.74 | ||||
| 2025-08-04 | 13F | Spire Wealth Management | 2,378 | -6.01 | 145 | 0.69 | ||||
| 2025-08-14 | 13F | Raymond James Financial Inc | 2,768,787 | 22.00 | 169,256 | 30.16 | ||||
| 2025-06-02 | 13F/A | Deutsche Bank Ag\ | 0 | -100.00 | 0 | |||||
| 2025-07-14 | 13F | AdvisorNet Financial, Inc | 371 | 267.33 | 23 | 340.00 | ||||
| 2025-07-18 | 13F | Parsons Capital Management Inc/ri | 32,150 | -1.64 | 1,965 | 4.97 | ||||
| 2025-07-31 | 13F | Hixon Zuercher, LLC | 134,085 | 9.34 | 8,197 | 16.65 | ||||
| 2025-08-07 | 13F | Sanchez Wealth Management Group | 229,543 | 0.95 | 14,032 | 7.69 | ||||
| 2025-07-28 | 13F | DORVAL Corp | 38,596 | 4.11 | 2,359 | 5.69 | ||||
| 2025-08-15 | 13F | Equitable Holdings, Inc. | 47,123 | -2.44 | 2,881 | 4.08 | ||||
| 2025-04-18 | 13F | Wolf Group Capital Advisors | 5,173 | 0.00 | 296 | 15.18 | ||||
| 2025-08-12 | 13F | LPL Financial LLC | 4,220,689 | -0.06 | 258,011 | 6.62 | ||||
| 2025-07-22 | 13F | Hill Island Financial Llc | 23,231 | -0.55 | 1,420 | 6.13 | ||||
| 2025-08-29 | NP | JAIUX - Managed Volatility Conservative Portfolio NAV | 111,259 | -1.45 | 6,801 | 5.13 | ||||
| 2025-08-27 | 13F/A | Brinker Capital Investments, LLC | 6,253 | 382 | ||||||
| 2025-07-25 | 13F | We Are One Seven, LLC | 22,454 | -48.05 | 1,373 | -44.59 | ||||
| 2025-08-05 | 13F | Strategic Financial Concepts, LLC | 20,165 | 1.61 | 1,233 | 8.36 | ||||
| 2025-07-18 | 13F | Newman Dignan & Sheerar, Inc. | 98,932 | 6,048 | ||||||
| 2025-08-08 | 13F | Avantax Advisory Services, Inc. | 579,175 | -2.13 | 35,405 | 4.42 | ||||
| 2025-08-14 | 13F | Marshall Investment Management, Llc | 11,073 | 282.49 | 677 | 309.70 | ||||
| 2025-08-29 | NP | JAIVX - Managed Volatility Moderate Portfolio NAV | 122,767 | -3.38 | 7,505 | 3.08 | ||||
| 2025-07-31 | 13F | Moloney Securities Asset Management, LLC | 37,833 | 32.18 | 2,313 | 40.98 | ||||
| 2025-07-11 | 13F | Quad-Cities Investment Group, LLC | 7,519 | -0.38 | 460 | 6.25 | ||||
| 2025-07-11 | 13F | Farther Finance Advisors, LLC | 35,213 | 77.52 | 2,153 | 88.94 | ||||
| 2025-08-13 | 13F | Northwestern Mutual Wealth Management Co | 1,657,127 | 0.46 | 101,300 | 7.18 | ||||
| 2025-07-29 | 13F | Private Trust Co Na | 4,282 | -2.39 | 262 | 3.98 | ||||
| 2025-07-08 | 13F | Granite Bay Wealth Management, LLC | 129,293 | 14.84 | 8 | 16.67 | ||||
| 2025-07-16 | 13F | Signaturefd, Llc | 0 | -100.00 | 0 | |||||
| 2025-08-14 | 13F | Fmr Llc | 7,608 | -2.71 | 465 | 3.79 | ||||
| 2025-08-11 | 13F | Citigroup Inc | 2 | -94.87 | 0 | -100.00 | ||||
| 2025-03-10 | 13F | Capstone Triton Financial Group, LLC | 0 | -100.00 | 0 | |||||
| 2025-08-08 | 13F | Cetera Investment Advisers | 562,332 | -4.02 | 34,375 | 2.39 | ||||
| 2025-05-14 | 13F | Jane Street Group, Llc | 0 | -100.00 | 0 | |||||
| 2025-08-04 | 13F | Clear Investment Research, Llc | 1,669 | 0.24 | 102 | 7.37 | ||||
| 2025-08-08 | 13F | Comprehensive Financial Planning, Inc./PA | 1,470 | 0.48 | 90 | 7.23 | ||||
| 2025-07-17 | 13F | Venture Visionary Partners LLC | 4,055 | 0.00 | 248 | 6.47 | ||||
| 2025-07-24 | 13F | IFP Advisors, Inc | 739 | 46.34 | 45 | 60.71 | ||||
| 2025-07-17 | 13F | Smith Anglin Financial, LLC | 31,097 | -17.89 | 1,901 | -12.44 | ||||
| 2025-08-12 | 13F | Global Retirement Partners, LLC | 39,486 | -72.29 | 2,414 | -71.65 | ||||
| 2025-08-18 | 13F/A | National Bank Of Canada /fi/ | 4,811 | 0.00 | 294 | 6.55 | ||||
| 2025-07-29 | 13F | International Assets Investment Management, Llc | 33,923 | -9.35 | 2,074 | -3.31 | ||||
| 2025-08-08 | 13F | Creative Planning | 4,142 | -30.49 | 253 | -25.81 | ||||
| 2025-05-01 | 13F | Cutter & CO Brokerage, Inc. | 0 | -100.00 | 0 | |||||
| 2025-07-18 | 13F | Consolidated Portfolio Review Corp | 6,578 | -1.28 | 402 | 5.51 | ||||
| 2025-08-19 | 13F | Cape Investment Advisory, Inc. | 215 | 0.00 | 13 | 8.33 | ||||
| 2025-08-11 | 13F | Ritter Daniher Financial Advisory LLC / DE | 4,199 | 0.00 | 257 | 6.67 |