Mga Batayang Estadistika
| Pemilik Institusional | 387 total, 346 long only, 8 short only, 33 long/short - change of -2.27% MRQ |
| Alokasi Portofolio Rata-rata | 0.2522 % - change of -13.82% MRQ |
| Saham Institusional (Jangka Panjang) | 28,907,665 (ex 13D/G) - change of 4.03MM shares 16.21% MRQ |
| Nilai Institusional (Jangka Panjang) | $ 3,244,297 USD ($1000) |
Kepemilikan Institusional dan Pemegang Saham
SPDR Series Trust - SPDR S&P Oil & Gas Exploration & Production ETF (US:XOP) memiliki 387 pemilik institusional dan pemegang saham yang telah mengajukan formulir 13D/G atau 13F kepada Komisi Bursa Efek (Securities Exchange Commission/SEC). Lembaga-lembaga ini memegang total 28,915,025 saham. Pemegang saham terbesar meliputi Goldman Sachs Group Inc, Susquehanna International Group, Llp, Healthcare Of Ontario Pension Plan Trust Fund, Bank Of America Corp /de/, Jpmorgan Chase & Co, Morgan Stanley, Citigroup Inc, Jane Street Group, Llc, Susquehanna International Group, Llp, and UBS Group AG .
Struktur kepemilikan institusional SPDR Series Trust - SPDR S&P Oil & Gas Exploration & Production ETF (ARCA:XOP) menunjukkan posisi terkini di perusahaan oleh institusi dan dana, serta perubahan terbaru dalam ukuran posisi. Pemegang saham utama dapat mencakup investor individu, reksa dana, dana lindung nilai, atau institusi. Jadwal 13D menunjukkan bahwa investor memegang (atau pernah memegang) lebih dari 5% saham perusahaan dan bermaksud (atau pernah bermaksud) untuk secara aktif mengejar perubahan strategi bisnis. Jadwal 13G menunjukkan investasi pasif lebih dari 5%.
The share price as of September 5, 2025 is 129.64 / share. Previously, on September 9, 2024, the share price was 128.32 / share. This represents an increase of 1.03% over that period.

Skor Sentimen Dana
Skor Sentimen Dana (sebelumnya dikenal sebagai Skor Akumulasi Kepemilikan) menemukan saham-saham yang paling banyak dibeli oleh dana. Ini adalah hasil dari model kuantitatif multi-faktor yang canggih yang mengidentifikasi perusahaan dengan tingkat akumulasi institusional tertinggi. Model penilaian menggunakan kombinasi dari total peningkatan pemilik yang diungkapkan, perubahan dalam alokasi portofolio pada pemilik tersebut, dan metrik lainnya. Angka berkisar dari 0 hingga 100, dengan angka yang lebih tinggi menunjukkan tingkat akumulasi yang lebih tinggi dibandingkan dengan perusahaan sejenisnya, dan 50 adalah rata-ratanya.
Frekuensi Pembaruan: Setiap Hari
Lihat Ownership Explorer, yang menyediakan daftar perusahaan dengan peringkat tertinggi.
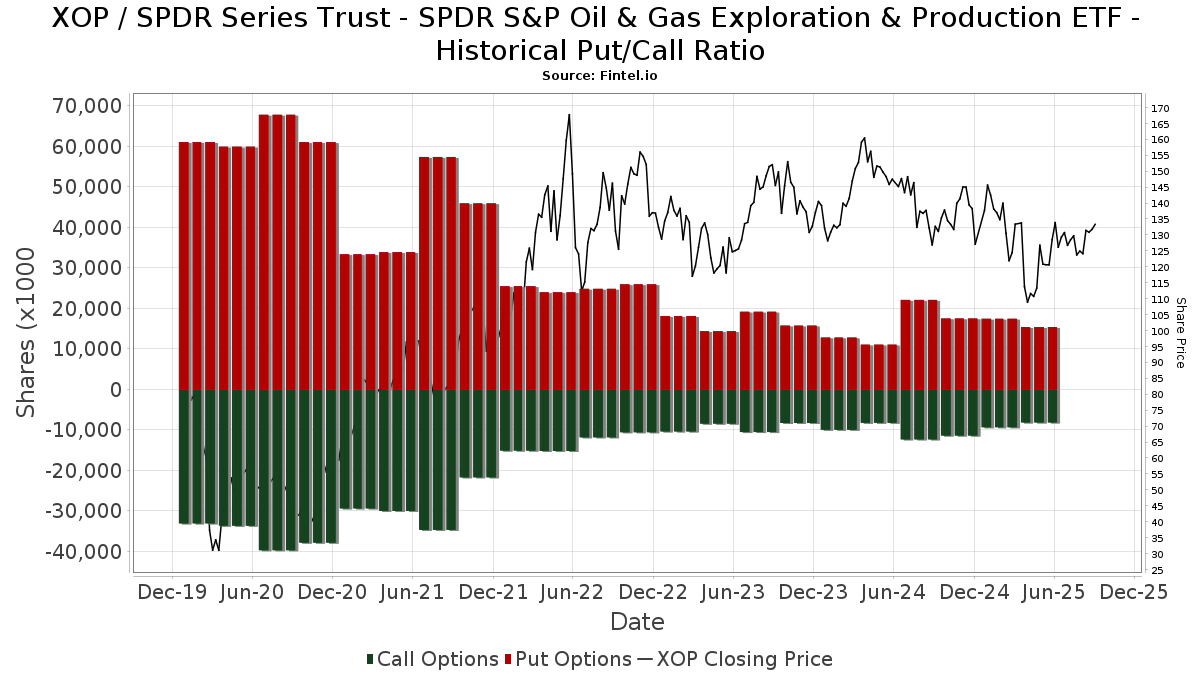
Rasio Put/Call Institusional
Selain melaporkan isu ekuitas dan utang standar, institusi dengan aset di bawah manajemen lebih dari 100 juta dolar AS juga harus mengungkapkan kepemilikan opsi put dan call mereka. Karena opsi put umumnya menunjukkan sentimen negatif, dan opsi call menunjukkan sentimen positif, kita dapat mengetahui sentimen institusional secara keseluruhan dengan memplot rasio put terhadap call. Grafik di sebelah kanan memplot rasio put/call historis untuk instrumen ini.
Menggunakan Rasio Put/Call sebagai indikator sentimen investor mengatasi salah satu kekurangan utama dari penggunaan total kepemilikan institusional, yaitu sejumlah besar aset yang dikelola diinvestasikan secara pasif untuk melacak indeks. Dana yang dikelola secara pasif biasanya tidak membeli opsi, sehingga indikator rasio put/call lebih akurat dalam melacak sentimen dana yang dikelola secara aktif.
Pengajuan 13D/G
Kami menyajikan pengajuan 13D/G secara terpisah dari pengajuan 13F karena perlakuan yang berbeda oleh SEC. Pengajuan 13D/G dapat diajukan oleh kelompok investor (dengan satu pemimpin), sedangkan pengajuan 13F tidak bisa. Hal ini mengakibatkan situasi di mana seorang investor dapat mengajukan 13D/G yang melaporkan satu nilai untuk total saham (mewakili semua saham yang dimiliki oleh kelompok investor), tetapi kemudian mengajukan 13F yang melaporkan nilai yang berbeda untuk total saham (mewakili kepemilikan mereka sendiri). Ini berarti bahwa kepemilikan saham dari pengajuan 13D/G dan pengajuan 13F seringkali tidak dapat dibandingkan secara langsung, sehingga kami menyajikannya secara terpisah.
Catatan: Mulai 16 Mei 2021, kami tidak lagi menampilkan pemilik yang belum mengajukan 13D/G dalam setahun terakhir. Sebelumnya, kami menampilkan riwayat lengkap pengajuan 13D/G. Secara umum, entitas yang diwajibkan untuk mengajukan pengajuan 13D/G harus mengajukan setidaknya setiap tahun sebelum mengirimkan pengajuan penutupan. Namun, terkadang dana keluar dari posisi tanpa mengirimkan pengajuan penutupan (misalnya, mereka menghentikan operasi), sehingga menampilkan riwayat lengkap terkadang menyebabkan kebingungan tentang kepemilikan saat ini. Untuk mencegah kebingungan, kami sekarang hanya menampilkan pemilik 'saat ini' - yaitu - pemilik yang telah mengajukan dalam setahun terakhir.
Upgrade to unlock premium data.
| Tanggal File | Formulir | Investor | Sebelumnya Saham |
Terbaru Saham |
Δ Saham (Persen) |
Kepemilikan (Persen) |
Δ Pagmamay-ari (Persen) |
|
|---|---|---|---|---|---|---|---|---|
| 2024-10-07 | BlackRock, Inc. | 400,000 | 2.00 |
Pengajuan 13F dan NPORT
Detail pada pengajuan 13F tersedia gratis. Detail pada pengajuan NP memerlukan keanggotaan premium. Baris berwarna hijau menunjukkan posisi baru. Baris berwarna merah menunjukkan posisi yang sudah ditutup. Klik tautan ini ikon untuk melihat riwayat transaksi selengkapnya.
Tingkatkan
untuk membuka data premium dan mengekspor ke Excel ![]() .
.
| Tanggal File | Sumber | Investor | Ketik | Presyo ng Avg (Silangan) |
Saham | Δ Saham (%) |
Dilaporkan Nilai ($1000) |
Nilai Δ (%) |
Alokasi Port (%) |
|
|---|---|---|---|---|---|---|---|---|---|---|
| 2025-08-14 | 13F | Hrt Financial Lp | 12,292 | -69.29 | 2 | -80.00 | ||||
| 2025-05-13 | 13F | Heck Capital Advisors, LLC | 0 | -100.00 | 0 | -100.00 | ||||
| 2025-08-28 | NP | RQEAX - RESQ Dynamic Allocation Fund RESQ Dynamic Allocation Class A Shares | 13,800 | 0.00 | 1,736 | -4.46 | ||||
| 2025-07-21 | 13F | Vanderbilt University | 357,073 | 0.61 | 44,920 | -3.90 | ||||
| 2025-05-14 | 13F | Caitlin John, LLC | 0 | -100.00 | 0 | |||||
| 2025-08-14 | 13F | Graham Capital Management, L.P. | 23,950 | 432.22 | 3,013 | 408.78 | ||||
| 2025-08-14 | 13F | Qube Research & Technologies Ltd | 7,367 | 1,641.61 | 927 | 1,583.64 | ||||
| 2025-08-04 | 13F | Creekmur Asset Management LLC | 226 | 0.00 | 28 | -3.45 | ||||
| 2025-07-11 | 13F | Shelton Wealth Management, Llc | 4,353 | -15.59 | 548 | -19.44 | ||||
| 2025-08-14 | 13F | Ancora Advisors, LLC | 600 | 0.00 | 75 | -5.06 | ||||
| 2025-08-13 | 13F | GeoWealth Management, LLC | 0 | -100.00 | 0 | |||||
| 2025-07-21 | 13F | Crews Bank & Trust | 119 | 0.00 | 15 | -6.67 | ||||
| 2025-05-02 | 13F | Fortis Group Advisors, LLC | 0 | -100.00 | 0 | |||||
| 2025-08-08 | 13F | Gts Securities Llc | 56,264 | 7,078 | ||||||
| 2025-05-01 | 13F | Caas Capital Management Lp | Put | 1,700 | 224 | |||||
| 2025-05-14 | 13F | Stonehage Fleming Financial Services Holdings Ltd | 0 | -100.00 | 0 | |||||
| 2025-08-01 | 13F | Chilton Capital Management Llc | 168 | 24.44 | 21 | 23.53 | ||||
| 2025-08-14 | 13F | Royal Bank Of Canada | 372,602 | 70.77 | 46,874 | 63.10 | ||||
| 2025-07-16 | 13F | One + One Wealth Management, Llc | 20,588 | -7.15 | 2,590 | -11.34 | ||||
| 2025-07-17 | 13F | HB Wealth Management, LLC | 9,968 | 1,254 | ||||||
| 2025-08-14 | 13F | Royal Bank Of Canada | Put | 110,200 | 980.39 | 13,863 | 932.24 | |||
| 2025-07-22 | 13F | IMC-Chicago, LLC | 20,969 | 2,638 | ||||||
| 2025-07-23 | 13F | Sunbeam Capital Management, LLC | 2,029 | 0.05 | 255 | -4.49 | ||||
| 2025-08-14 | 13F | Wealth Preservation Advisors, LLC | 0 | -100.00 | 0 | |||||
| 2025-08-26 | 13F/A | Thrivent Financial For Lutherans | 5,495 | -93.57 | 1 | -100.00 | ||||
| 2025-05-15 | 13F | BlueCrest Capital Management Ltd | 0 | -100.00 | 0 | |||||
| 2025-08-14 | 13F | Man Group plc | Put | 0 | -100.00 | 0 | ||||
| 2025-08-14 | 13F | BCS Private Wealth Management, Inc. | 2,000 | 0 | ||||||
| 2025-08-14 | 13F | Soros Fund Management Llc | Put | 0 | -100.00 | 0 | ||||
| 2025-07-28 | 13F | Kiker Wealth Management, LLC | 70 | 0.00 | 9 | -11.11 | ||||
| 2025-08-04 | 13F | Roble, Belko & Company, Inc | 52 | 0 | ||||||
| 2025-08-14 | 13F | SoftVest Advisors, LLC | Call | 450,000 | 0.00 | 56,610 | -4.49 | |||
| 2025-05-28 | NP | THRIVENT SERIES FUND INC - Thrivent Moderately Conservative Allocation Portfolio Class A | 723 | 0.00 | 95 | 0.00 | ||||
| 2025-07-24 | 13F | IFP Advisors, Inc | 63 | 50.00 | 8 | 40.00 | ||||
| 2025-08-11 | 13F | TD Waterhouse Canada Inc. | 149 | 204.08 | 19 | 200.00 | ||||
| 2025-07-16 | 13F | Signaturefd, Llc | 713 | 0.00 | 90 | -4.30 | ||||
| 2025-08-08 | 13F | Avantax Advisory Services, Inc. | 2,284 | 287 | ||||||
| 2025-08-13 | 13F | Walleye Capital LLC | Call | 8,300 | 0.00 | 1,044 | -4.48 | |||
| 2025-08-13 | 13F | Walleye Capital LLC | Put | 31,600 | 0.00 | 3,975 | -4.49 | |||
| 2025-08-13 | 13F | Natixis | 3,591 | 1,963.79 | 452 | 1,950.00 | ||||
| 2025-08-13 | 13F | EverSource Wealth Advisors, LLC | 1,744 | 0.00 | 219 | -4.37 | ||||
| 2025-08-14 | 13F | Jain Global LLC | 48,000 | 223.91 | 6,038 | 209.48 | ||||
| 2025-08-13 | 13F | Walleye Capital LLC | 634 | 80 | ||||||
| 2025-08-14 | 13F | AYAL Capital Advisors Ltd | Put | 0 | -100.00 | 0 | ||||
| 2025-08-14 | 13F | Jain Global LLC | Call | 10,000 | 1,258 | |||||
| 2025-08-14 | 13F | Jain Global LLC | Put | 10,000 | 1,258 | |||||
| 2025-05-09 | 13F | Fairfield Financial Advisors, LTD | 0 | -100.00 | 0 | |||||
| 2025-07-29 | 13F | Harbor Asset Planning, Inc. | 4 | 1 | ||||||
| 2025-08-05 | 13F | Harel Insurance Investments & Financial Services Ltd. | 0 | -100.00 | 0 | |||||
| 2025-08-14 | 13F | Bank Of America Corp /de/ | Put | 668,800 | 314.89 | 84,135 | 296.28 | |||
| 2025-08-14 | 13F | Bank Of America Corp /de/ | Call | 183,500 | 46.80 | 23,084 | 40.22 | |||
| 2025-08-14 | 13F | Bank Of America Corp /de/ | 3,060,372 | 78.87 | 384,995 | 70.84 | ||||
| 2025-08-14 | 13F | Transamerica Financial Advisors, Inc. | 4,716 | -1.36 | 593 | |||||
| 2025-08-14 | 13F | Colony Group, LLC | 7,829 | -21.51 | 985 | -25.06 | ||||
| 2025-05-14 | 13F | OMERS ADMINISTRATION Corp | 0 | -100.00 | 0 | |||||
| 2025-07-09 | 13F | Fermata Advisors, LLC | 0 | -100.00 | 0 | |||||
| 2025-08-15 | 13F | Kestra Advisory Services, LLC | 4,414 | -8.21 | 555 | -12.32 | ||||
| 2025-05-15 | 13F | Paloma Partners Management Co | 0 | -100.00 | 0 | |||||
| 2025-08-01 | 13F | Rossby Financial, LCC | 2,647 | 0.04 | 333 | 11.00 | ||||
| 2025-07-09 | 13F | Krilogy Financial LLC | 40,375 | 4.59 | 5,079 | -0.10 | ||||
| 2025-08-08 | 13F | Paragon Capital Management LLC | 6,459 | -4.42 | 813 | -8.76 | ||||
| 2025-08-06 | 13F | Mascagni Wealth Management, Inc. | 1,957 | 0.00 | 246 | -4.28 | ||||
| 2025-08-12 | 13F | Steward Partners Investment Advisory, Llc | 2,477 | 2.23 | 312 | -2.51 | ||||
| 2025-08-08 | 13F | Creative Planning | 3,495 | -3.96 | 440 | -8.35 | ||||
| 2025-08-04 | 13F | Creative Financial Designs Inc /adv | 0 | -100.00 | 0 | |||||
| 2025-08-01 | 13F | Bessemer Group Inc | 511,340 | -0.22 | 64 | -4.48 | ||||
| 2025-08-13 | 13F | Argyle Capital Partners, LLC | 1,662 | 209 | ||||||
| 2025-08-14 | 13F | Frisch Financial Group, Inc. | 22,410 | -46.76 | 3 | -60.00 | ||||
| 2025-04-23 | 13F | Oppenheimer & Co Inc | 0 | -100.00 | 0 | |||||
| 2025-08-11 | 13F | Sierra Capital LLC | 0 | -100.00 | 0 | |||||
| 2025-08-13 | 13F | D L Carlson Investment Group Inc | 2,273 | -47.11 | 286 | -49.65 | ||||
| 2025-08-14 | 13F | Jane Street Group, Llc | Put | 1,636,900 | 56.51 | 205,922 | 49.48 | |||
| 2025-08-14 | 13F | Integrated Wealth Concepts LLC | 13,410 | -19.09 | 1,687 | -22.69 | ||||
| 2025-05-15 | 13F | Royal Bank Of Canada | Call | 0 | -100.00 | 0 | -100.00 | |||
| 2025-08-14 | 13F | Jane Street Group, Llc | Call | 542,400 | -63.17 | 68,234 | -64.83 | |||
| 2025-07-28 | 13F | Allianz Asset Management GmbH | Put | 178,300 | 8.00 | 22,430 | 3.15 | |||
| 2025-08-11 | 13F | Aptus Capital Advisors, LLC | 937 | 0.21 | 118 | -4.88 | ||||
| 2025-08-14 | 13F | Daiwa Securities Group Inc. | 1,825 | 0.00 | 0 | |||||
| 2025-08-13 | 13F | Quantbot Technologies LP | 5,290 | 665 | ||||||
| 2025-08-12 | 13F | Jpmorgan Chase & Co | 2,975,222 | 280.02 | 374,283 | 262.97 | ||||
| 2025-05-15 | 13F | Pickering Energy Partners Lp | 0 | -100.00 | 0 | |||||
| 2025-04-28 | 13F | Strategic Financial Concepts, LLC | 0 | -100.00 | 0 | -100.00 | ||||
| 2025-05-09 | 13F | Cary Street Partners Financial Llc | 0 | -100.00 | 0 | |||||
| 2025-08-12 | 13F | SRS Capital Advisors, Inc. | 79 | -28.83 | 10 | -35.71 | ||||
| 2025-05-15 | 13F | Moore Capital Management, Lp | Call | 0 | -100.00 | 0 | ||||
| 2025-08-14 | 13F | Van Den Berg Management I, Inc | 3,780 | -4.95 | 475 | -9.18 | ||||
| 2025-08-08 | 13F | Your Advocates Ltd., LLP | 222 | 0.00 | 28 | -6.90 | ||||
| 2025-08-14 | 13F | Scopus Asset Management, L.p. | Put | 246,000 | 146.00 | 30,947 | 134.96 | |||
| 2025-08-14 | 13F | Quarry LP | 4,000 | 503 | ||||||
| 2025-08-14 | 13F | Emmett Investment Management, LP | 0 | -100.00 | 0 | |||||
| 2025-08-14 | 13F | Aqr Capital Management Llc | 3,292 | 0.00 | 414 | -4.39 | ||||
| 2025-08-06 | 13F | Hallmark Capital Management Inc | 279 | -54.71 | 35 | -56.79 | ||||
| 2025-05-14 | 13F | SPX Equities Gestao de Recursos Ltda | 0 | -100.00 | 0 | |||||
| 2025-07-15 | 13F | Heritage Oak Wealth Advisors Llc | 15,798 | 0.43 | 1,987 | -4.06 | ||||
| 2025-08-14 | 13F | Volterra Technologies LP | Put | 800 | 101 | |||||
| 2025-05-15 | 13F | Centiva Capital, LP | Call | 0 | -100.00 | 0 | ||||
| 2025-08-14 | 13F | Volterra Technologies LP | Call | 12,800 | 1,610 | |||||
| 2025-07-17 | 13F | Venture Visionary Partners LLC | 13,500 | 93.22 | 1,698 | 84.57 | ||||
| 2025-07-31 | 13F | Carrera Capital Advisors | 14,373 | 10.66 | 1,808 | 5.73 | ||||
| 2025-05-15 | 13F | StoneX Group Inc. | 0 | -100.00 | 0 | -100.00 | ||||
| 2025-07-21 | 13F | Mirae Asset Global Investments Co., Ltd. | 9,750 | 29.14 | 1,227 | 24.34 | ||||
| 2025-05-06 | 13F | Guild Investment Management, Inc. | 0 | -100.00 | 0 | |||||
| 2025-08-11 | 13F | Capital Square, LLC | 3,071 | -5.97 | 409 | -5.12 | ||||
| 2025-08-11 | 13F | Greenland Capital Management LP | 0 | -100.00 | 0 | |||||
| 2025-07-16 | 13F | Octavia Wealth Advisors, LLC | 2,212 | -18.23 | 278 | -21.91 | ||||
| 2025-08-11 | 13F | Hexagon Capital Partners LLC | 0 | -100.00 | 0 | |||||
| 2025-08-14 | 13F | Silvercrest Asset Management Group Llc | 12,265 | -6.02 | 1,543 | -10.24 | ||||
| 2025-07-17 | 13F | ERn Financial, LLC | 0 | -100.00 | 0 | |||||
| 2025-08-14 | 13F | GWM Advisors LLC | 2,593 | -59.44 | 326 | -61.28 | ||||
| 2025-05-15 | 13F | EHP Funds Inc. | 0 | -100.00 | 0 | |||||
| 2025-07-31 | 13F | Waldron Private Wealth LLC | 3,247 | 32.86 | 409 | 27.10 | ||||
| 2025-08-14 | 13F | Polymer Capital Management (US) LLC | Call | 15,000 | 1,887 | |||||
| 2025-05-28 | NP | THRIVENT SERIES FUND INC - Thrivent Moderately Aggressive Allocation Portfolio Class A | 2,457 | 0.00 | 324 | -0.62 | ||||
| 2025-08-14 | 13F | Stifel Financial Corp | 29,398 | -13.80 | 3,698 | -17.66 | ||||
| 2025-08-13 | 13F | Botty Investors LLC | 24,933 | 0.00 | 3,137 | -4.48 | ||||
| 2025-05-15 | 13F | Toronto Dominion Bank | Call | 0 | -100.00 | 0 | -100.00 | |||
| 2025-08-01 | 13F | Envestnet Asset Management Inc | 18,795 | 11.33 | 2,364 | 6.34 | ||||
| 2025-08-05 | 13F | W.G. Shaheen & Associates DBA Whitney & Co | 52,694 | 6,629 | ||||||
| 2025-08-13 | 13F | Healthcare Of Ontario Pension Plan Trust Fund | 3,230,000 | 20.52 | 406,334 | 15.11 | ||||
| 2025-07-08 | 13F | Mirabaud & Cie SA | 5,000 | 0.00 | 629 | -4.41 | ||||
| 2025-07-11 | 13F | Farther Finance Advisors, LLC | 1,096 | 1.95 | 138 | -3.52 | ||||
| 2025-08-12 | 13F | AlphaCore Capital LLC | 171 | 22 | ||||||
| 2025-07-10 | 13F | Oliver Lagore Vanvalin Investment Group | 0 | -100.00 | 0 | |||||
| 2025-08-14 | 13F | Headlands Technologies LLC | 1,277 | 102.38 | 161 | 92.77 | ||||
| 2025-07-28 | 13F | Twin Tree Management, LP | Call | 78,400 | 9,863 | |||||
| 2025-07-28 | 13F | Twin Tree Management, LP | 123,964 | 597.25 | 15,595 | 566.13 | ||||
| 2025-08-11 | 13F | Private Advisor Group, LLC | 6,074 | -30.23 | 764 | -33.33 | ||||
| 2025-08-15 | 13F | Caz Investments Lp | 15,000 | 1,887 | ||||||
| 2025-08-14 | 13F | Jane Street Group, Llc | 204,648 | 25,745 | ||||||
| 2025-08-14 | 13F | Two Sigma Securities, Llc | 19,606 | -35.27 | 2,466 | -38.18 | ||||
| 2025-04-30 | 13F | Sofos Investments, Inc. | 219 | 2,637.50 | 29 | 2,700.00 | ||||
| 2025-08-04 | 13F | HBK Sorce Advisory LLC | 11,855 | -1.04 | 1,491 | -5.45 | ||||
| 2025-05-14 | 13F | Ieq Capital, Llc | 0 | -100.00 | 0 | |||||
| 2025-08-14 | 13F | Federation des caisses Desjardins du Quebec | 1,450 | 1,350.00 | 182 | 1,300.00 | ||||
| 2025-08-04 | 13F | Pensionmark Financial Group, Llc | 6,314 | -18.15 | 794 | -21.77 | ||||
| 2025-08-05 | 13F | Carolinas Wealth Consulting Llc | 0 | -100.00 | 0 | -100.00 | ||||
| 2025-08-14 | 13F | Point72 Asset Management, L.P. | Put | 69,900 | 8,793 | |||||
| 2025-08-14 | 13F | Point72 Asset Management, L.P. | Call | 19,900 | 2,503 | |||||
| 2025-08-05 | 13F | Simplex Trading, Llc | 0 | -100.00 | 0 | |||||
| 2025-08-14 | 13F | Man Group plc | Call | 0 | -100.00 | 0 | ||||
| 2025-08-14 | 13F | Whitebox Advisors Llc | Put | 150,000 | -57.14 | 18,870 | -59.07 | |||
| 2025-07-08 | 13F | Parallel Advisors, LLC | 2,369 | 0.00 | 298 | -4.49 | ||||
| 2025-07-22 | 13F | Appleton Partners Inc/ma | 9,553 | -8.25 | 1 | 0.00 | ||||
| 2025-08-14 | 13F | Whitebox Advisors Llc | 32,903 | 4,139 | ||||||
| 2025-05-15 | 13F | Arosa Capital Management LP | Call | 0 | -100.00 | 0 | ||||
| 2025-03-27 | NP | TCAAX - Thrivent Moderately Conservative Allocation Fund Class A | 182 | 24 | ||||||
| 2025-08-14 | 13F | Aristeia Capital Llc | Put | 618,600 | -2.83 | 77,820 | -7.19 | |||
| 2025-07-28 | 13F | Pettinga Financial Advisors, LLC | 15,567 | -1.42 | 1,958 | -5.82 | ||||
| 2025-08-13 | 13F | Fisher Asset Management, LLC | 11,379 | 8.32 | 1,431 | 3.47 | ||||
| 2025-08-14 | 13F | LMR Partners LLP | Put | 0 | -100.00 | 0 | ||||
| 2025-08-12 | 13F | J.w. Cole Advisors, Inc. | 8,092 | 1,018 | ||||||
| 2025-08-12 | 13F | Twin Focus Capital Partners, Llc | 2,523 | -16.04 | 317 | -19.75 | ||||
| 2025-08-14 | 13F | Group One Trading, L.p. | 55,202 | 6,944 | ||||||
| 2025-08-06 | 13F | Commonwealth Equity Services, Llc | 27,816 | -2.05 | 3 | 0.00 | ||||
| 2025-07-23 | 13F | Gainplan LLC | 6,032 | -43.57 | 759 | -46.13 | ||||
| 2025-07-07 | 13F | Modus Advisors, LLC | 42,700 | -1.49 | 5,372 | -5.90 | ||||
| 2025-08-08 | 13F | Banco Bilbao Vizcaya Argentaria, S.a. | 12,523 | -14.03 | 1,588 | -17.42 | ||||
| 2025-08-12 | 13F | Proequities, Inc. | 0 | 0 | ||||||
| 2025-08-06 | 13F | Pekin Hardy Strauss, Inc. | 3,760 | 23.64 | 473 | 18.25 | ||||
| 2025-07-29 | 13F | TrueMark Investments, LLC | 0 | -100.00 | 0 | |||||
| 2025-08-13 | 13F | VestGen Advisors, LLC | 3,206 | -36.93 | 403 | -39.76 | ||||
| 2025-08-14 | 13F | SummitTX Capital, L.P. | 7,942 | 999 | ||||||
| 2025-07-28 | 13F | Private Wealth Asset Management, LLC | 1,582 | 0.00 | 199 | -4.33 | ||||
| 2025-05-14 | 13F | Summit Financial, LLC | 0 | -100.00 | 0 | |||||
| 2025-08-14 | 13F | DRW Securities, LLC | Put | 0 | -100.00 | 0 | -100.00 | |||
| 2025-08-14 | 13F | Evercore Wealth Management, LLC | 12,968 | -0.31 | 1,631 | -4.79 | ||||
| 2025-05-15 | 13F | Gendell Jeffrey L | 0 | -100.00 | 0 | |||||
| 2025-07-23 | 13F | Vontobel Holding Ltd. | 4,792 | 14.83 | 603 | 9.65 | ||||
| 2025-07-18 | 13F | Founders Capital Management | 252 | 0.00 | 32 | -6.06 | ||||
| 2025-08-14 | 13F | Glen Eagle Advisors, LLC | 2,240 | 0.04 | 282 | -4.42 | ||||
| 2025-08-13 | 13F | Cerity Partners LLC | 11,355 | 24.17 | 1,428 | 18.60 | ||||
| 2025-05-13 | 13F | Fca Corp /tx | 0 | -100.00 | 0 | |||||
| 2025-07-14 | 13F | AdvisorNet Financial, Inc | 1,145 | -20.76 | 144 | -24.21 | ||||
| 2025-08-11 | 13F | First American Trust, Fsb | 0 | -100.00 | 0 | |||||
| 2025-08-08 | 13F | SG Americas Securities, LLC | 28,413 | -10.76 | 4 | -25.00 | ||||
| 2025-08-13 | 13F | Quadrature Capital Ltd | 93,001 | 730.74 | 11,700 | 693.69 | ||||
| 2025-08-13 | 13F | Capital Fund Management S.a. | Put | 48,100 | -75.31 | 6,051 | -76.42 | |||
| 2025-05-28 | NP | THRIVENT SERIES FUND INC - Thrivent Mid Cap Growth Portfolio Class A | 1,340 | 0.00 | 176 | -0.56 | ||||
| 2025-08-14 | 13F | Kovitz Investment Group Partners, LLC | 1,687 | 212 | ||||||
| 2025-08-12 | 13F | Jaffetilchin Investment Partners, LLC | 21,151 | -12.71 | 2,661 | -16.64 | ||||
| 2025-08-12 | 13F | Argent Trust Co | 5,828 | 0.00 | 733 | -4.43 | ||||
| 2025-08-11 | 13F | Brown Brothers Harriman & Co | 870 | -21.97 | 109 | -25.34 | ||||
| 2025-07-14 | 13F | U.S. Capital Wealth Advisors, LLC | 5,602 | -59.50 | 705 | -61.34 | ||||
| 2025-08-07 | 13F/A | Credit Industriel Et Commercial | 25,267 | 468.69 | 3,179 | 443.25 | ||||
| 2025-03-21 | NP | PASIX - PACE Alternative Strategies Investments Class A | Short | -343 | -46 | |||||
| 2025-07-09 | 13F | Massmutual Trust Co Fsb/adv | 300 | 38 | ||||||
| 2025-03-27 | NP | AALGX - Thrivent Global Stock Fund Class A | 1,383 | -20.79 | 186 | -27.45 | ||||
| 2025-08-07 | 13F/A | Credit Industriel Et Commercial | Put | 80,000 | 300.00 | 10,064 | 282.08 | |||
| 2025-08-13 | 13F | Twin Peaks Wealth Advisors, LLC | 70 | 9 | ||||||
| 2025-08-14 | 13F | Atom Investors LP | 45,217 | 287.10 | 5,688 | 269.83 | ||||
| 2025-08-14 | 13F | Alaska Permanent Fund Corp | 0 | -100.00 | 0 | |||||
| 2025-07-17 | 13F | SeaBridge Investment Advisors LLC | 2,945 | 0.00 | 370 | -4.39 | ||||
| 2025-08-12 | 13F | Nemes Rush Group LLC | 3 | 0.00 | 0 | |||||
| 2025-05-12 | 13F | Providence First Trust Co | 0 | -100.00 | 0 | |||||
| 2025-08-11 | 13F | Pin Oak Investment Advisors Inc | 135 | 0.00 | 0 | |||||
| 2025-05-09 | 13F | Belvedere Trading LLC | 0 | -100.00 | 0 | |||||
| 2025-08-14 | 13F | Cinctive Capital Management LP | 0 | -100.00 | 0 | |||||
| 2025-08-14 | 13F | Capstone Investment Advisors, Llc | 51,523 | 6,482 | ||||||
| 2025-07-30 | 13F | Whittier Trust Co | 1,060 | 0.00 | 133 | -4.32 | ||||
| 2025-08-14 | 13F | Holt Capital Advisors, L.L.C. dba Holt Capital Partners, L.P. | 3,782 | -29.96 | 476 | -33.19 | ||||
| 2025-04-10 | 13F | Maltin Wealth Management, Inc. | 0 | -100.00 | 0 | |||||
| 2025-08-14 | 13F | Capstone Investment Advisors, Llc | Call | 336,000 | -51.09 | 42,269 | -53.29 | |||
| 2025-05-20 | 13F | Belpointe Asset Management LLC | 0 | -100.00 | 0 | |||||
| 2025-08-14 | 13F | Capstone Investment Advisors, Llc | Put | 547,200 | -27.57 | 68,838 | -30.82 | |||
| 2025-08-15 | 13F | Morgan Stanley | 2,619,495 | -11.25 | 329,533 | -15.23 | ||||
| 2025-05-14 | 13F | GM Advisory Group, Inc. | 0 | -100.00 | 0 | |||||
| 2025-08-12 | 13F | Howe & Rusling Inc | 35 | 0.00 | 4 | 0.00 | ||||
| 2025-08-08 | 13F | Skylands Capital, LLC | 43,815 | -6.83 | 5,512 | -11.01 | ||||
| 2025-08-14 | 13F | Verition Fund Management LLC | 2,318 | 292 | ||||||
| 2025-07-30 | NP | EMPB - Efficient Market Portfolio Plus ETF | Short | -7,017 | 41.36 | -839 | 29.12 | |||
| 2025-08-05 | 13F | Westside Investment Management, Inc. | 200 | 0.00 | 25 | -3.85 | ||||
| 2025-08-14 | 13F | Crestmont Private Wealth LLC | 1,856 | -2.52 | 234 | -6.80 | ||||
| 2025-07-25 | 13F | We Are One Seven, LLC | 5,070 | 1.18 | 638 | -3.34 | ||||
| 2025-08-15 | 13F | Equitable Holdings, Inc. | 1,903 | -18.01 | 239 | -21.64 | ||||
| 2025-09-04 | 13F/A | Advisor Group Holdings, Inc. | 18,262 | -14.17 | 2,300 | -17.98 | ||||
| 2025-08-08 | 13F | Fiduciary Counselling Inc | 2,022 | 0.00 | 254 | -4.51 | ||||
| 2025-08-06 | 13F | Savant Capital, LLC | 5,279 | 0.00 | 664 | -4.46 | ||||
| 2025-08-14 | 13F | Citadel Advisors Llc | Call | 682,700 | -16.76 | 85,884 | -20.50 | |||
| 2025-08-13 | 13F | Edgestream Partners, L.P. | 0 | -100.00 | 0 | |||||
| 2025-08-14 | 13F | Citadel Advisors Llc | 301,167 | 127.11 | 37,887 | 116.91 | ||||
| 2025-05-15 | 13F | Advisory Services Network, LLC | 0 | -100.00 | 0 | |||||
| 2025-08-14 | 13F | Citadel Advisors Llc | Put | 1,052,400 | -25.82 | 132,392 | -29.15 | |||
| 2025-07-16 | 13F/A | CX Institutional | 3,105 | 0 | ||||||
| 2025-08-12 | 13F | Insigneo Advisory Services, Llc | 1,885 | 0.59 | 237 | -3.66 | ||||
| 2025-08-12 | 13F | Eisler Capital Management Ltd. | Call | 0 | -100.00 | 0 | -100.00 | |||
| 2025-08-08 | 13F | Itau Unibanco Holding S.A. | 0 | -100.00 | 0 | |||||
| 2025-04-21 | 13F | Ronald Blue Trust, Inc. | 0 | -100.00 | 0 | |||||
| 2025-08-14 | 13F | Quantinno Capital Management LP | 4,895 | -6.83 | 616 | -11.13 | ||||
| 2025-08-04 | 13F | Assetmark, Inc | 92 | 0.00 | 12 | -8.33 | ||||
| 2025-07-07 | 13F | Insight Wealth Strategies, LLC | 1,720 | -97.83 | 218 | -97.91 | ||||
| 2025-08-12 | 13F | O'shaughnessy Asset Management, Llc | 288 | -33.49 | 36 | -36.84 | ||||
| 2025-08-14 | 13F | Lombard Odier Asset Management (USA) Corp | 29,000 | 11.54 | 3,648 | 6.54 | ||||
| 2025-07-28 | 13F | Copia Wealth Management | 375 | 476.92 | 47 | 487.50 | ||||
| 2025-08-05 | 13F | EPG Wealth Management LLC | 500 | 0.00 | 63 | -4.62 | ||||
| 2025-08-14 | 13F | Lombard Odier Asset Management (USA) Corp | Put | 400,000 | -20.00 | 50,320 | -23.59 | |||
| 2025-08-15 | 13F | Captrust Financial Advisors | 4,235 | 11.01 | 533 | 5.98 | ||||
| 2025-04-17 | 13F | Life Planning Partners, Inc | 0 | -100.00 | 0 | -100.00 | ||||
| 2025-05-15 | 13F/A | Weiss Asset Management LP | 0 | -100.00 | 0 | |||||
| 2025-08-11 | 13F | Insight 2811, Inc. | 1,949 | 0.00 | 245 | -4.30 | ||||
| 2025-08-08 | 13F | Kingsview Wealth Management, LLC | 5,690 | 716 | ||||||
| 2025-07-30 | 13F | Strategic Blueprint, LLC | 2,250 | -1.01 | 283 | -5.35 | ||||
| 2025-08-12 | 13F | Clear Street Markets Llc | 100 | 13 | ||||||
| 2025-07-09 | 13F | Dynamic Advisor Solutions LLC | 10,965 | 0.51 | 1,379 | -3.97 | ||||
| 2025-08-12 | 13F | Cornerstone Wealth Management, LLC | 1,641 | -4.15 | 206 | -8.44 | ||||
| 2025-07-15 | 13F | Missouri Trust & Investment Co | 30 | 0.00 | 4 | 0.00 | ||||
| 2025-08-06 | 13F | Convergence Financial, LLC | 9,542 | 2.22 | 1,200 | -2.36 | ||||
| 2025-04-14 | 13F | Abacus Planning Group, Inc. | 0 | -100.00 | 0 | |||||
| 2025-08-13 | 13F | Everstar Asset Management, LLC | 0 | -100.00 | 0 | -100.00 | ||||
| 2025-08-11 | 13F | HighTower Advisors, LLC | 17,624 | -8.48 | 2,217 | -12.58 | ||||
| 2025-08-14 | 13F | Hilltop Holdings Inc. | 2,253 | 14.13 | 283 | 9.27 | ||||
| 2025-05-08 | 13F | Jefferies Financial Group Inc. | Put | 0 | -100.00 | 0 | -100.00 | |||
| 2025-05-16 | 13F | Coppell Advisory Solutions LLC | 0 | -100.00 | 0 | |||||
| 2025-08-13 | 13F | Northwestern Mutual Wealth Management Co | 6,451 | -44.11 | 811 | -46.64 | ||||
| 2025-07-14 | 13F | Toth Financial Advisory Corp | 15 | 0.00 | 2 | 0.00 | ||||
| 2025-08-14 | 13F | MGB Wealth Management, LLC | 1,005 | 0.20 | 126 | -4.55 | ||||
| 2025-08-05 | 13F | Fourth Dimension Wealth, LLC | 655 | -5.48 | 82 | -9.89 | ||||
| 2025-08-13 | 13F | Flow Traders U.s. Llc | 8,600 | -70.93 | 1 | -66.67 | ||||
| 2025-08-14 | 13F | Caption Management, LLC | 13,050 | 1,642 | ||||||
| 2025-07-10 | 13F | Wealth Enhancement Advisory Services, Llc | 4,701 | 0.53 | 607 | -1.30 | ||||
| 2025-08-08 | 13F | Financial Gravity Companies, Inc. | 219 | 0.00 | 28 | -3.57 | ||||
| 2025-07-09 | 13F | Key Client Fiduciary Advisors, LLC | 2,700 | 0.00 | 340 | -4.51 | ||||
| 2025-07-29 | 13F | Burford Brothers, Inc. | 0 | -100.00 | 0 | |||||
| 2025-08-18 | 13F | Pacific Center for Financial Services | 39 | 2.63 | 5 | -20.00 | ||||
| 2025-08-04 | 13F | Arkadios Wealth Advisors | 26,793 | -23.17 | 3,371 | -26.63 | ||||
| 2025-08-14 | 13F | State Of Wisconsin Investment Board | 88,800 | 11,171 | ||||||
| 2025-08-14 | 13F | Susquehanna International Group, Llp | Put | 3,675,500 | 6.04 | 462,378 | 1.28 | |||
| 2025-08-14 | 13F | Susquehanna International Group, Llp | 261,435 | 52.48 | 32,889 | 45.64 | ||||
| 2025-08-13 | 13F | ExodusPoint Capital Management, LP | 73,434 | 9 | ||||||
| 2025-08-14 | 13F | Susquehanna International Group, Llp | Call | 1,620,100 | -21.25 | 203,809 | -24.78 | |||
| 2025-07-15 | 13F | Financial Management Professionals, Inc. | 96 | 0.00 | 12 | 0.00 | ||||
| 2025-08-11 | 13F | Cladis Investment Advisory, LLC | 2,662 | 0.00 | 335 | -4.57 | ||||
| 2025-07-16 | 13F | Strategic Investment Solutions, Inc. /IL | 200 | 0.00 | 25 | -3.85 | ||||
| 2025-07-11 | 13F | Seacrest Wealth Management, Llc | 0 | -100.00 | 0 | |||||
| 2025-08-08 | 13F | Smithfield Trust Co | 145 | 0.00 | 0 | |||||
| 2025-05-15 | 13F | Brevan Howard Capital Management LP | 0 | -100.00 | 0 | -100.00 | ||||
| 2025-07-22 | 13F | Grimes & Company, Inc. | 2,982 | 375 | ||||||
| 2025-07-31 | 13F | Wealthfront Advisers Llc | 16,544 | -1.79 | 2,081 | -6.18 | ||||
| 2025-08-19 | 13F | Slocum, Gordon & Co LLP | 0 | -100.00 | 0 | |||||
| 2025-08-08 | 13F | Cetera Investment Advisers | 52,417 | -33.58 | 6,594 | -36.57 | ||||
| 2025-08-12 | 13F | Pathstone Holdings, LLC | 11,518 | -23.53 | 1,449 | -26.98 | ||||
| 2025-08-14 | 13F | Two Sigma Investments, Lp | 0 | -100.00 | 0 | |||||
| 2025-05-12 | 13F | Independent Advisor Alliance | 0 | -100.00 | 0 | |||||
| 2025-08-12 | 13F | Global Retirement Partners, LLC | 84 | 0.00 | 11 | -9.09 | ||||
| 2025-08-11 | 13F | ARS Investment Partners, LLC | 25,956 | 39.17 | 3,265 | 32.29 | ||||
| 2025-08-14 | 13F | IHT Wealth Management, LLC | 1,621 | 204 | ||||||
| 2025-08-08 | 13F | Pnc Financial Services Group, Inc. | 10,311 | -0.42 | 1,297 | -4.84 | ||||
| 2025-08-11 | 13F | FSA Wealth Management LLC | 703 | 0.14 | 88 | -4.35 | ||||
| 2025-08-14 | 13F | Peak6 Llc | Call | 1,393,600 | 403.47 | 175,315 | 380.88 | |||
| 2025-08-14 | 13F | Raymond James Financial Inc | 38,257 | -9.12 | 4,813 | -13.20 | ||||
| 2025-08-14 | 13F | Peak6 Llc | Put | 127,400 | 3.33 | 16,027 | -1.31 | |||
| 2025-05-02 | 13F | Capital A Wealth Management, LLC | 120 | -25.00 | 16 | -28.57 | ||||
| 2025-08-07 | 13F | Kestra Private Wealth Services, Llc | 8,574 | -11.54 | 1,079 | -15.52 | ||||
| 2025-08-07 | 13F | Amica Retiree Medical Trust | 1,804 | 0.00 | 0 | |||||
| 2025-08-05 | 13F | Cherry Tree Wealth Management, LLC | 36 | 0.00 | 5 | 0.00 | ||||
| 2025-08-13 | 13F | Marshall Wace, Llp | Put | 32,600 | -83.06 | 4,101 | -83.83 | |||
| 2025-08-14 | 13F | Goldman Sachs Group Inc | Call | 99,900 | -85.00 | 12,567 | -85.68 | |||
| 2025-08-15 | 13F | Tower Research Capital LLC (TRC) | 12 | -99.84 | 2 | -99.90 | ||||
| 2025-04-25 | 13F | New Wave Wealth Advisors Llc | 0 | -100.00 | 0 | |||||
| 2025-07-18 | 13F | Client 1st Advisory Group, Llc | 0 | -100.00 | 0 | |||||
| 2025-08-11 | 13F | Banque Cantonale Vaudoise | 32,318 | -22.90 | 4 | -20.00 | ||||
| 2025-08-14 | 13F | DRW Securities, LLC | Call | 170,000 | 21,386 | |||||
| 2025-05-14 | 13F | Thomist Capital Management, LP | 0 | -100.00 | 0 | |||||
| 2025-08-06 | 13F | Black Swift Group, LLC | 0 | -100.00 | 0 | |||||
| 2025-08-13 | 13F | Marshall Wace, Llp | 10,580 | -66.10 | 1,331 | -67.65 | ||||
| 2025-08-14 | 13F | Goldman Sachs Group Inc | Put | 238,400 | -59.10 | 29,991 | -60.94 | |||
| 2025-08-15 | 13F | Ctc Llc | Call | 3,600 | -86.52 | 453 | -87.14 | |||
| 2025-07-24 | 13F | Stonebridge Financial Group, LLC | 0 | -100.00 | 0 | |||||
| 2025-05-28 | NP | THRIVENT SERIES FUND INC - Thrivent Global Stock Portfolio Class A | 1,077 | 0.00 | 142 | -0.70 | ||||
| 2025-07-10 | 13F | Rfg Holdings, Inc. | 11,465 | -11.81 | 1,442 | -15.87 | ||||
| 2025-06-26 | NP | OWSMX - Old Westbury Small & Mid Cap Strategies Fund | 102,937 | -3.61 | 11,396 | -20.45 | ||||
| 2025-08-05 | 13F | GPS Wealth Strategies Group, LLC | 200 | 0.00 | 25 | -3.85 | ||||
| 2025-08-13 | 13F | Baird Financial Group, Inc. | 0 | -100.00 | 0 | |||||
| 2025-08-08 | 13F | Capital Investment Counsel, Inc | 190 | 0.00 | 24 | -8.00 | ||||
| 2025-07-21 | 13F | Ping Capital Management, Inc. | 22,000 | 120.00 | 2,768 | 110.10 | ||||
| 2025-05-15 | 13F | Css Llc/il | Call | 0 | -100.00 | 0 | ||||
| 2025-08-13 | 13F | Renaissance Technologies Llc | 0 | -100.00 | 0 | |||||
| 2025-03-27 | NP | THMAX - Thrivent Moderate Allocation Fund Class A | 1,135 | -26.25 | 152 | -32.44 | ||||
| 2025-07-16 | 13F | Meridian Investment Counsel Inc. | 5,855 | 0.00 | 737 | -4.54 | ||||
| 2025-07-31 | 13F | Cambridge Investment Research Advisors, Inc. | 20,971 | -5.66 | 3 | 0.00 | ||||
| 2025-07-16 | 13F | ORG Wealth Partners, LLC | 11,523 | 24.34 | 1,465 | 19.01 | ||||
| 2025-08-05 | 13F | Wellington Shields Capital Management, LLC | 9,190 | 0.00 | 1,156 | -4.46 | ||||
| 2025-08-15 | 13F | Ctc Llc | Put | 5,000 | -92.60 | 629 | -92.93 | |||
| 2025-08-18 | 13F/A | National Bank Of Canada /fi/ | 10,321 | 31.41 | 1,298 | 25.53 | ||||
| 2025-05-28 | NP | GHTA - Goose Hollow Tactical Allocation ETF | 12,169 | 1,603 | ||||||
| 2025-08-04 | 13F | Bristlecone Advisors, LLC | 0 | -100.00 | 0 | |||||
| 2025-04-22 | 13F | Castleview Partners, Llc | 0 | -100.00 | 0 | |||||
| 2025-08-14 | 13F | Millennium Management Llc | Call | 491,400 | -21.83 | 61,818 | -25.33 | |||
| 2025-08-14 | 13F | Hara Capital LLC | 5,000 | 0.00 | 629 | -4.41 | ||||
| 2025-07-18 | 13F | TruNorth Capital Management, LLC | 1,300 | 0.00 | 164 | -4.68 | ||||
| 2025-05-14 | 13F | Van Hulzen Asset Management, LLC | 0 | -100.00 | 0 | -100.00 | ||||
| 2025-07-31 | 13F | Cardinal Point Capital Management, ULC | 2,150 | 270 | ||||||
| 2025-03-27 | NP | TMAAX - Thrivent Moderately Aggressive Allocation Fund Class A | 1,720 | -21.35 | 231 | -28.12 | ||||
| 2025-08-13 | 13F | Hbk Investments L P | Call | 83,300 | 10,479 | |||||
| 2025-08-13 | 13F | Hbk Investments L P | Put | 869,000 | 244.84 | 109,320 | 229.38 | |||
| 2025-08-19 | 13F | Anchor Investment Management, LLC | 331 | 0.00 | 42 | -4.65 | ||||
| 2025-04-22 | 13F | Verde Servicos Internacionais S.A. | 0 | -100.00 | 0 | |||||
| 2025-07-10 | 13F | Focus Financial Network, Inc. | 0 | -100.00 | 0 | |||||
| 2025-08-01 | 13F | Mizuho Markets Americas Llc | 5,697 | -12.10 | 717 | -16.06 | ||||
| 2025-08-01 | 13F | Centerpoint Advisors, LLC | 175 | 0.00 | 0 | |||||
| 2025-08-05 | 13F | Connable Office Inc | 0 | -100.00 | 0 | |||||
| 2025-05-28 | NP | THRIVENT SERIES FUND INC - Thrivent Moderate Allocation Portfolio Class A | 2,785 | 0.00 | 367 | -0.54 | ||||
| 2025-07-30 | 13F | Atlantic Edge Private Wealth Management, LLC | 171 | 0.00 | 22 | -4.55 | ||||
| 2025-07-28 | 13F | Harbour Investments, Inc. | 1,685 | 36.88 | 212 | 30.25 | ||||
| 2025-08-07 | 13F | Runnymede Capital Advisors, Inc. | 0 | -100.00 | 0 | |||||
| 2025-08-14 | 13F | Lazard Asset Management Llc | 7,463 | 1 | ||||||
| 2025-08-13 | 13F | Mackenzie Financial Corp | 6,000 | -4.76 | 755 | -9.05 | ||||
| 2025-08-01 | 13F | Banco Santander, S.A. | 10,282 | 24.00 | 1,293 | 18.41 | ||||
| 2025-08-14 | 13F | Elliott Investment Management L.P. | Put | 0 | -100.00 | 0 | -100.00 | |||
| 2025-05-13 | 13F | SFI Advisors, LLC | 0 | -100.00 | 0 | |||||
| 2025-08-12 | 13F | Ameritas Investment Partners, Inc. | 0 | -100.00 | 0 | |||||
| 2025-07-31 | 13F | Schneider Downs Wealth Management Advisors, LP | 2,361 | 297 | ||||||
| 2025-07-17 | 13F | Global Trust Asset Management, LLC | 1,030 | 130 | ||||||
| 2025-08-14 | 13F | Sig Brokerage, Lp | 0 | -100.00 | 0 | -100.00 | ||||
| 2025-05-30 | NP | ERNZ - TrueShares Active Yield ETF | 1,591 | 210 | ||||||
| 2025-07-18 | 13F | Access Financial Services, Inc. | 7,382 | -5.02 | 929 | -9.29 | ||||
| 2025-04-21 | 13F | Beacon Capital Management, LLC | 0 | -100.00 | 0 | |||||
| 2025-08-07 | 13F | Amica Mutual Insurance Co | 19,606 | 0.00 | 2 | 0.00 | ||||
| 2025-08-11 | 13F | Western Wealth Management, LLC | 1,824 | -22.68 | 229 | -26.13 | ||||
| 2025-07-22 | 13F | Rockingstone Advisors LLC | 5,660 | -7.44 | 712 | -11.55 | ||||
| 2025-07-07 | 13F | Kings Path Partners LLC | 1,280 | 0.00 | 161 | -4.17 | ||||
| 2025-07-23 | 13F | Massachusetts Wealth Management | 1,995 | -14.93 | 251 | -18.83 | ||||
| 2025-08-14 | 13F | Comerica Bank | 5,186 | 54.53 | 652 | 47.51 | ||||
| 2025-05-14 | 13F | Credit Agricole S A | 438 | -15.77 | 58 | -16.18 | ||||
| 2025-08-14 | 13F | Quantitative Investment Management, LLC | 4,922 | -95.15 | 1 | -100.00 | ||||
| 2025-08-14 | 13F | Stamos Capital Partners, L.p. | 29,427 | 91.57 | 3,702 | 82.95 | ||||
| 2025-07-18 | 13F | Truist Financial Corp | 22,275 | 10.85 | 2,802 | 5.90 | ||||
| 2025-08-14 | 13F | Murphy & Mullick Capital Management Corp | 10 | 1 | ||||||
| 2025-08-14 | 13F | Nomura Holdings Inc | Put | 0 | -100.00 | 0 | ||||
| 2025-08-14 | 13F | Goldman Sachs Group Inc | 3,738,398 | -1.45 | 470,290 | -5.87 | ||||
| 2025-07-21 | 13F | Ameritas Advisory Services, LLC | 4,815 | -17.80 | 606 | -21.83 | ||||
| 2025-08-04 | 13F | Prairie Wealth Advisors, Inc. | 1,857 | -3.88 | 234 | -8.27 | ||||
| 2025-07-15 | 13F | EWG Elevate Inc. | 14,363 | 1,807 | ||||||
| 2025-08-14 | 13F | Heritage Wealth Management, Inc. | 6,696 | 842 | ||||||
| 2025-08-14 | 13F | Nomura Holdings Inc | Call | 0 | -100.00 | 0 | ||||
| 2025-08-18 | 13F | Wolverine Trading, Llc | 12,252 | -45.75 | 1,558 | -47.20 | ||||
| 2025-08-14 | 13F/A | Barclays Plc | Put | 36,100 | -95.58 | 5 | -96.26 | |||
| 2025-06-26 | NP | OWACX - Old Westbury All Cap Core Fund | 54,048 | -5.41 | 5,984 | -21.95 | ||||
| 2025-08-14 | 13F/A | Barclays Plc | Call | 762,200 | 4,134.44 | 96 | 4,650.00 | |||
| 2025-08-14 | 13F | Sunbelt Securities, Inc. | 1,340 | -0.59 | 177 | 0.00 | ||||
| 2025-07-16 | 13F | Essex Financial Services, Inc. | 7,789 | -2.45 | 980 | -6.85 | ||||
| 2025-08-15 | 13F | Earnest Partners Llc | 40,094 | 0.00 | 5,044 | -4.49 | ||||
| 2025-08-14 | 13F/A | Barclays Plc | 1,298,655 | 8.54 | 163 | 3.82 | ||||
| 2025-07-21 | 13F | CenterStar Asset Management, LLC | 0 | -100.00 | 0 | |||||
| 2025-04-09 | 13F | Sanders Morris Harris Llc | 0 | -100.00 | 0 | |||||
| 2025-06-26 | NP | OWTEX - Old Westbury Total Equity Fund | 4,165 | 461 | ||||||
| 2025-05-13 | 13F | Franklin Resources Inc | 0 | -100.00 | 0 | |||||
| 2025-08-13 | 13F | Jones Financial Companies Lllp | 8,955 | 1.99 | 1,139 | -0.70 | ||||
| 2025-07-29 | 13F | International Assets Investment Management, Llc | 5,306 | -1.87 | 667 | -6.32 | ||||
| 2025-08-14 | 13F | Mariner, LLC | 7,590 | -10.42 | 955 | -14.44 | ||||
| 2025-08-18 | 13F | Wolverine Trading, Llc | Put | 553,100 | 94.62 | 70,354 | 89.43 | |||
| 2025-07-25 | 13F | RoundAngle Advisors LLC | 4,357 | -38.84 | 548 | -41.58 | ||||
| 2025-08-18 | 13F | Wolverine Trading, Llc | Call | 206,100 | -37.81 | 26,216 | -39.47 | |||
| 2025-08-27 | 13F/A | Squarepoint Ops LLC | 158,335 | 33.66 | 19,919 | 27.66 | ||||
| 2025-07-22 | 13F | Miracle Mile Advisors, LLC | 0 | -100.00 | 0 | |||||
| 2025-04-22 | 13F | Synergy Financial Management, LLC | 0 | -100.00 | 0 | |||||
| 2025-05-12 | 13F | Hirtle Callaghan & Co LLC | 0 | -100.00 | 0 | |||||
| 2025-08-27 | 13F/A | Squarepoint Ops LLC | Call | 31,500 | -18.39 | 3,963 | -22.07 | |||
| 2025-08-27 | 13F/A | Squarepoint Ops LLC | Put | 16,600 | -54.52 | 2,088 | -56.56 | |||
| 2025-08-07 | 13F | Allworth Financial LP | 636 | 759.46 | 80 | 900.00 | ||||
| 2025-08-04 | 13F | Kovack Advisors, Inc. | 0 | -100.00 | 0 | |||||
| 2025-08-19 | 13F | Marex Group plc | 66,889 | 8,415 | ||||||
| 2025-08-14 | 13F | Sig Brokerage, Lp | Call | 18,800 | 2,365 | |||||
| 2025-08-14 | 13F | Price T Rowe Associates Inc /md/ | 953,455 | 120 | ||||||
| 2025-08-07 | 13F | Zurcher Kantonalbank (Zurich Cantonalbank) | 2,107 | -2.00 | 268 | -4.29 | ||||
| 2025-08-14 | 13F | Balyasny Asset Management Llc | Call | 67,500 | -81.63 | 8,492 | -82.46 | |||
| 2025-08-14 | 13F | Millennium Management Llc | 22,000 | -80.18 | 2,768 | -81.07 | ||||
| 2025-08-14 | 13F | Balyasny Asset Management Llc | Put | 75,800 | -66.55 | 9,536 | -68.05 | |||
| 2025-05-08 | 13F | Menard Financial Group LLC | 0 | -100.00 | 0 | |||||
| 2025-08-14 | 13F | Millennium Management Llc | Put | 820,400 | 12.52 | 103,206 | 7.47 | |||
| 2025-07-01 | 13F | Harbor Investment Advisory, Llc | 800 | 0.00 | 101 | -4.76 | ||||
| 2025-04-21 | 13F | ORG Partners LLC | 0 | -100.00 | 0 | |||||
| 2025-08-14 | 13F | Waters Parkerson & Co., Llc | 2,500 | 0.00 | 314 | -4.56 | ||||
| 2025-05-06 | 13F | Genoa Capital Gestora de Recursos Ltda. | 0 | -100.00 | 0 | -100.00 | ||||
| 2025-08-13 | 13F | Scotia Capital Inc. | 5,825 | -6.49 | 733 | -10.73 | ||||
| 2025-07-30 | 13F | Brookstone Capital Management | 14,466 | -1.59 | 1,820 | -5.99 | ||||
| 2025-08-04 | 13F | Spire Wealth Management | 162 | -4.71 | 20 | -9.09 | ||||
| 2025-08-08 | 13F | Capital Investment Advisory Services, LLC | 417 | 0.00 | 52 | -3.70 | ||||
| 2025-08-14 | 13F | CTC Alternative Strategies, Ltd. | 0 | -100.00 | 0 | |||||
| 2025-08-14 | 13F | LMR Partners LLP | 0 | -100.00 | 0 | |||||
| 2025-08-05 | 13F | Dunhill Financial, LLC | 0 | -100.00 | 0 | |||||
| 2025-08-12 | 13F | Jefferies Financial Group Inc. | 3,218 | 0.00 | 405 | -4.49 | ||||
| 2025-08-13 | 13F | Global Endowment Management, LP | 2,700 | -32.50 | 340 | -35.55 | ||||
| 2025-08-14 | 13F | Balyasny Asset Management Llc | 0 | -100.00 | 0 | |||||
| 2025-05-08 | 13F | Jefferies Financial Group Inc. | Call | 0 | -100.00 | 0 | -100.00 | |||
| 2025-07-22 | 13F | Merit Financial Group, LLC | 7,547 | -0.11 | 949 | -4.62 | ||||
| 2025-04-25 | 13F | WASHINGTON TRUST Co | 0 | -100.00 | 0 | |||||
| 2025-07-31 | 13F | Optimum Investment Advisors | 100 | 0.00 | 13 | -7.69 | ||||
| 2025-08-08 | 13F | Allianz Se | 51,025 | 33.49 | 6,419 | 27.49 | ||||
| 2025-08-14 | 13F | DRW Securities, LLC | 0 | -100.00 | 0 | -100.00 | ||||
| 2025-08-11 | 13F | Y.D. More Investments Ltd | 12,000 | 0.00 | 1,510 | -4.49 | ||||
| 2025-08-12 | 13F | Eisler Capital Management Ltd. | Put | 52,800 | -34.08 | 6,646 | -37.01 | |||
| 2025-08-14 | 13F | Warren Averett Asset Management, LLC | 1,885 | -10.32 | 237 | -14.13 | ||||
| 2025-07-14 | 13F | Armstrong Advisory Group, Inc | 430 | -67.98 | 54 | -69.49 | ||||
| 2025-08-12 | 13F | Eisler Capital Management Ltd. | 15,132 | -60.75 | 1,905 | -62.50 | ||||
| 2025-08-06 | 13F | AE Wealth Management LLC | 2,617 | -6.10 | 329 | -10.35 | ||||
| 2025-08-12 | 13F | Park Square Financial Group, LLC | 150 | 0.00 | 19 | -5.26 | ||||
| 2025-05-01 | 13F | Quest 10 Wealth Builders, Inc. | 14 | 0.00 | 2 | 0.00 | ||||
| 2025-08-14 | 13F | Alpine Global Management, LLC | 3,081 | 388 | ||||||
| 2025-08-11 | 13F | Rothschild Investment Llc | 253 | 0.00 | 32 | -6.06 | ||||
| 2025-05-08 | 13F | Private Advisory Group LLC | 0 | -100.00 | 0 | -100.00 | ||||
| 2025-08-14 | 13F | UBS Group AG | 1,538,586 | 7.11 | 193,554 | 2.30 | ||||
| 2025-08-14 | 13F | UBS Group AG | Call | 139,900 | -36.64 | 17,599 | -39.48 | |||
| 2025-07-23 | 13F | Tyche Wealth Partners LLC | 0 | -100.00 | 0 | |||||
| 2025-08-11 | 13F | Perennial Investment Advisors, LLC | 0 | -100.00 | 0 | |||||
| 2025-08-14 | 13F | Tudor Investment Corp Et Al | 44,279 | -43.23 | 5,570 | -45.78 | ||||
| 2025-05-16 | 13F | Empowered Funds, LLC | 0 | -100.00 | 0 | |||||
| 2025-08-01 | 13F | Advisory Alpha, LLC | 2,423 | -4.72 | 305 | -8.98 | ||||
| 2025-08-08 | 13F | MTM Investment Management, LLC | 10 | 0.00 | 1 | 0.00 | ||||
| 2025-08-14 | 13F | Tudor Investment Corp Et Al | Put | 105,000 | 0.00 | 13,209 | -4.48 | |||
| 2025-08-14 | 13F | Toronto Dominion Bank | 5,051 | -30.33 | 635 | -33.44 | ||||
| 2025-03-27 | NP | TMCGX - Thrivent Mid Cap Growth Fund Class S | 515 | -13.15 | 69 | -19.77 | ||||
| 2025-07-29 | 13F | Stratos Wealth Partners, LTD. | 0 | -100.00 | 0 | |||||
| 2025-08-14 | 13F | Toronto Dominion Bank | Put | 400,000 | 0.00 | 50,320 | -4.46 | |||
| 2025-08-14 | 13F | UBS Group AG | Put | 317,700 | 37.53 | 39,967 | 31.36 | |||
| 2025-08-14 | 13F | Parallax Volatility Advisers, L.P. | Put | 84,800 | -76.22 | 10,668 | -77.29 | |||
| 2025-04-29 | 13F | Lee Danner & Bass Inc | 0 | -100.00 | 0 | -100.00 | ||||
| 2025-08-14 | 13F | SWAN Capital LLC | 20 | 0.00 | 3 | 0.00 | ||||
| 2025-08-14 | 13F | CoreCap Advisors, LLC | 123 | 0.00 | 15 | -6.25 | ||||
| 2025-07-17 | 13F | Sound Income Strategies, LLC | 39 | 95.00 | 5 | 100.00 | ||||
| 2025-08-14 | 13F | State Of Wisconsin Investment Board | Call | 166,400 | 20,933 | |||||
| 2025-07-24 | 13F | Us Bancorp \de\ | 4,521 | 5.98 | 569 | 1.25 | ||||
| 2025-08-14 | 13F | Parallax Volatility Advisers, L.P. | 1 | -100.00 | 0 | -100.00 | ||||
| 2025-08-07 | 13F | Winthrop Capital Management, LLC | 236 | 84.38 | 0 | |||||
| 2025-08-13 | 13F | Luminist Capital LLC | 74 | 0.00 | 9 | 0.00 | ||||
| 2025-05-15 | 13F | Discovery Capital Management, Llc / Ct | 0 | -100.00 | 0 | |||||
| 2025-08-14 | 13F | First Manhattan Co | 0 | -100.00 | 0 | |||||
| 2025-08-14 | 13F | Boothbay Fund Management, Llc | 17,951 | -12.43 | 2,258 | -16.37 | ||||
| 2025-07-30 | 13F | Phoenix Holdings Ltd. | 0 | -100.00 | 0 | |||||
| 2025-08-05 | 13F | Bank Of Montreal /can/ | 63,496 | 12.54 | 7,988 | 7.48 | ||||
| 2025-08-14 | 13F | Ausdal Financial Partners, Inc. | 10,385 | 3.60 | 1,306 | -1.06 | ||||
| 2025-06-10 | 13F/A | Militia Capital Partners, LP | Put | 0 | -100.00 | 0 | -100.00 | |||
| 2025-05-15 | 13F | Claar Advisors LLC | 0 | -100.00 | 0 | |||||
| 2025-08-14 | 13F | Parallax Volatility Advisers, L.P. | Call | 105,500 | 78.51 | 13,272 | 70.49 | |||
| 2025-07-24 | 13F | Blair William & Co/il | 289 | -19.72 | 36 | -23.40 | ||||
| 2025-08-14 | 13F | Wells Fargo & Company/mn | 716,345 | -15.29 | 90,116 | -19.09 | ||||
| 2025-07-14 | 13F | E&G Advisors, LP | 7,230 | -0.14 | 910 | -4.62 | ||||
| 2025-08-11 | 13F | Nations Financial Group Inc, /ia/ /adv | 3,073 | -4.83 | 387 | -9.18 | ||||
| 2025-05-14 | 13F | Trexquant Investment LP | 0 | -100.00 | 0 | |||||
| 2025-08-14 | 13F/A | Perritt Capital Management Inc | 9 | 0.00 | 1 | 0.00 | ||||
| 2025-08-14 | 13F | Great Valley Advisor Group, Inc. | 4,188 | -8.84 | 526 | -13.06 | ||||
| 2025-08-13 | 13F | Level Four Advisory Services, Llc | 1,595 | -12.60 | 201 | -16.67 | ||||
| 2025-03-27 | NP | TAAAX - Thrivent Aggressive Allocation Fund Class A | 1,735 | -17.62 | 233 | -24.68 | ||||
| 2025-08-01 | 13F | Transcend Wealth Collective, Llc | 0 | -100.00 | 0 | |||||
| 2025-08-14 | 13F | Ameriprise Financial Inc | 6,243 | -30.22 | 785 | -33.19 | ||||
| 2025-04-11 | 13F | Lake Hills Wealth Management, LLC | 0 | -100.00 | 0 | -100.00 | ||||
| 2025-05-14 | 13F | HAP Trading, LLC | Call | 0 | -100.00 | 0 | -100.00 | |||
| 2025-08-13 | 13F | Walleye Trading LLC | Call | 169,600 | -45.85 | 21,336 | -48.28 | |||
| 2025-08-05 | 13F | Wakefield Asset Management LLLP | 2,504 | 315 | ||||||
| 2025-08-13 | 13F | Walleye Trading LLC | Put | 269,200 | 64.95 | 33,865 | 57.55 | |||
| 2025-08-13 | 13F | Walleye Trading LLC | 22,162 | 2,788 | ||||||
| 2025-04-28 | 13F | First Horizon Advisors, Inc. | 0 | -100.00 | 0 | -100.00 | ||||
| 2025-05-07 | 13F/A | Symmetry Investments LP | 0 | -100.00 | 0 | |||||
| 2025-07-29 | 13F | Calamos Wealth Management LLC | 6,600 | 0.00 | 830 | -4.49 | ||||
| 2025-04-22 | 13F | Woodmont Investment Counsel Llc | 0 | -100.00 | 0 | |||||
| 2025-07-30 | 13F | Whittier Trust Co Of Nevada Inc | 1,670 | 0.00 | 210 | -4.11 | ||||
| 2025-08-11 | 13F | Citigroup Inc | 2,106,198 | -5.00 | 264,960 | -9.26 | ||||
| 2025-08-11 | 13F | Citigroup Inc | Put | 103,200 | -61.28 | 12,983 | -63.01 | |||
| 2025-08-11 | 13F | Citigroup Inc | Call | 150,900 | 201.80 | 18,983 | 188.28 | |||
| 2025-08-13 | 13F | Continuum Advisory, LLC | 0 | -100.00 | 0 | |||||
| 2025-05-15 | 13F | Rokos Capital Management LLP | 0 | -100.00 | 0 | -100.00 | ||||
| 2025-08-05 | 13F | Mirae Asset Securities (usa) Inc. | 650,000 | 0.00 | 81,770 | -4.49 | ||||
| 2025-07-08 | 13F | Nbc Securities, Inc. | 351 | 51.29 | 0 | |||||
| 2025-04-21 | 13F | PSI Advisors, LLC | 0 | -100.00 | 0 | |||||
| 2025-05-15 | 13F | Rokos Capital Management LLP | Put | 0 | -100.00 | 0 | -100.00 | |||
| 2025-05-14 | 13F | Barometer Capital Management Inc. | 0 | -100.00 | 0 | |||||
| 2025-08-12 | 13F | Founders Financial Alliance, LLC | 2,526 | -0.16 | 318 | -4.80 | ||||
| 2025-07-10 | 13F | Secure Asset Management, LLC | 3,028 | 381 | ||||||
| 2025-08-14 | 13F | J. Goldman & Co LP | 3,369 | -61.31 | 424 | -63.09 | ||||
| 2025-08-12 | 13F | CIBC Private Wealth Group, LLC | 152 | -40.62 | 19 | -26.92 | ||||
| 2025-07-17 | 13F | Janney Montgomery Scott LLC | 9,558 | 31.00 | 1 | |||||
| 2025-08-14 | 13F | Condire Management, LP | 0 | -100.00 | 0 | |||||
| 2025-07-25 | 13F | Cwm, Llc | 2,666 | -87.44 | 0 | -100.00 | ||||
| 2025-08-12 | 13F | MAI Capital Management | 1,339 | 7.46 | 168 | 2.44 | ||||
| 2025-07-24 | 13F | Acima Private Wealth, Llc | 17,944 | 0.00 | 2,257 | -4.49 | ||||
| 2025-08-13 | 13F | Cresset Asset Management, LLC | 2,037 | 21.03 | 256 | 15.84 | ||||
| 2025-05-06 | 13F | Venturi Wealth Management, LLC | 0 | -100.00 | 0 | |||||
| 2025-07-24 | 13F | Ulland Investment Advisors, LLC | 25 | -46.81 | 0 | |||||
| 2025-08-14 | 13F | Maven Securities LTD | 4,568 | -83.67 | 575 | -84.41 | ||||
| 2025-07-18 | 13F | Provident Wealth Management, LLC | 455 | -1.52 | 57 | -5.00 | ||||
| 2025-07-16 | 13F | Cresta Advisors, Ltd. | 2,100 | 0.00 | 264 | -4.35 | ||||
| 2025-08-14 | 13F | York Capital Management Global Advisors, LLC | Put | 150,000 | 0.00 | 18,870 | -4.48 | |||
| 2025-08-18 | 13F | N.E.W. Advisory Services LLC | 28 | -50.00 | 4 | -57.14 | ||||
| 2025-05-02 | 13F | BlackRock, Inc. | 0 | -100.00 | 0 | -100.00 | ||||
| 2025-08-25 | 13F/A | Neuberger Berman Group LLC | 6,561 | 63.58 | 825 | 56.25 | ||||
| 2025-08-13 | 13F | Willis Johnson & Associates, Inc. | 2,436 | -4.92 | 306 | -9.20 | ||||
| 2025-08-07 | 13F | BOK Financial Private Wealth, Inc. | 0 | -100.00 | 0 | |||||
| 2025-08-01 | 13F | Mizuho Markets Cayman LP | 2,566 | 323 | ||||||
| 2025-08-18 | 13F | Geneos Wealth Management Inc. | 226 | -37.74 | 28 | -40.43 | ||||
| 2025-08-12 | 13F | Southeast Asset Advisors Inc. | 59,960 | 8.74 | 7,543 | 3.86 | ||||
| 2025-07-17 | 13F/A | RK Capital Management, LLC/FL | 0 | -100.00 | 0 | -100.00 | ||||
| 2025-07-08 | 13F | Lowe Wealth Advisors, LLC | 612 | -51.27 | 77 | -53.94 | ||||
| 2025-08-11 | 13F | Principal Securities, Inc. | 8,714 | 54.09 | 1,096 | 46.52 | ||||
| 2025-08-14 | 13F | Mercer Global Advisors Inc /adv | 12,565 | -46.20 | 1,581 | -48.63 | ||||
| 2025-05-05 | 13F | Transce3nd, LLC | 0 | -100.00 | 0 | |||||
| 2025-08-11 | 13F | Waratah Capital Advisors Ltd. | Call | 100,000 | 12,580 | |||||
| 2025-08-14 | 13F | Optiver Holding B.V. | 8,311 | -42.13 | 1,046 | -44.74 | ||||
| 2025-08-07 | 13F | LOM Asset Management Ltd | 880 | 0 | ||||||
| 2025-07-07 | 13F | Global Wealth Strategies & Associates | 160 | 0.00 | 20 | -4.76 | ||||
| 2025-07-23 | 13F | Friedenthal Financial | 22 | 83.33 | 3 | 100.00 | ||||
| 2025-08-05 | 13F | Huntington National Bank | 0 | |||||||
| 2025-08-14 | 13F | Concorde Financial Corp | 3,462 | 0.00 | 436 | -4.40 | ||||
| 2025-08-15 | 13F | CI Private Wealth, LLC | 37,142 | 496.66 | 4,673 | 469.76 | ||||
| 2025-07-25 | 13F | Stephens Consulting, LLC | 118 | 293.33 | 15 | 366.67 | ||||
| 2025-08-14 | 13F | SoftVest Advisors, LLC | Put | 868,000 | -50.68 | 109,194 | -52.89 | |||
| 2025-07-18 | 13F | Parkside Investments, LLC | 2,500 | -33.77 | 314 | -36.82 | ||||
| 2025-08-13 | 13F | Marshall Wace, Llp | Call | 0 | -100.00 | 0 | -100.00 | |||
| 2025-08-12 | 13F | Inscription Capital, LLC | 0 | -100.00 | 0 | |||||
| 2025-08-12 | 13F | XTX Topco Ltd | 19,745 | 2,484 | ||||||
| 2025-07-15 | 13F | North Star Investment Management Corp. | 597 | 0.17 | 75 | -3.85 | ||||
| 2025-08-11 | 13F | Strategic Wealth Partners, Ltd. | 146 | 18 | ||||||
| 2025-05-15 | 13F | Tudor Investment Corp Et Al | Call | 0 | -100.00 | 0 | -100.00 | |||
| 2025-04-24 | 13F | Cushing Asset Management, Lp | Call | 0 | -100.00 | 0 | ||||
| 2025-08-13 | 13F | Satovsky Asset Management Llc | 57,730 | 1.88 | 7,262 | -2.69 | ||||
| 2025-08-14 | 13F | EP Wealth Advisors, Inc. | 292,149 | 0.91 | 36,752 | -3.62 | ||||
| 2025-08-19 | 13F | National Asset Management, Inc. | 1,807 | 227 | ||||||
| 2025-08-14 | 13F | Mml Investors Services, Llc | 40,086 | -38.11 | 5 | -37.50 | ||||
| 2025-05-15 | 13F | Verition Fund Management LLC | Call | 0 | -100.00 | 0 | -100.00 | |||
| 2025-08-14 | 13F | Boothbay Fund Management, Llc | Put | 7,000 | 881 | |||||
| 2025-08-01 | 13F | Ashton Thomas Private Wealth, LLC | 28,492 | 1,703.29 | 3,584 | 1,623.08 | ||||
| 2025-08-29 | 13F | Centaurus Financial, Inc. | 3,222 | -3.91 | 0 | |||||
| 2025-08-14 | 13F | Fmr Llc | 1,170 | -8.02 | 147 | -11.98 | ||||
| 2025-08-06 | 13F | Walkner Condon Financial Advisors LLC | 1,960 | 0.00 | 247 | -4.65 | ||||
| 2025-08-12 | 13F | Bokf, Na | 200 | 0.00 | 25 | -3.85 | ||||
| 2025-07-17 | 13F | Oakworth Capital, Inc. | 232 | -99.88 | 29 | -99.89 | ||||
| 2025-08-14 | 13F | Wells Fargo & Company/mn | Call | 30,000 | -92.94 | 3,774 | -93.25 | |||
| 2025-08-14 | 13F | Wells Fargo & Company/mn | Put | 748,200 | -8.34 | 94,124 | -12.46 | |||
| 2025-07-22 | 13F | Coastal Investment Advisors, Inc. | 0 | -100.00 | 0 | |||||
| 2025-08-18 | 13F | Hollencrest Capital Management | 283 | 0.71 | 36 | -5.41 | ||||
| 2025-08-14 | 13F | Sourcerock Group LLC | 17,951 | -12.43 | 2,258 | -16.37 | ||||
| 2025-08-08 | 13F | Ogorek Anthony Joseph /ny/ /adv | 253 | 0.40 | 0 | |||||
| 2025-08-12 | 13F | Archer Investment Corp | 121 | 0.00 | 15 | 0.00 | ||||
| 2025-08-12 | 13F | Cadence Wealth Management LLC | 25,526 | 3.88 | 3,211 | -0.77 | ||||
| 2025-08-05 | 13F | Arrowroot Family Office, LLC | 7,837 | 1.01 | 986 | -4.00 | ||||
| 2025-08-12 | 13F | LPL Financial LLC | 190,876 | -9.07 | 24,012 | -13.15 | ||||
| 2025-08-01 | 13F | Anson Capital, Inc. | 9,992 | 56.96 | 1,257 | 50.00 | ||||
| 2025-07-03 | 13F | Fiduciary Financial Group, Llc | 2,026 | 0.85 | 257 | 22.97 | ||||
| 2025-08-11 | 13F | Wealthspire Advisors, LLC | 1,696 | 213 | ||||||
| 2025-07-17 | 13F | Enclave Advisors LLC | 0 | -100.00 | 0 | |||||
| 2025-08-13 | 13F | Congress Wealth Management LLC / DE / | 9,202 | 4.68 | 1,158 | -0.09 | ||||
| 2025-05-13 | 13F | Ground Swell Capital, LLC | 0 | -100.00 | 0 | |||||
| 2025-07-18 | 13F | Centricity Wealth Management, LLC | 21 | 0.00 | 3 | 0.00 | ||||
| 2025-07-08 | 13F/A | Salem Investment Counselors Inc | 2,295 | 0.00 | 289 | -4.64 | ||||
| 2025-08-11 | 13F | Private Advisor Group, LLC | Put | 0 | -100.00 | 0 | ||||
| 2025-08-15 | 13F | Nikulski Financial, Inc. | 2,945 | 370 | ||||||
| 2025-05-28 | NP | THRIVENT SERIES FUND INC - Thrivent Aggressive Allocation Portfolio Class A | 1,435 | 0.00 | 189 | 0.00 | ||||
| 2025-08-26 | NP | PRAFX - T. Rowe Price Real Assets Fund, Inc. This fund is a listed as child fund of Price T Rowe Associates Inc /md/ and if that institution has disclosed ownership in this security, then these positions will not be double counted when calculating total shares and total value | 371,526 | 116.64 | 46,738 | 107.21 | ||||
| 2025-04-21 | 13F | Nelson, Van Denburg & Campbell Wealth Management Group, LLC | 0 | -100.00 | 0 | |||||
| 2025-08-14 | 13F | Aster Capital Management (DIFC) Ltd | 26,065 | 3,279 | ||||||
| 2025-08-13 | 13F | Capital Fund Management S.a. | 0 | -100.00 | 0 | -100.00 | ||||
| 2025-07-08 | 13F | Ballew Advisors, Inc | 0 | -100.00 | 0 | |||||
| 2025-08-13 | 13F | Capital Fund Management S.a. | Call | 0 | -100.00 | 0 | -100.00 | |||
| 2025-08-04 | 13F | MeadowBrook Investment Advisors LLC | 0 | -100.00 | 0 |
Other Listings
| MX:XOP |