Mga Batayang Estadistika
| Pemilik Institusional | 451 total, 446 long only, 0 short only, 5 long/short - change of -0.44% MRQ |
| Alokasi Portofolio Rata-rata | 0.2717 % - change of -12.10% MRQ |
| Saham Institusional (Jangka Panjang) | 1,591,511,211 (ex 13D/G) - change of -105.99MM shares -6.24% MRQ |
| Nilai Institusional (Jangka Panjang) | $ 3,816,100 USD ($1000) |
Kepemilikan Institusional dan Pemegang Saham
Ambev S.A. - Depositary Receipt (Common Stock) (US:ABEV) memiliki 451 pemilik institusional dan pemegang saham yang telah mengajukan formulir 13D/G atau 13F kepada Komisi Bursa Efek (Securities Exchange Commission/SEC). Lembaga-lembaga ini memegang total 1,591,511,211 saham. Pemegang saham terbesar meliputi First Eagle Investment Management, LLC, SGENX - First Eagle Global Fund Class A, GQG Partners LLC, GQGPX - GQG PARTNERS EMERGING MARKETS EQUITY FUND Investor Shares, SGOVX - First Eagle Overseas Fund Class A, Renaissance Technologies Llc, Arrowstreet Capital, Limited Partnership, Massachusetts Financial Services Co /ma/, Seafarer Capital Partners, LLC, and Morgan Stanley .
Struktur kepemilikan institusional Ambev S.A. - Depositary Receipt (Common Stock) (NYSE:ABEV) menunjukkan posisi terkini di perusahaan oleh institusi dan dana, serta perubahan terbaru dalam ukuran posisi. Pemegang saham utama dapat mencakup investor individu, reksa dana, dana lindung nilai, atau institusi. Jadwal 13D menunjukkan bahwa investor memegang (atau pernah memegang) lebih dari 5% saham perusahaan dan bermaksud (atau pernah bermaksud) untuk secara aktif mengejar perubahan strategi bisnis. Jadwal 13G menunjukkan investasi pasif lebih dari 5%.
The share price as of September 5, 2025 is 2.23 / share. Previously, on September 6, 2024, the share price was 2.33 / share. This represents a decline of 4.29% over that period.

Skor Sentimen Dana
Skor Sentimen Dana (sebelumnya dikenal sebagai Skor Akumulasi Kepemilikan) menemukan saham-saham yang paling banyak dibeli oleh dana. Ini adalah hasil dari model kuantitatif multi-faktor yang canggih yang mengidentifikasi perusahaan dengan tingkat akumulasi institusional tertinggi. Model penilaian menggunakan kombinasi dari total peningkatan pemilik yang diungkapkan, perubahan dalam alokasi portofolio pada pemilik tersebut, dan metrik lainnya. Angka berkisar dari 0 hingga 100, dengan angka yang lebih tinggi menunjukkan tingkat akumulasi yang lebih tinggi dibandingkan dengan perusahaan sejenisnya, dan 50 adalah rata-ratanya.
Frekuensi Pembaruan: Setiap Hari
Lihat Ownership Explorer, yang menyediakan daftar perusahaan dengan peringkat tertinggi.
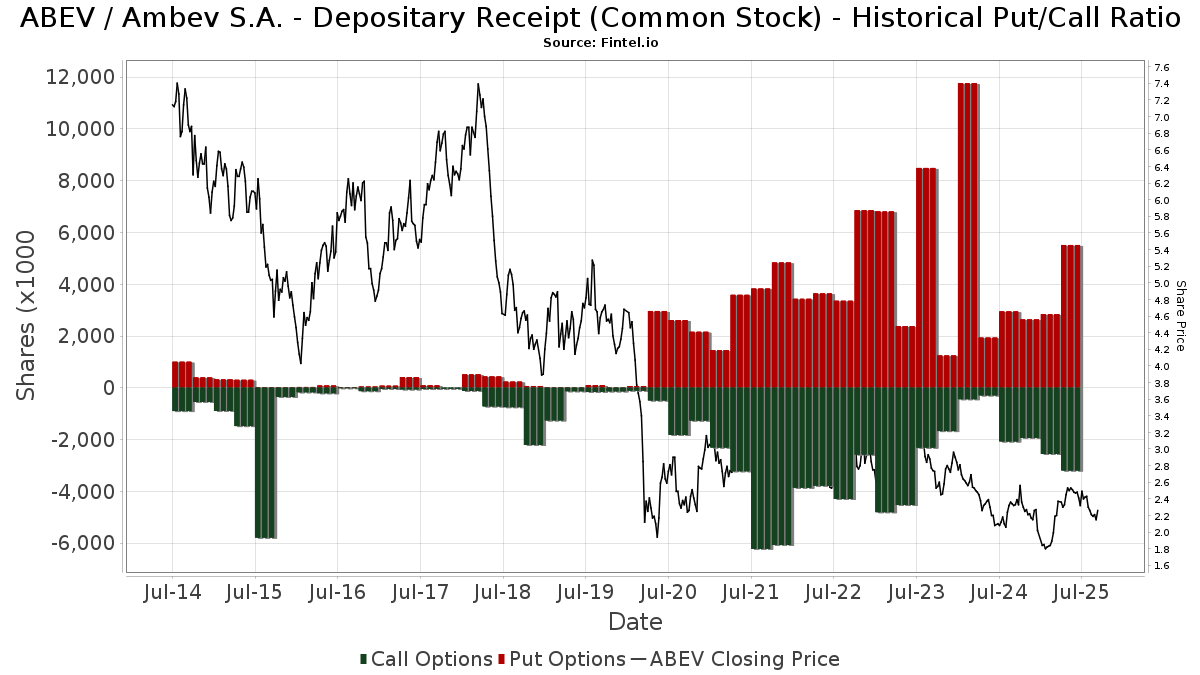
Rasio Put/Call Institusional
Selain melaporkan isu ekuitas dan utang standar, institusi dengan aset di bawah manajemen lebih dari 100 juta dolar AS juga harus mengungkapkan kepemilikan opsi put dan call mereka. Karena opsi put umumnya menunjukkan sentimen negatif, dan opsi call menunjukkan sentimen positif, kita dapat mengetahui sentimen institusional secara keseluruhan dengan memplot rasio put terhadap call. Grafik di sebelah kanan memplot rasio put/call historis untuk instrumen ini.
Menggunakan Rasio Put/Call sebagai indikator sentimen investor mengatasi salah satu kekurangan utama dari penggunaan total kepemilikan institusional, yaitu sejumlah besar aset yang dikelola diinvestasikan secara pasif untuk melacak indeks. Dana yang dikelola secara pasif biasanya tidak membeli opsi, sehingga indikator rasio put/call lebih akurat dalam melacak sentimen dana yang dikelola secara aktif.
Pengajuan 13F dan NPORT
Detail pada pengajuan 13F tersedia gratis. Detail pada pengajuan NP memerlukan keanggotaan premium. Baris berwarna hijau menunjukkan posisi baru. Baris berwarna merah menunjukkan posisi yang sudah ditutup. Klik tautan ini ikon untuk melihat riwayat transaksi selengkapnya.
Tingkatkan
untuk membuka data premium dan mengekspor ke Excel ![]() .
.
| Tanggal File | Sumber | Investor | Ketik | Presyo ng Avg (Silangan) |
Saham | Δ Saham (%) |
Dilaporkan Nilai ($1000) |
Nilai Δ (%) |
Alokasi Port (%) |
|
|---|---|---|---|---|---|---|---|---|---|---|
| 2025-08-26 | NP | Profunds - Profund Vp Emerging Markets | 75,297 | 15.27 | 181 | 19.08 | ||||
| 2025-08-15 | 13F | Morgan Stanley | 28,022,484 | 32.77 | 67,534 | 37.33 | ||||
| 2025-05-07 | 13F | Pin Oak Investment Advisors Inc | 0 | -100.00 | 0 | |||||
| 2025-06-30 | NP | VEU - Vanguard FTSE All-World ex-US Index Fund ETF Shares | 3,139,140 | -1.53 | 7,942 | 34.68 | ||||
| 2025-05-13 | 13F | Arrowpoint Investment Partners (Singapore) Pte. Ltd. | 0 | -100.00 | 0 | |||||
| 2025-05-16 | 13F/A | Kestra Investment Management, LLC | 0 | -100.00 | 0 | -100.00 | ||||
| 2025-08-05 | 13F | Simplex Trading, Llc | 19,969 | -87.69 | 0 | |||||
| 2025-08-05 | 13F | Simplex Trading, Llc | Call | 67,800 | 0.00 | 0 | ||||
| 2025-08-19 | 13F | State of Wyoming | 78,437 | 98.04 | 189 | 105.43 | ||||
| 2025-08-04 | 13F | GAM Holding AG | 48,000 | 116 | ||||||
| 2025-07-08 | 13F | Baker Ellis Asset Management LLC | 42,000 | 0.00 | 101 | 4.12 | ||||
| 2025-05-12 | 13F | Peapack Gladstone Financial Corp | 0 | -100.00 | 0 | |||||
| 2025-08-14 | 13F | Atomi Financial Group, Inc. | 154,903 | 32.47 | 373 | 37.13 | ||||
| 2025-08-18 | 13F | Wolverine Trading, Llc | Put | 0 | -100.00 | 0 | -100.00 | |||
| 2025-08-14 | 13F | Henry James International Management Inc. | 15,173 | 1.28 | 37 | 5.88 | ||||
| 2025-07-10 | 13F | Exchange Traded Concepts, Llc | 2,326,308 | 177.31 | 5,606 | 186.90 | ||||
| 2025-07-15 | 13F | North Star Investment Management Corp. | 3,800 | 0.00 | 9 | 12.50 | ||||
| 2025-08-14 | 13F | GWM Advisors LLC | 19,420 | 21.75 | 47 | 24.32 | ||||
| 2025-07-07 | 13F | Investors Research Corp | 220,775 | 0.00 | 532 | 3.50 | ||||
| 2025-05-15 | 13F | Angeles Investment Advisors, LLC | 0 | -100.00 | 0 | |||||
| 2025-07-11 | 13F | Caldwell Securities, Inc | 111 | 0.00 | 0 | |||||
| 2025-06-27 | NP | DIVD - Altrius Global Dividend ETF | 87,752 | 68.32 | 222 | 131.25 | ||||
| 2025-08-06 | 13F | Paradigm Asset Management Co Llc | 17,935 | 0.00 | 43 | 4.88 | ||||
| 2025-07-21 | 13F | Qrg Capital Management, Inc. | 162,769 | 172.91 | 392 | 184.06 | ||||
| 2025-08-11 | 13F | Regal Investment Advisors LLC | 11,043 | -59.73 | 27 | -58.73 | ||||
| 2025-08-18 | 13F | Wolverine Trading, Llc | 0 | -100.00 | 0 | -100.00 | ||||
| 2025-07-29 | 13F | Aspiriant, Llc | 26,603 | 0.38 | 64 | 4.92 | ||||
| 2025-05-06 | 13F | One Wealth Advisors, LLC | 0 | -100.00 | 0 | |||||
| 2025-08-15 | 13F | CI Private Wealth, LLC | 2,927,709 | 1.71 | 7,056 | 5.20 | ||||
| 2025-08-05 | 13F | Bank Of Montreal /can/ | 551,237 | 0.12 | 1,328 | 3.59 | ||||
| 2025-08-08 | 13F | Geode Capital Management, Llc | 58,937 | -65.96 | 142 | -64.76 | ||||
| 2025-06-23 | NP | UUPIX - Ultraemerging Markets Profund Investor Class | 17,517 | 5.27 | 44 | 46.67 | ||||
| 2025-07-28 | 13F | Harbour Investments, Inc. | 247 | 0.00 | 1 | |||||
| 2025-08-12 | 13F | Brandywine Global Investment Management, LLC | 17,187,221 | -2.32 | 41,421 | 1.03 | ||||
| 2025-04-14 | 13F | Sivia Capital Partners, LLC | 0 | -100.00 | 0 | |||||
| 2025-07-28 | NP | AVSE - Avantis Responsible Emerging Markets Equity ETF | 33,693 | 13.25 | 82 | 34.43 | ||||
| 2025-07-08 | 13F/A | Salem Investment Counselors Inc | 4,000 | -4.76 | 10 | 0.00 | ||||
| 2025-08-06 | 13F | First Horizon Advisors, Inc. | 936 | -50.81 | 2 | -50.00 | ||||
| 2025-08-15 | 13F | Tower Research Capital LLC (TRC) | 27,392 | 66 | ||||||
| 2025-08-14 | 13F | Jane Street Group, Llc | Put | 165,800 | 400 | |||||
| 2025-07-23 | 13F | Bear Mountain Capital, Inc. | 30 | 0.00 | 0 | |||||
| 2025-08-14 | 13F | Jane Street Group, Llc | Call | 54,000 | 23.57 | 130 | 28.71 | |||
| 2025-08-14 | 13F | UBS Group AG | 11,586,720 | -19.81 | 27,924 | -17.06 | ||||
| 2025-08-14 | 13F | CIBC World Markets Inc. | 5,485,106 | 1.27 | 13,219 | 4.75 | ||||
| 2025-07-21 | 13F | Riverview Trust Co | 31,548 | 0.00 | 76 | 4.11 | ||||
| 2025-03-31 | NP | VIHAX - Vanguard International High Dividend Yield Index Fund Admiral Shares | 348 | 0.00 | 1 | |||||
| 2025-07-14 | 13F | Abound Wealth Management | 78 | 0.00 | 0 | |||||
| 2025-08-14 | 13F | Van Eck Associates Corp | 1,193,934 | 72.86 | 3 | 100.00 | ||||
| 2025-06-25 | NP | SFGIX - Seafarer Overseas Growth and Income Fund Investor | 28,000,000 | -3.45 | 70,840 | 32.04 | ||||
| 2025-04-25 | 13F | New Wave Wealth Advisors Llc | 0 | -100.00 | 0 | |||||
| 2025-08-13 | 13F | Loomis Sayles & Co L P | 18,092,234 | -0.98 | 43,602 | 103,714.29 | ||||
| 2025-07-29 | 13F | Stephens Inc /ar/ | 215,041 | 0.68 | 518 | 4.23 | ||||
| 2025-08-29 | NP | LIVR - Intelligent Livermore ETF | 65,040 | 157 | ||||||
| 2025-08-04 | 13F | Assetmark, Inc | 171,943 | 149.74 | 414 | 158.75 | ||||
| 2025-04-10 | 13F | Sugar Maple Asset Management, LLC | 0 | -100.00 | 0 | |||||
| 2025-08-13 | 13F | West Family Investments, Inc. | 46,928 | 113 | ||||||
| 2025-08-19 | NP | RIFAX - U.S. Strategic Equity Fund | 314,182 | 6.18 | 757 | 9.87 | ||||
| 2025-08-14 | 13F | Two Sigma Securities, Llc | 634,330 | 137.07 | 1,529 | 145.26 | ||||
| 2025-08-28 | NP | GQGPX - GQG PARTNERS EMERGING MARKETS EQUITY FUND Investor Shares | 86,666,901 | -15.40 | 208,867 | 10.21 | ||||
| 2025-06-26 | NP | DFAX - Dimensional World ex U.S. Core Equity 2 ETF | 147,706 | 0.00 | 374 | 36.63 | ||||
| 2025-08-18 | 13F/A | National Bank Of Canada /fi/ | 104,032 | 53.75 | 250 | 59.62 | ||||
| 2025-08-13 | 13F | Kiltearn Partners LLP | 10,455,700 | -7.97 | 25,198 | -4.81 | ||||
| 2025-08-05 | 13F | Simplex Trading, Llc | Put | 422,300 | -2.20 | 1 | 0.00 | |||
| 2025-07-31 | 13F | Oppenheimer Asset Management Inc. | 228,538 | -3.59 | 551 | -0.36 | ||||
| 2025-07-21 | 13F | Monticello Wealth Management, Llc | 108,856 | 0.00 | 262 | 3.56 | ||||
| 2025-08-13 | 13F | Twin Peaks Wealth Advisors, LLC | 569 | 1 | ||||||
| 2025-07-15 | 13F | Fortitude Family Office, LLC | 0 | -100.00 | 0 | |||||
| 2025-08-13 | 13F | Flow Traders U.s. Llc | 0 | -100.00 | 0 | |||||
| 2025-08-11 | 13F | Citigroup Inc | 156,655 | 3.92 | 378 | 7.41 | ||||
| 2025-08-05 | 13F | Bank of New York Mellon Corp | 847,888 | -0.22 | 2,043 | 3.23 | ||||
| 2025-08-14 | 13F | Aprio Wealth Management, LLC | 44,670 | 121.13 | 108 | 127.66 | ||||
| 2025-08-14 | 13F | EP Wealth Advisors, Inc. | 50,726 | 122 | ||||||
| 2025-07-30 | 13F | Privium Fund Management B.V. | 795,786 | -1.05 | 1,926 | 2.78 | ||||
| 2025-08-11 | 13F | Principal Securities, Inc. | 12,973 | -62.59 | 31 | -51.56 | ||||
| 2025-07-28 | NP | NSI - National Security Emerging Markets Index ETF | 32,003 | 38.46 | 78 | 65.96 | ||||
| 2025-05-13 | 13F | Vestmark Advisory Solutions, Inc. | 0 | -100.00 | 0 | |||||
| 2025-08-14 | 13F | Jain Global LLC | 44,910 | -56.19 | 108 | -54.62 | ||||
| 2025-07-28 | 13F | Moran Wealth Management, LLC | 1,886,937 | 1.27 | 4,548 | 4.75 | ||||
| 2025-08-12 | 13F | Steward Partners Investment Advisory, Llc | 4,584 | -0.63 | 11 | 10.00 | ||||
| 2025-05-27 | NP | Brighthouse Funds Trust I - Brighthouse/Aberdeen Emerging Markets Equity Portfolio Class A | 755,200 | -8.63 | 1,760 | 15.04 | ||||
| 2025-05-13 | 13F | Summitry Llc | 0 | -100.00 | 0 | -100.00 | ||||
| 2025-07-24 | 13F | Commerzbank Aktiengesellschaft /fi | 73,961 | 0.00 | 0 | |||||
| 2025-08-01 | 13F | Bessemer Group Inc | 54,780 | 435.80 | 0 | |||||
| 2025-07-25 | 13F | Allspring Global Investments Holdings, LLC | 14,615,507 | -14.61 | 35,370 | -11.69 | ||||
| 2025-07-16 | 13F | Traveka Wealth, LLC | 17,324 | 65.68 | 42 | 70.83 | ||||
| 2025-07-29 | 13F | Unison Advisors LLC | 304,963 | 2.18 | 742 | 5.56 | ||||
| 2025-08-14 | 13F | Axa S.a. | 26,156 | 0.00 | 63 | 5.00 | ||||
| 2025-08-14 | 13F | Silvercrest Asset Management Group Llc | 17,750 | 0.00 | 43 | 2.44 | ||||
| 2025-08-14 | 13F | VPR Management LLC | 616,839 | 0.00 | 1,487 | 3.41 | ||||
| 2025-08-14 | 13F | Balyasny Asset Management Llc | 10,229 | 25 | ||||||
| 2025-08-19 | 13F | Marex Group plc | 19,740 | 48 | ||||||
| 2025-06-25 | NP | EPDPX - EuroPac International Dividend Income Fund Class A | 700,000 | 0.00 | 1,771 | 36.76 | ||||
| 2025-08-12 | 13F | Aigen Investment Management, Lp | 40,434 | 97 | ||||||
| 2025-03-24 | NP | SLANX - DWS Latin America Equity Fund Class A | 784,200 | -32.99 | 1,451 | -60.28 | ||||
| 2025-08-07 | 13F | Allworth Financial LP | 25,843 | -8.51 | 62 | -10.14 | ||||
| 2025-07-08 | 13F | Nbc Securities, Inc. | 215,238 | -6.62 | 1 | |||||
| 2025-07-31 | 13F | Oppenheimer & Co Inc | 20,487 | 9.99 | 49 | 13.95 | ||||
| 2025-08-07 | 13F | Acadian Asset Management Llc | 0 | -100.00 | 0 | |||||
| 2025-08-20 | NP | REMG - Emerging Markets Equity Active ETF | 54,285 | 131 | ||||||
| 2025-08-08 | 13F | Avantax Advisory Services, Inc. | 743,873 | 0.63 | 1,793 | 4.07 | ||||
| 2025-08-13 | 13F | Tranquilli Financial Advisor LLC | 29,858 | 42.57 | 72 | 47.92 | ||||
| 2025-08-06 | 13F | First Eagle Investment Management, LLC | 338,661,869 | -0.85 | 816,175 | 2.55 | ||||
| 2025-07-31 | 13F | CVA Family Office, LLC | 80,000 | 0.00 | 193 | 3.23 | ||||
| 2025-04-25 | 13F | Iron Financial, LLC | 0 | -100.00 | 0 | |||||
| 2025-07-14 | 13F | UMA Financial Services, Inc. | 1,422 | 38.06 | 3 | 50.00 | ||||
| 2025-07-25 | 13F | We Are One Seven, LLC | 18,157 | -3.30 | 44 | 0.00 | ||||
| 2025-08-01 | 13F | Banco Santander, S.A. | 18,083 | -97.73 | 44 | -97.68 | ||||
| 2025-07-25 | 13F | Meritage Portfolio Management | 1,701,220 | -2.89 | 4,100 | 0.44 | ||||
| 2025-08-11 | 13F | Hexagon Capital Partners LLC | 0 | -100.00 | 0 | |||||
| 2025-08-14 | 13F | Smartleaf Asset Management LLC | 139 | 0.00 | 0 | |||||
| 2025-07-29 | NP | GMEMX - GMO Emerging Markets Fund Class II | 711,000 | 1,735 | ||||||
| 2025-06-25 | NP | SFVLX - Seafarer Overseas Value Fund Investor Class | 1,069,000 | 0.00 | 2,705 | 36.77 | ||||
| 2025-05-05 | 13F | Morningstar Investment Services LLC | 0 | -100.00 | 0 | |||||
| 2025-08-14 | 13F | Capitolis Liquid Global Markets LLC | 0 | -100.00 | 0 | |||||
| 2025-08-14 | 13F | Mercer Global Advisors Inc /adv | 54,896 | 27.06 | 132 | 32.00 | ||||
| 2025-04-30 | 13F | Genus Capital Management Inc. | Put | 0 | -100.00 | 0 | -100.00 | |||
| 2025-08-18 | 13F | Geneos Wealth Management Inc. | 7,182 | 38.06 | 17 | 41.67 | ||||
| 2025-07-16 | 13F | Perigon Wealth Management, LLC | 10,645 | -9.46 | 26 | -7.41 | ||||
| 2025-08-14 | 13F | Optiver Holding B.V. | 1,642,000 | 3.56 | 3,957 | 7.12 | ||||
| 2025-07-29 | NP | PHSWX - Parvin Hedged Equity Solari World Fund | 85,000 | 13.33 | 207 | 33.55 | ||||
| 2025-08-13 | 13F | RWC Asset Management LLP | 11,829,282 | -5.35 | 28,509 | -2.09 | ||||
| 2025-08-14 | 13F | Optiver Holding B.V. | Call | 2,398,900 | 13.00 | 5,781 | 16.88 | |||
| 2025-04-11 | 13F | First Affirmative Financial Network | 66,993 | 47.71 | 156 | 87.95 | ||||
| 2025-08-14 | 13F | Optiver Holding B.V. | Put | 1,912,600 | 37.23 | 4,609 | 41.95 | |||
| 2025-08-14 | 13F | Sei Investments Co | 3,687,614 | 0.74 | 8,887 | 4.20 | ||||
| 2025-08-14 | 13F | Cubist Systematic Strategies, LLC | 2,126,114 | 5,124 | ||||||
| 2025-08-14 | 13F | Strategic Global Advisors, LLC | 195,549 | 21.44 | 471 | 25.60 | ||||
| 2025-08-14 | 13F | Talaria Asset Management Pty Ltd | 14,094,900 | -32.45 | 33,969 | -30.13 | ||||
| 2025-05-15 | 13F | Laird Norton Trust Company, Llc | 0 | -100.00 | 0 | |||||
| 2025-07-28 | 13F | Rosenberg Matthew Hamilton | 4,442 | 0.00 | 11 | 0.00 | ||||
| 2025-07-25 | 13F | Endowment Wealth Management, Inc. | 15,741 | -1.82 | 38 | 0.00 | ||||
| 2025-08-12 | 13F | SPX Equities Gestao de Recursos Ltda | 1,990,483 | -22.38 | 4,797 | -19.70 | ||||
| 2025-08-14 | 13F | Point72 Asset Management, L.P. | 2,596,700 | 99.46 | 6,258 | 106.33 | ||||
| 2025-08-14 | 13F | Aqr Capital Management Llc | 178,601 | -90.48 | 430 | -90.16 | ||||
| 2025-08-11 | 13F | Private Advisor Group, LLC | 13,856 | 21.54 | 33 | 26.92 | ||||
| 2025-05-22 | NP | QSPIX - AQR Style Premia Alternative Fund Class I | 32,188 | -10.07 | 75 | 12.12 | ||||
| 2025-07-22 | 13F | Global Assets Advisory, LLC | 0 | -100.00 | 0 | |||||
| 2025-05-09 | 13F | Abc Arbitrage Sa | 0 | -100.00 | 0 | -100.00 | ||||
| 2025-05-15 | 13F | WPG Advisers, LLC | 0 | -100.00 | 0 | -100.00 | ||||
| 2025-07-25 | 13F | Cwm, Llc | 6,309 | -8.62 | 0 | |||||
| 2025-05-07 | 13F | Ibex Investors LLC | 0 | -100.00 | 0 | |||||
| 2025-08-14 | 13F | Wells Fargo & Company/mn | 4,373,885 | 4.73 | 10,541 | 8.34 | ||||
| 2025-04-23 | 13F | Mascagni Wealth Management, Inc. | 0 | -100.00 | 0 | -100.00 | ||||
| 2025-05-13 | 13F | Seven Mile Advisory | 0 | -100.00 | 0 | |||||
| 2025-08-28 | NP | TMLCX - Simt Tax-managed Large Cap Fund Class F | 81,301 | -87.51 | 196 | -83.80 | ||||
| 2025-07-15 | 13F | Jeppson Wealth Management, Llc | 75,205 | 7.50 | 181 | 11.73 | ||||
| 2025-07-28 | NP | VCGEX - Emerging Economies Fund | 335,736 | -58.26 | 819 | -55.12 | ||||
| 2025-08-14 | 13F/A | Bank Julius Baer & Co. Ltd, Zurich | 38,490 | 13.02 | 93 | 3.37 | ||||
| 2025-08-13 | 13F | Renaissance Technologies Llc | 43,549,800 | 12.46 | 104,955 | 16.32 | ||||
| 2025-07-14 | 13F | Kapitalo Investimentos Ltda | 564,136 | 1,360 | ||||||
| 2025-07-11 | 13F | Grove Bank & Trust | 19,795 | -0.16 | 48 | 2.17 | ||||
| 2025-08-08 | 13F | Cetera Investment Advisers | 140,830 | 21.51 | 339 | 25.56 | ||||
| 2025-08-12 | 13F | Global Retirement Partners, LLC | 966 | 29.49 | 2 | 100.00 | ||||
| 2025-05-30 | NP | JOEMX - JOHCM Emerging Markets Opportunities Fund Class Z Shares | 0 | -100.00 | 0 | -100.00 | ||||
| 2025-08-14 | 13F | Integrated Wealth Concepts LLC | 10,956 | -0.90 | 26 | 4.00 | ||||
| 2025-07-22 | 13F | Merit Financial Group, LLC | 60,899 | 12.27 | 147 | 15.87 | ||||
| 2025-08-27 | NP | TIFF INVESTMENT PROGRAM - TIFF Multi-Asset Fund | 11,169 | 27 | ||||||
| 2025-08-12 | 13F | Longfellow Investment Management Co Llc | 998,136 | -75.13 | 2,406 | -74.28 | ||||
| 2025-04-25 | 13F | Washington Trust Advisors, Inc. | 0 | -100.00 | 0 | -100.00 | ||||
| 2025-08-07 | 13F | Profund Advisors Llc | 196,577 | 1.60 | 474 | 5.11 | ||||
| 2025-08-28 | NP | FEOVX - First Eagle Overseas Variable Fund | 1,343,830 | -1.87 | 3,239 | 1.50 | ||||
| 2025-08-13 | 13F | Northern Trust Corp | 5,008,062 | -35.44 | 12,069 | -33.22 | ||||
| 2025-05-06 | 13F | Rsm Us Wealth Management Llc | 0 | -100.00 | 0 | |||||
| 2025-08-14 | 13F | Parvin Asset Management, LLC | 351,400 | 4.82 | 847 | 8.32 | ||||
| 2025-08-27 | 13F/A | Squarepoint Ops LLC | 328,262 | 402.54 | 791 | 420.39 | ||||
| 2025-08-06 | 13F | SOUTH STATE Corp | 396 | 1 | ||||||
| 2025-04-17 | 13F | Janney Montgomery Scott LLC | 0 | -100.00 | 0 | |||||
| 2025-08-08 | 13F | Renasant Bank | 21,842 | -11.54 | 53 | -8.77 | ||||
| 2025-08-05 | 13F | Seafarer Capital Partners, LLC | 29,069,000 | 0.00 | 70,056 | 3.43 | ||||
| 2025-04-29 | 13F | Td Private Client Wealth Llc | 0 | -100.00 | 0 | |||||
| 2025-08-04 | 13F | Hantz Financial Services, Inc. | 870,608 | 4.07 | 2 | 100.00 | ||||
| 2025-07-30 | 13F | Ethic Inc. | 650,576 | 8.61 | 1,535 | 9.56 | ||||
| 2025-04-30 | 13F | Investment Management Associates Inc /adv | 0 | -100.00 | 0 | -100.00 | ||||
| 2025-08-14 | 13F | Ieq Capital, Llc | 123,930 | 299 | ||||||
| 2025-08-04 | 13F | Arkadios Wealth Advisors | 92,244 | -18.66 | 222 | -15.91 | ||||
| 2025-05-15 | 13F | Farringdon Capital, Ltd. | 0 | -100.00 | 0 | |||||
| 2025-08-05 | 13F | Tiaa Trust, National Association | 0 | -100.00 | 0 | |||||
| 2025-07-21 | 13F | Credential Securities Inc. | 0 | -100.00 | 0 | -100.00 | ||||
| 2025-07-28 | 13F | Naviter Wealth, LLC | 0 | -100.00 | 0 | |||||
| 2025-08-12 | 13F | Pacer Advisors, Inc. | 0 | -100.00 | 0 | |||||
| 2025-05-13 | 13F | Sprucegrove Investment Management Ltd | 0 | -100.00 | 0 | |||||
| 2025-04-11 | 13F | Foster Group, Inc. | 0 | -100.00 | 0 | |||||
| 2025-05-07 | 13F | Werba Rubin Papier Wealth Management | 0 | -100.00 | 0 | -100.00 | ||||
| 2025-07-14 | 13F | Abacus Wealth Partners, LLC | 10,480 | 25 | ||||||
| 2025-07-31 | 13F | Fielder Capital Group LLC | 88,689 | 0.00 | 214 | 3.40 | ||||
| 2025-07-18 | 13F | Generali Investments CEE, investicni spolecnost, a.s. | 221,750 | 0.00 | 534 | 3.49 | ||||
| 2025-08-12 | 13F | Proequities, Inc. | Put | 0 | 0 | |||||
| 2025-05-13 | 13F | Wealthedge Investment Advisors, Llc | 0 | -100.00 | 0 | |||||
| 2025-08-11 | 13F | Vanguard Group Inc | 5,711,647 | 0.02 | 13,765 | 3.46 | ||||
| 2025-08-12 | 13F | Proequities, Inc. | Call | 0 | 0 | |||||
| 2025-08-12 | 13F | Franklin Resources Inc | 751,208 | 11.64 | 1,810 | 15.51 | ||||
| 2025-08-12 | 13F | Proequities, Inc. | 0 | 0 | ||||||
| 2025-05-14 | 13F | PineBridge Investments, L.P. | 0 | -100.00 | 0 | |||||
| 2025-08-11 | 13F | HighTower Advisors, LLC | 33,829 | -4.98 | 82 | -1.22 | ||||
| 2025-07-29 | NP | JSTC - Adasina Social Justice All Cap Global ETF | 451,192 | 21.42 | 1,101 | 43.04 | ||||
| 2025-07-24 | 13F | Callan Family Office, LLC | 216,501 | 152.82 | 522 | 161.81 | ||||
| 2025-08-14 | 13F | Ruggaard & Associates LLC | 10,000 | 0.00 | 24 | 4.35 | ||||
| 2025-07-11 | 13F | Pinnacle Bancorp, Inc. | 7,028 | -8.38 | 17 | -5.88 | ||||
| 2025-08-14 | 13F | FIL Ltd | 3,000,000 | -97.70 | 7,230 | -97.62 | ||||
| 2025-08-13 | 13F | M&t Bank Corp | 13,000 | 0.00 | 31 | 3.33 | ||||
| 2025-08-15 | 13F | Earnest Partners Llc | 684,577 | -6.80 | 1,650 | -3.62 | ||||
| 2025-06-25 | NP | EPIVX - EuroPac International Value Fund Class A | 750,656 | 0.00 | 1,899 | 36.82 | ||||
| 2025-08-01 | 13F | Envestnet Asset Management Inc | 3,178,860 | 7.20 | 7,661 | 10.88 | ||||
| 2025-08-13 | 13F | Fisher Asset Management, LLC | 805,384 | -14.18 | 1,941 | -11.25 | ||||
| 2025-08-06 | 13F | Metis Global Partners, LLC | 30,437 | 13.95 | 73 | 17.74 | ||||
| 2025-07-24 | 13F | Blair William & Co/il | 136,022 | -0.11 | 328 | 3.15 | ||||
| 2025-08-13 | 13F | Quadrant Capital Group Llc | 240,517 | 1,052.78 | 580 | 1,106.25 | ||||
| 2025-08-15 | 13F/A | Symphony Financial, Ltd. Co. | 13,737 | 34 | ||||||
| 2025-05-14 | 13F | Baron Wealth Management LLC | 0 | -100.00 | 0 | |||||
| 2025-04-29 | 13F | Stage Harbor Financial, Llc | 0 | -100.00 | 0 | |||||
| 2025-07-22 | 13F | Checchi Capital Advisers, LLC | 34,029 | 8.29 | 82 | 12.33 | ||||
| 2025-08-11 | 13F | Aptus Capital Advisors, LLC | 0 | -100.00 | 0 | |||||
| 2025-08-27 | NP | JNL SERIES TRUST - JNL Multi-Manager Alternative Fund (A) | 1,025,427 | 0.00 | 2,471 | 3.43 | ||||
| 2025-08-12 | 13F | Rhumbline Advisers | 411,981 | 2.50 | 993 | 5.98 | ||||
| 2025-08-14 | 13F | Aquatic Capital Management LLC | 2,329,999 | 19.58 | 5,615 | 23.71 | ||||
| 2025-07-30 | 13F | Bogart Wealth, LLC | 2,555 | 0.00 | 6 | 20.00 | ||||
| 2025-04-16 | 13F | Quintet Private Bank (Europe) S.A. | 0 | -100.00 | 0 | |||||
| 2025-05-15 | 13F | Advisors Asset Management, Inc. | 0 | -100.00 | 0 | |||||
| 2025-08-06 | 13F | Genus Capital Management Inc. | 61,608 | -6.65 | 148 | -3.27 | ||||
| 2025-08-13 | 13F | Quantbot Technologies LP | 63,056 | 7.20 | 152 | 10.22 | ||||
| 2025-07-25 | 13F | LRI Investments, LLC | 300 | 0.00 | 1 | |||||
| 2025-08-12 | 13F | CIBC Private Wealth Group, LLC | 7,250 | 0.00 | 17 | 13.33 | ||||
| 2025-08-13 | 13F | Qtron Investments LLC | 277,363 | 18.57 | 668 | 22.57 | ||||
| 2025-06-26 | NP | DFA INVESTMENT DIMENSIONS GROUP INC - World ex U.S. Core Equity Portfolio Institutional Class Shares | 123,103 | 0.00 | 311 | 37.00 | ||||
| 2025-08-13 | 13F | Cerity Partners LLC | 179,642 | 24.42 | 433 | 28.87 | ||||
| 2025-06-30 | NP | VGTSX - Vanguard Total International Stock Index Fund Investor Shares | 383,229 | 0.00 | 970 | 36.86 | ||||
| 2025-07-18 | 13F | Robeco Institutional Asset Management B.V. | 482,048 | 21.43 | 1,162 | 25.65 | ||||
| 2025-04-30 | 13F | Personal Cfo Solutions, Llc | 0 | -100.00 | 0 | |||||
| 2025-08-12 | 13F | OneAscent Financial Services LLC | 18,144 | -43.29 | 0 | |||||
| 2025-08-07 | 13F | Verus Capital Partners, Llc | 70,000 | -12.50 | 169 | -9.68 | ||||
| 2025-08-12 | 13F | Country Trust Bank | 724 | 0.00 | 2 | 0.00 | ||||
| 2025-07-28 | NP | AVEEX - Avantis Emerging Markets Equity Fund Institutional Class This fund is a listed as child fund of American Century Companies Inc and if that institution has disclosed ownership in this security, then these positions will not be double counted when calculating total shares and total value | 162,318 | 0.00 | 396 | 18.21 | ||||
| 2025-05-01 | 13F | Marks Group Wealth Management, Inc | 0 | -100.00 | 0 | -100.00 | ||||
| 2025-08-13 | 13F | Schroder Investment Management Group | 6,095,221 | -11.97 | 14,689 | -6.95 | ||||
| 2025-07-17 | 13F | Sound Income Strategies, LLC | 0 | -100.00 | 0 | |||||
| 2025-05-09 | 13F | GeoWealth Management, LLC | 0 | -100.00 | 0 | |||||
| 2025-07-29 | NP | GIMFX - GMO Implementation Fund | 500,000 | 741.75 | 1,220 | 601.15 | ||||
| 2025-07-31 | 13F | Hartford Financial Management Inc. | 11,283 | -10.06 | 27 | -6.90 | ||||
| 2025-08-13 | 13F | Dodge & Cox | 260,400 | 0.00 | 628 | 3.47 | ||||
| 2025-08-01 | 13F | Motco | 252,708 | -0.68 | 551 | -7.09 | ||||
| 2025-07-29 | 13F | Burford Brothers, Inc. | 533,934 | 577.54 | 1,287 | 602.73 | ||||
| 2025-08-14 | 13F | Hara Capital LLC | 28,788 | -66.51 | 69 | -65.50 | ||||
| 2025-08-13 | 13F | GQG Partners LLC | 150,859,260 | 363,571 | ||||||
| 2025-07-11 | 13F | Perpetual Ltd | 1,315,091 | -55.89 | 3,169 | -54.37 | ||||
| 2025-08-14 | 13F | Macquarie Group Ltd | 4,687,076 | 19.19 | 11,296 | 23.28 | ||||
| 2025-06-25 | NP | EMGAX - Wells Fargo Emerging Markets Equity Fund Class A | 7,522,792 | -12.34 | 19,033 | 19.88 | ||||
| 2025-08-18 | 13F | Wolverine Trading, Llc | Call | 17,800 | -5.32 | 42 | 0.00 | |||
| 2025-07-30 | 13F | Cullen/frost Bankers, Inc. | 32,075 | 0.00 | 77 | 4.05 | ||||
| 2025-08-11 | 13F | TD Waterhouse Canada Inc. | 89,250 | 0.00 | 215 | 3.37 | ||||
| 2025-06-25 | NP | IEMGX - Voya Multi-Manager Emerging Markets Equity Fund Class I | 213,200 | 0.00 | 539 | 36.80 | ||||
| 2025-07-15 | 13F | Mather Group, Llc. | 0 | -100.00 | 0 | |||||
| 2025-07-25 | 13F | Yousif Capital Management, Llc | 59,597 | -15.68 | 144 | -12.80 | ||||
| 2025-06-27 | NP | SGENX - First Eagle Global Fund Class A | 166,791,911 | 0.00 | 421,984 | 36.76 | ||||
| 2025-08-14 | 13F | Ancora Advisors, LLC | 0 | -100.00 | 0 | |||||
| 2025-08-15 | 13F | Great West Life Assurance Co /can/ | 13,409,316 | 74.85 | 33 | 77.78 | ||||
| 2025-08-13 | 13F | Foresight Global Investors, Inc. | 3,077,365 | -12.77 | 7,416 | -9.78 | ||||
| 2025-08-11 | 13F | Great Lakes Advisors, Llc | 7,684,611 | 55.11 | 18,520 | 60.43 | ||||
| 2025-08-07 | 13F | Sierra Ocean, Llc | 974 | 81.38 | 2 | 100.00 | ||||
| 2025-06-25 | NP | VVIFX - Voya VACS Series EME Fund | 453,583 | 0.00 | 1,148 | 36.71 | ||||
| 2025-08-11 | 13F | United Capital Financial Advisers, Llc | 0 | -100.00 | 0 | |||||
| 2025-07-08 | 13F | Parallel Advisors, LLC | 38,203 | 66.00 | 92 | 73.58 | ||||
| 2025-08-08 | 13F | Massachusetts Financial Services Co /ma/ | 32,193,532 | -14.23 | 77,586 | -11.28 | ||||
| 2025-08-12 | 13F | Dynamic Technology Lab Private Ltd | 25,116 | -23.23 | 61 | -19.74 | ||||
| 2025-04-21 | 13F | Riverbridge Partners Llc | 0 | -100.00 | 0 | |||||
| 2025-05-15 | 13F | CAPROCK Group, Inc. | 109,468 | 67.92 | 257 | 102.36 | ||||
| 2025-05-15 | 13F | Aureus Asset Management, LLC | 0 | -100.00 | 0 | |||||
| 2025-05-09 | 13F | NewEdge Wealth, LLC | 0 | -100.00 | 0 | |||||
| 2025-08-14 | 13F | Engineers Gate Manager LP | 108,806 | 262 | ||||||
| 2025-05-13 | 13F | Employees Retirement System of Texas | 0 | -100.00 | 0 | |||||
| 2025-07-08 | 13F | Northwest & Ethical Investments L.P. | 0 | -100.00 | 0 | -100.00 | ||||
| 2025-08-14 | 13F | Benjamin Edwards Inc | 22,607 | 54 | ||||||
| 2025-08-04 | 13F | Keybank National Association/oh | 87,655 | 2.17 | 211 | 6.03 | ||||
| 2025-07-30 | NP | PZINX - Pzena International Value Fund Institutional | 13,543 | 0.00 | 33 | 17.86 | ||||
| 2025-07-30 | 13F | Rehmann Capital Advisory Group | 23,129 | 56 | ||||||
| 2025-07-14 | 13F | Park Avenue Securities Llc | 45,675 | 9.33 | 0 | |||||
| 2025-06-23 | NP | UBPIX - Ultralatin America Profund Investor Class | 87,582 | -6.18 | 222 | 28.49 | ||||
| 2025-05-07 | 13F | Wealthstream Advisors, Inc. | 0 | -100.00 | 0 | |||||
| 2025-08-27 | NP | Jnl Series Trust - Jnl/lazard Emerging Markets Fund (a) | 1,029,391 | -18.43 | 2,481 | 6.26 | ||||
| 2025-08-13 | 13F | Marshall Wace, Llp | 4,208,299 | 192.73 | 10,142 | 202.84 | ||||
| 2025-07-14 | 13F | GAMMA Investing LLC | 5,954 | 26.14 | 14 | 40.00 | ||||
| 2025-06-25 | NP | GERIX - Goldman Sachs Emerging Markets Equity Insights Fund Institutional | 664,300 | -78.42 | 1,681 | -80.51 | ||||
| 2025-08-12 | 13F | O'shaughnessy Asset Management, Llc | 579,745 | 49.79 | 1,397 | 55.05 | ||||
| 2025-04-02 | 13F | Park National Corp /oh/ | 0 | -100.00 | 0 | |||||
| 2025-07-28 | NP | AVXC - Avantis Emerging Markets ex-China Equity ETF | 40,373 | 37.48 | 99 | 63.33 | ||||
| 2025-08-26 | NP | KXI - iShares Global Consumer Staples ETF | 979,785 | 15.02 | 2,361 | 19.00 | ||||
| 2025-08-28 | NP | SLGAX - SIMT Large Cap Fund Class F | 1,367,493 | 49.72 | 3,296 | 54.84 | ||||
| 2025-08-29 | NP | LIGYX - Loomis Sayles International Growth Fund Class Y | 309,650 | -1.65 | 746 | 1.77 | ||||
| 2025-08-25 | NP | DSTX - Distillate International Fundamental Stability & Value ETF | 198,108 | 7.14 | 477 | 10.93 | ||||
| 2025-07-15 | 13F | Ballentine Partners, LLC | 73,900 | 104.98 | 178 | 111.90 | ||||
| 2025-07-29 | NP | CAVAX - Catholic Values Equity Fund Class F, effective 1-31-2017 (formerly Class A) | 33,504 | 0.00 | 82 | 17.39 | ||||
| 2025-08-11 | 13F | B. Metzler seel. Sohn & Co. AG | 654,320 | 1,577 | ||||||
| 2025-07-24 | 13F | Insight Inv LLC | 0 | -100.00 | 0 | |||||
| 2025-06-26 | NP | FSGEX - Fidelity Series Global ex U.S. Index Fund This fund is a listed as child fund of Fmr Llc and if that institution has disclosed ownership in this security, then these positions will not be double counted when calculating total shares and total value | 145,070 | -61.84 | 367 | -47.80 | ||||
| 2025-08-13 | 13F | Arrowstreet Capital, Limited Partnership | 42,553,928 | -23.66 | 102,555 | -21.04 | ||||
| 2025-05-15 | 13F | Dimension Capital Management Llc | 0 | -100.00 | 0 | |||||
| 2025-07-18 | 13F | Ninety One UK Ltd | 2,799,396 | -9.45 | 6,747 | -6.34 | ||||
| 2025-07-22 | 13F | Red Door Wealth Management, LLC | 19,000 | 0.00 | 46 | 2.27 | ||||
| 2025-07-23 | 13F | Viewpoint Capital Management LLC | 16,300 | 0.00 | 39 | 5.41 | ||||
| 2025-08-13 | 13F | Jones Financial Companies Lllp | 106,908 | -1.51 | 252 | 2.02 | ||||
| 2025-04-29 | 13F | Resources Investment Advisors, LLC. | 0 | -100.00 | 0 | |||||
| 2025-07-30 | 13F | Onyx Bridge Wealth Group LLC | 37,368 | 0.00 | 90 | 3.45 | ||||
| 2025-05-09 | 13F | Pitcairn Co | 0 | -100.00 | 0 | |||||
| 2025-06-30 | NP | ECOW - Pacer Emerging Markets Cash Cows 100 ETF | 704,024 | -9.19 | 1,781 | 24.20 | ||||
| 2025-05-13 | 13F | Mondrian Investment Partners LTD | 27,466 | 31.98 | 64 | 65.79 | ||||
| 2025-07-22 | 13F | Kercheville Advisors, LLC | 39,400 | 95 | ||||||
| 2025-05-15 | 13F | Citadel Advisors Llc | 0 | -100.00 | 0 | -100.00 | ||||
| 2025-07-29 | NP | FEOE - First Eagle Overseas Equity ETF | 792,299 | 449.66 | 1,933 | 548.66 | ||||
| 2025-08-12 | 13F | Barings Llc | 621,824 | -23.47 | 1,499 | -20.87 | ||||
| 2025-06-30 | NP | VT - Vanguard Total World Stock Index Fund ETF Shares | 532,359 | 0.00 | 1,347 | 36.79 | ||||
| 2025-07-25 | 13F | Welch Group, LLC | 44,319 | 0.29 | 107 | 6.00 | ||||
| 2025-08-13 | 13F | Blueshift Asset Management, LLC | 18,000 | -35.13 | 43 | -32.81 | ||||
| 2025-07-14 | 13F | S.A. Mason LLC | 500 | 0.00 | 1 | 0.00 | ||||
| 2025-08-13 | 13F | Quadrature Capital Ltd | 936,411 | 2,252 | ||||||
| 2025-07-16 | 13F | Signaturefd, Llc | 12,712 | 63.23 | 31 | 66.67 | ||||
| 2025-08-13 | 13F | Walleye Capital LLC | 0 | -100.00 | 0 | |||||
| 2025-08-15 | 13F | Kestra Advisory Services, LLC | 18,994 | 7.10 | 46 | 9.76 | ||||
| 2025-07-21 | 13F | Hilltop National Bank | 7,850 | 0.00 | 19 | 28.57 | ||||
| 2025-08-13 | 13F | Manning & Napier Advisors Llc | 1,280,792 | 3,087 | ||||||
| 2025-05-14 | 13F | Rockefeller Capital Management L.P. | 0 | -100.00 | 0 | -100.00 | ||||
| 2025-08-07 | NP | OTGAX - OTG Latin America Fund Class A Shares | 252,000 | 0.00 | 607 | 3.41 | ||||
| 2025-06-26 | NP | DFA INVESTMENT DIMENSIONS GROUP INC - Emerging Markets Sustainability Core 1 Portfolio Institutional Class This fund is a listed as child fund of Dimensional Fund Advisors Lp and if that institution has disclosed ownership in this security, then these positions will not be double counted when calculating total shares and total value | 220,998 | 0.00 | 559 | 37.01 | ||||
| 2025-08-14 | 13F | Citadel Advisors Llc | Call | 180,300 | 12.48 | 435 | 16.35 | |||
| 2025-08-04 | 13F | Virtus Family Office LLC | 576,011 | 20.61 | 1,398 | 24.49 | ||||
| 2025-08-05 | 13F | Freestone Capital Holdings, LLC | 47,092 | -11.42 | 113 | -8.13 | ||||
| 2025-05-14 | 13F | Aspen Grove Capital, LLC | 0 | -100.00 | 0 | |||||
| 2025-06-26 | NP | HLXCX - Emerging Markets ex China Portfolio Institutional Class | 0 | -100.00 | 0 | -100.00 | ||||
| 2025-07-22 | 13F | Wynn Capital, LLC | 119,900 | 5.16 | 289 | 8.68 | ||||
| 2025-07-29 | 13F | FLC Capital Advisors | 60,465 | 146 | ||||||
| 2025-08-06 | 13F | Moors & Cabot, Inc. | 106,900 | -2.73 | 258 | 0.39 | ||||
| 2025-08-08 | 13F | Wealth Alliance | 27,138 | -2.28 | 65 | 1.56 | ||||
| 2025-08-12 | 13F | BlackRock, Inc. | 22,778,969 | 9.43 | 54,897 | 13.19 | ||||
| 2025-08-15 | 13F | Captrust Financial Advisors | 591,413 | 4.58 | 1,425 | 8.20 | ||||
| 2025-08-13 | 13F | Hsbc Holdings Plc | 2,116,346 | 10.88 | 5,103 | 14.57 | ||||
| 2025-08-13 | 13F | Mackenzie Financial Corp | 156,530 | -63.87 | 377 | -62.64 | ||||
| 2025-07-09 | 13F | Riversedge Advisors, Llc | 20,950 | 8.02 | 50 | 11.11 | ||||
| 2025-07-31 | 13F | Ssa Swiss Advisors Ag | 0 | -100.00 | 0 | |||||
| 2025-08-14 | 13F | Two Sigma Advisers, Lp | 20,941,300 | -30.99 | 50,469 | -28.62 | ||||
| 2025-08-13 | 13F | Northwestern Mutual Wealth Management Co | 88,758 | 0.90 | 214 | 4.41 | ||||
| 2025-05-14 | 13F | Credit Agricole S A | 47,555 | -65.64 | 111 | -57.03 | ||||
| 2025-06-26 | NP | DFCEX - Emerging Markets Core Equity Portfolio - Institutional Class This fund is a listed as child fund of Dimensional Fund Advisors Lp and if that institution has disclosed ownership in this security, then these positions will not be double counted when calculating total shares and total value | 3,022,063 | 0.00 | 7,646 | 36.76 | ||||
| 2025-08-08 | 13F | Ranmore Fund Management Ltd | 0 | -100.00 | 0 | |||||
| 2025-08-14 | 13F | Bank Of America Corp /de/ | 27,505,192 | 9.91 | 66,288 | 13.68 | ||||
| 2025-08-11 | 13F | Frank, Rimerman Advisors LLC | 66,140 | 159 | ||||||
| 2025-08-25 | 13F/A | Neuberger Berman Group LLC | 228,227 | 891.30 | 550 | 937.74 | ||||
| 2025-08-11 | 13F | Empowered Funds, LLC | 159,542 | 148.79 | 384 | 157.72 | ||||
| 2025-06-18 | NP | REAYX - Equity Income Fund Class Y | 207,883 | -9.86 | 526 | 23.24 | ||||
| 2025-04-30 | 13F | CORDA Investment Management, LLC. | 0 | -100.00 | 0 | |||||
| 2025-07-24 | 13F | IFP Advisors, Inc | 118,102 | 7.54 | 285 | 11.37 | ||||
| 2025-07-28 | 13F | Fairman Group, LLC | 234 | 0.00 | 1 | |||||
| 2025-07-23 | 13F | Prime Capital Investment Advisors, LLC | 11,849 | -1.07 | 29 | 3.70 | ||||
| 2025-04-23 | 13F | Alpine Bank Wealth Management | 0 | -100.00 | 0 | |||||
| 2025-08-12 | 13F | Dimensional Fund Advisors Lp | 8,342,789 | 6.29 | 20,092 | 9.97 | ||||
| 2025-08-26 | NP | ILF - iShares Latin America 40 ETF | 15,483,289 | 9.47 | 37,315 | 13.23 | ||||
| 2025-08-12 | 13F | Tableaux Llc | 51,261 | 1,435 | ||||||
| 2025-08-12 | 13F | NWF Advisory Services Inc. | 20,952 | 49 | ||||||
| 2025-08-14 | 13F | Wellington Management Group Llp | 859,469 | 205.72 | 2,071 | 216.18 | ||||
| 2025-08-12 | 13F | CenterBook Partners LP | 11,169 | 27 | ||||||
| 2025-08-08 | 13F | Pnc Financial Services Group, Inc. | 70,215 | 25.13 | 169 | 30.00 | ||||
| 2025-07-30 | 13F | Forum Financial Management, LP | 11,000 | 0.00 | 27 | 4.00 | ||||
| 2025-08-13 | 13F | New York State Common Retirement Fund | 1,112,200 | 2.46 | 3 | 0.00 | ||||
| 2025-07-21 | 13F | Kennebec Savings Bank | 0 | -100.00 | 0 | |||||
| 2025-08-12 | 13F | American Century Companies Inc | 3,013,784 | 22.75 | 7,263 | 26.98 | ||||
| 2025-08-04 | 13F | Spire Wealth Management | 41,971 | -8.06 | 101 | -4.72 | ||||
| 2025-08-08 | 13F | Quinn Opportunity Partners LLC | 80,000 | 0.00 | 193 | 3.23 | ||||
| 2025-08-11 | 13F | EntryPoint Capital, LLC | 0 | -100.00 | 0 | |||||
| 2025-07-23 | 13F | High Note Wealth, LLC | 66 | 0.00 | 0 | |||||
| 2025-07-14 | 13F | U.S. Capital Wealth Advisors, LLC | 10,556 | -13.33 | 25 | -10.71 | ||||
| 2025-08-01 | 13F | Transcend Wealth Collective, Llc | 34,598 | 245.32 | 83 | 260.87 | ||||
| 2025-08-13 | 13F | Centiva Capital, LP | 96,701 | -1.83 | 233 | 1.75 | ||||
| 2025-08-14 | 13F | Mml Investors Services, Llc | 212,479 | 15.15 | 1 | |||||
| 2025-07-23 | 13F/A | Euro Pacific Asset Management, LLC | 3,156,817 | -1.17 | 8 | 0.00 | ||||
| 2025-07-29 | 13F | Regions Financial Corp | 0 | -100.00 | 0 | |||||
| 2025-07-31 | 13F | R Squared Ltd | 0 | -100.00 | 0 | |||||
| 2025-06-26 | NP | DFAE - Dimensional Emerging Core Equity Market ETF | 1,201,667 | 3.62 | 3,040 | 41.72 | ||||
| 2025-08-01 | 13F | Brinker Capital Investments, LLC | 0 | -100.00 | 0 | -100.00 | ||||
| 2025-07-28 | NP | AVEM - Avantis Emerging Markets Equity ETF This fund is a listed as child fund of American Century Companies Inc and if that institution has disclosed ownership in this security, then these positions will not be double counted when calculating total shares and total value | 2,630,623 | 21.71 | 6,419 | 43.48 | ||||
| 2025-08-14 | 13F | State Street Corp | 11,724,631 | 2.85 | 28,502 | 6.31 | ||||
| 2025-07-11 | 13F/A | Umb Bank N A/mo | 4,997 | -22.30 | 12 | -14.29 | ||||
| 2025-08-14 | 13F | Stifel Financial Corp | 1,025,356 | 30.16 | 2,471 | 34.66 | ||||
| 2025-08-14 | 13F | Synovus Financial Corp | 0 | -100.00 | 0 | |||||
| 2025-07-31 | 13F | Caitong International Asset Management Co., Ltd | 69,413 | 149.44 | 167 | 160.94 | ||||
| 2025-07-29 | NP | GMAQX - GMO Emerging Markets ex-China Fund Class VI | 137,500 | 266.67 | 336 | 260.22 | ||||
| 2025-08-04 | 13F | IFG Advisory, LLC | 26,075 | 0.00 | 63 | 3.33 | ||||
| 2025-07-25 | 13F | Pzena Investment Management Llc | 10,315,005 | -25.47 | 24,859 | -22.91 | ||||
| 2025-08-07 | 13F | Roberts Glore & Co Inc /il/ | 31,580 | -8.41 | 76 | -5.00 | ||||
| 2025-08-06 | 13F | Oldfield Partners LLP | 2,079,600 | -21.07 | 5,012 | -18.37 | ||||
| 2025-08-13 | 13F | Grantham, Mayo, Van Otterloo & Co. LLC | 2,385,900 | 12,937.70 | 5,750 | 13,590.48 | ||||
| 2025-08-12 | 13F | LPL Financial LLC | 1,013,248 | 15.86 | 2,442 | 19.83 | ||||
| 2025-06-30 | NP | VMNVX - Vanguard Global Minimum Volatility Fund Admiral Shares | 901,632 | -8.22 | 2,281 | 25.54 | ||||
| 2025-08-05 | 13F | Scarborough Advisors, LLC | 553 | 1 | ||||||
| 2025-05-13 | 13F | Daiwa Securities Group Inc. | 0 | -100.00 | 0 | |||||
| 2025-08-08 | 13F | Mitsubishi UFJ Trust & Banking Corp | 356,158 | 45.65 | 858 | 50.79 | ||||
| 2025-08-14 | 13F | Lazard Asset Management Llc | 80,209 | 0 | ||||||
| 2025-08-12 | 13F | Virtu Financial LLC | 697,548 | 2 | ||||||
| 2025-07-16 | 13F | Highline Wealth Partners Llc | 2,914 | 61.80 | 7 | 75.00 | ||||
| 2025-06-26 | NP | DAADX - Emerging Markets ex China Core Equity Portfolio Institutional Class | 112,647 | 0.00 | 285 | 36.54 | ||||
| 2025-07-11 | 13F | Farther Finance Advisors, LLC | 5,182 | -8.35 | 12 | -7.69 | ||||
| 2025-07-18 | 13F | Truist Financial Corp | 16,067 | -39.90 | 39 | -38.71 | ||||
| 2025-08-13 | 13F | Natixis Advisors, L.p. | 880,180 | -26.62 | 2 | 0.00 | ||||
| 2025-08-13 | 13F | Cresset Asset Management, LLC | 0 | -100.00 | 0 | |||||
| 2025-08-13 | 13F | First Trust Advisors Lp | 0 | -100.00 | 0 | |||||
| 2025-08-08 | 13F | Crossmark Global Holdings, Inc. | 114,768 | 0.00 | 277 | 3.37 | ||||
| 2025-06-27 | NP | FEBAX - First Eagle Global Income Builder Fund Class A | 9,345,635 | 0.00 | 23,644 | 36.76 | ||||
| 2025-08-14 | 13F | Warren Averett Asset Management, LLC | 339,276 | 1.42 | 818 | 4.88 | ||||
| 2025-08-04 | 13F | Strs Ohio | 3,061,300 | 0.00 | 7,378 | 3.44 | ||||
| 2025-05-07 | 13F | Angeles Wealth Management, Llc | 0 | -100.00 | 0 | -100.00 | ||||
| 2025-07-24 | 13F | PDS Planning, Inc | 16,259 | 4.75 | 39 | 8.33 | ||||
| 2025-08-12 | 13F | Jpmorgan Chase & Co | 416,388 | -38.12 | 1,003 | -35.99 | ||||
| 2025-08-13 | 13F | Guggenheim Capital Llc | 169,421 | -10.69 | 408 | -7.48 | ||||
| 2025-07-10 | 13F | Moody National Bank Trust Division | 30,150 | 0.00 | 73 | 2.86 | ||||
| 2025-08-01 | 13F | Ashton Thomas Private Wealth, LLC | 1,216,115 | 720.63 | 2,935 | 743.10 | ||||
| 2025-07-25 | NP | MEMAX - MFS Emerging Markets Equity Fund A | 25,319,971 | -39.92 | 61,781 | -29.19 | ||||
| 2025-06-26 | NP | DFSE - Dimensional Emerging Markets Sustainability Core 1 ETF | 69,073 | 3.76 | 175 | 41.46 | ||||
| 2025-05-15 | 13F | Glenmede Trust Co Na | 0 | -100.00 | 0 | |||||
| 2025-08-14 | 13F | Citadel Advisors Llc | Put | 0 | -100.00 | 0 | ||||
| 2025-08-26 | NP | BINV - Brandes International ETF | 1,918,482 | 18.72 | 4,624 | 22.79 | ||||
| 2025-06-26 | NP | DEXC - Dimensional Emerging Markets ex China Core Equity ETF | 24,000 | 17.65 | 61 | 62.16 | ||||
| 2025-04-29 | 13F | Pensionmark Financial Group, Llc | 0 | -100.00 | 0 | |||||
| 2025-08-13 | 13F | EverSource Wealth Advisors, LLC | 12,248 | 2,224.10 | 30 | 2,800.00 | ||||
| 2025-08-28 | NP | CWI - SPDR(R) MSCI ACWI EX-US ETF | 427,751 | 0.35 | 1,031 | 3.73 | ||||
| 2025-08-12 | 13F | SRS Capital Advisors, Inc. | 12,085 | 29 | ||||||
| 2025-08-08 | 13F | Itau Unibanco Holding S.A. | 9,844 | 0.00 | 24 | |||||
| 2025-08-14 | 13F | Cook & Bynum Capital Management, LLC | 1,078,495 | 0.00 | 2,600 | 3.46 | ||||
| 2025-05-02 | 13F | Capital A Wealth Management, LLC | 1,378 | 0.00 | 3 | 50.00 | ||||
| 2025-07-15 | 13F | Alhambra Investment Partners LLC | 45,829 | 110 | ||||||
| 2025-07-17 | 13F | Wagner Wealth Management, Llc | 10,525 | 0.00 | 25 | 4.17 | ||||
| 2025-07-17 | 13F | Genesis Private Wealth, Llc | 10,050 | 0.00 | 24 | 4.35 | ||||
| 2025-08-13 | 13F/A | StoneX Group Inc. | 20,221 | 50 | ||||||
| 2025-07-25 | 13F | JustInvest LLC | 113,292 | 23.82 | 273 | 28.17 | ||||
| 2025-08-08 | 13F | SG Americas Securities, LLC | 36,203 | -76.52 | 0 | |||||
| 2025-08-25 | NP | MFS VARIABLE INSURANCE TRUST II - MFS Emerging Markets Equity Portfolio Initial Class | 104,847 | -22.20 | 253 | -19.49 | ||||
| 2025-08-14 | 13F | Royal Bank Of Canada | 2,464,513 | 5.30 | 5,940 | 8.91 | ||||
| 2025-08-14 | 13F | Susquehanna International Group, Llp | 2,144,681 | 275.17 | 5,169 | 288.28 | ||||
| 2025-08-14 | 13F | Susquehanna International Group, Llp | Put | 2,195,500 | 180.86 | 5,291 | 190.55 | |||
| 2025-06-27 | NP | SGOVX - First Eagle Overseas Fund Class A | 75,441,038 | 0.00 | 190,866 | 36.76 | ||||
| 2025-08-14 | 13F | Fmr Llc | 539,512 | -3.78 | 1,300 | -0.46 | ||||
| 2025-08-14 | 13F | Susquehanna International Group, Llp | Call | 436,200 | 233.74 | 1,051 | 245.72 | |||
| 2025-08-14 | 13F | Fortress Private Ledger, Llc | 91,929 | 50.31 | 222 | 55.63 | ||||
| 2025-08-05 | 13F | Huntington National Bank | 1 | 0.00 | 0 | |||||
| 2025-07-24 | 13F | Jfs Wealth Advisors, Llc | 170 | 286.36 | 0 | |||||
| 2025-07-29 | NP | RBB FUND, INC. - Aquarius International Fund | 19,058 | 47 | ||||||
| 2025-08-14 | 13F | Millennium Management Llc | 2,960,164 | 23.37 | 7,134 | 27.60 | ||||
| 2025-08-14 | 13F | Horizon Investments, LLC | 244 | 1 | ||||||
| 2025-08-26 | NP | NMMEX - Active M Emerging Markets Equity Fund | 684,368 | -0.14 | 1,649 | 3.32 | ||||
| 2025-07-18 | 13F | BSW Wealth Partners | 14,598 | 35 | ||||||
| 2025-08-14 | 13F | Harding Loevner Lp | 0 | -100.00 | 0 | |||||
| 2025-08-14 | 13F/A | Skopos Labs, Inc. | 28,106 | 336.63 | 68 | 378.57 | ||||
| 2025-08-14 | 13F | LaSalle St. Investment Advisors, LLC | 0 | -100.00 | 0 | |||||
| 2025-08-14 | 13F | Wetherby Asset Management Inc | 57,811 | -21.15 | 139 | 2.96 | ||||
| 2025-05-06 | 13F | Zevin Asset Management Llc | 0 | -100.00 | 0 | |||||
| 2025-07-23 | 13F | Mraz, Amerine & Associates, Inc. | 724,436 | 5.35 | 1,746 | 11.36 | ||||
| 2025-08-27 | NP | JNL SERIES TRUST - JNL/Loomis Sayles Global Growth Fund (I) | 5,256,435 | -2.52 | 12,668 | 0.83 | ||||
| 2025-08-13 | 13F | Russell Investments Group, Ltd. | 14,580,521 | -9.83 | 35,139 | -6.74 | ||||
| 2025-08-14 | 13F | Mariner, LLC | 121,913 | 106.89 | 294 | 113.87 | ||||
| 2025-08-14 | 13F | Banco BTG Pactual S.A. | 112,100 | -8.04 | 270 | -4.93 | ||||
| 2025-08-12 | 13F | Pathstone Holdings, LLC | 23,567 | 3.42 | 57 | 5.66 | ||||
| 2025-08-12 | 13F | Legal & General Group Plc | 3,344,122 | 0.00 | 8,043 | 3.43 | ||||
| 2025-08-12 | 13F | Jefferies Financial Group Inc. | 14,653 | -66.84 | 35 | -65.69 | ||||
| 2025-06-30 | 13F/A | Deutsche Bank Ag\ | 0 | -100.00 | 0 | |||||
| 2025-08-19 | 13F | Cape Investment Advisory, Inc. | 4,238 | 37.33 | 10 | 42.86 | ||||
| 2025-07-29 | NP | GBFFX - GMO Benchmark-Free Fund Class III | 271,100 | 589.82 | 661 | 474.78 | ||||
| 2025-08-14 | 13F | Two Sigma Investments, Lp | 9,615,096 | -42.44 | 23,172 | -40.46 | ||||
| 2025-07-22 | 13F | Sava Infond d.o.o. | 290,000 | 0.00 | 699 | 3.41 | ||||
| 2025-08-06 | NP | LINCOLN VARIABLE INSURANCE PRODUCTS TRUST - LVIP Loomis Sayles Global Growth Fund Standard Class | 1,488,776 | -5.26 | 3,588 | -2.02 | ||||
| 2025-07-08 | 13F | Chemistry Wealth Management LLC | 36,618 | 0.00 | 88 | 3.53 | ||||
| 2025-05-05 | 13F | Lindbrook Capital, Llc | 7,907 | -67.86 | 18 | -60.00 | ||||
| 2025-08-13 | 13F | Generation Capital Management LLC | 15,000 | 0.00 | 36 | 5.88 | ||||
| 2025-06-18 | NP | RETSX - Tax-Managed U.S. Large Cap Fund Class S | 7,529,693 | 110.73 | 19,050 | 188.20 | ||||
| 2025-07-23 | 13F | Winthrop Advisory Group LLC | 24,634 | 0.00 | 60 | 3.51 | ||||
| 2025-05-14 | 13F | Dorsey & Whitney Trust CO LLC | 0 | -100.00 | 0 | -100.00 | ||||
| 2025-07-31 | 13F | Whipplewood Advisors, LLC | 662 | 39.37 | 2 | 0.00 | ||||
| 2025-06-18 | NP | RSEAX - U.S. Strategic Equity Fund Class A | 1,571,671 | 0.00 | 3,976 | 36.77 | ||||
| 2025-07-24 | 13F | Us Bancorp \de\ | 129,562 | -21.44 | 312 | -18.75 | ||||
| 2025-08-14 | 13F | Goldman Sachs Group Inc | 4,083,797 | -18.33 | 9,842 | -15.53 | ||||
| 2025-08-28 | NP | SIEMX - SIT EMERGING MARKETS EQUITY FUND - CLASS F, effective 1-31-2017 (formerly Class A) | 413,410 | -62.13 | 996 | -60.83 | ||||
| 2025-07-15 | 13F | Jarislowsky, Fraser Ltd | 71,201 | 49.75 | 172 | 55.45 | ||||
| 2025-07-25 | 13F | Envestnet Portfolio Solutions, Inc. | 34,905 | 54.19 | 84 | 61.54 | ||||
| 2025-08-14 | 13F | Ubs Asset Management Americas Inc | 376,100 | 50.44 | 906 | 55.67 | ||||
| 2025-04-23 | 13F | International Assets Investment Management, Llc | 0 | -100.00 | 0 | |||||
| 2025-07-30 | 13F | Whittier Trust Co Of Nevada Inc | 772 | 0.00 | 2 | 0.00 | ||||
| 2025-08-13 | 13F | Legacy Capital Wealth Partners, LLC | 0 | -100.00 | 0 | |||||
| 2025-08-14 | 13F | Schonfeld Strategic Advisors LLC | 416,181 | 1,003 | ||||||
| 2025-08-07 | 13F | Parkside Financial Bank & Trust | 1,638 | 224.36 | 4 | 200.00 | ||||
| 2025-07-09 | 13F | Eldred Rock Partners, LLC | 3,549,857 | 0.06 | 8,555 | 4.08 | ||||
| 2025-08-07 | 13F | HighPoint Advisor Group LLC | 0 | -100.00 | 0 | |||||
| 2025-08-12 | 13F | MAI Capital Management | 816 | -92.08 | 2 | -95.83 | ||||
| 2025-08-11 | 13F | Bulltick Wealth Management, LLC | 38,511 | 93 | ||||||
| 2025-07-25 | 13F | Sequoia Financial Advisors, LLC | 184,384 | 85.18 | 444 | 91.38 | ||||
| 2025-08-14 | 13F | D. E. Shaw & Co., Inc. | 9,525,015 | 195.46 | 22,955 | 205.62 | ||||
| 2025-08-14 | 13F | Wiley Bros.-aintree Capital, Llc | 20,163 | 55.78 | 49 | 65.52 | ||||
| 2025-09-04 | 13F/A | Advisor Group Holdings, Inc. | 50,931 | -10.74 | 123 | -7.58 | ||||
| 2025-05-15 | 13F | Hrt Financial Lp | 0 | -100.00 | 0 | |||||
| 2025-07-10 | 13F | Western Pacific Wealth Management, LP | 1,000 | 0.00 | 2 | 0.00 | ||||
| 2025-07-28 | 13F | Allianz Asset Management GmbH | 150,000 | 362 | ||||||
| 2025-07-14 | 13F | Bank & Trust Co | 1,560 | 0.00 | 4 | 0.00 | ||||
| 2025-08-12 | 13F | XTX Topco Ltd | 0 | -100.00 | 0 | |||||
| 2025-08-14 | 13F | Headlands Technologies LLC | 38,132 | 92 | ||||||
| 2025-07-29 | 13F | Mountain Capital Investment Advisors, Inc | 11,087 | 0.00 | 27 | -3.70 | ||||
| 2025-08-27 | NP | Brighthouse Funds Trust I - SSGA Emerging Markets Enhanced Index Portfolio Class B | 1,027,300 | 171.70 | 2,476 | 181.25 | ||||
| 2025-08-11 | 13F | Bell Investment Advisors, Inc | 513 | 0.00 | 1 | 0.00 | ||||
| 2025-08-14 | 13F | Erste Asset Management GmbH | 250,000 | 0.00 | 590 | 3.51 | ||||
| 2025-05-15 | 13F | Scientech Research LLC | 0 | -100.00 | 0 | |||||
| 2025-08-12 | 13F | Contrarius Group Holdings Ltd | 0 | -100.00 | 0 | |||||
| 2025-06-26 | NP | DFEM - Dimensional Emerging Markets Core Equity 2 ETF | 554,944 | 6.76 | 1,404 | 46.10 | ||||
| 2025-07-10 | 13F | Wealth Enhancement Advisory Services, Llc | 119,963 | -64.62 | 296 | -62.53 | ||||
| 2025-06-26 | NP | Dfa Investment Trust Co - The Emerging Markets Series This fund is a listed as child fund of Dimensional Fund Advisors Lp and if that institution has disclosed ownership in this security, then these positions will not be double counted when calculating total shares and total value | 1,643,290 | 0.00 | 4,158 | 36.74 | ||||
| 2025-08-07 | NP | COBYX - The Cook & Bynum Fund | 483,092 | 0.00 | 1,164 | 3.47 | ||||
| 2025-08-14 | 13F | Ameriprise Financial Inc | 12,766 | 17.60 | 31 | 20.00 | ||||
| 2025-07-31 | 13F/A | Sendero Wealth Management, LLC | 21,540 | 0.00 | 52 | 2.00 | ||||
| 2025-07-29 | NP | SCPAX - Siit Large Cap Disciplined Equity Fund - Class A | 840,730 | 4.79 | 2,051 | 23.55 | ||||
| 2025-08-11 | 13F | Banque Cantonale Vaudoise | 693,600 | 0.00 | 2 | 0.00 | ||||
| 2025-08-14 | 13F | Colony Group, LLC | 19,224 | 35.27 | 46 | 39.39 | ||||
| 2025-08-28 | NP | QEMM - SPDR MSCI Emerging Markets StrategicFactors ETF | 3,414 | -3.97 | 8 | 0.00 | ||||
| 2025-08-14 | 13F | Federation des caisses Desjardins du Quebec | 96,214 | -2.06 | 232 | 1.32 | ||||
| 2025-08-19 | 13F | National Asset Management, Inc. | 57,953 | 12.99 | 140 | 39.00 | ||||
| 2025-08-13 | 13F | Provida Pension Fund Administrator | 0 | -100.00 | 0 | -100.00 | ||||
| 2025-08-25 | NP | EMEQ - Macquarie Focused Emerging Markets Equity ETF | 80,734 | 0.00 | 195 | 3.19 | ||||
| 2025-05-14 | 13F | Price T Rowe Associates Inc /md/ | 0 | -100.00 | 0 | |||||
| 2025-08-14 | 13F/A | Barclays Plc | 122,860 | 189.37 | 0 | |||||
| 2025-07-24 | 13F | Ronald Blue Trust, Inc. | 171,624 | 18.50 | 414 | 22.55 | ||||
| 2025-08-14 | 13F | Xponance, Inc. | 16,298 | 1.22 | 39 | 5.41 | ||||
| 2025-08-14 | 13F | Raymond James Financial Inc | 1,607,651 | -22.74 | 3,874 | -20.09 | ||||
| 2025-08-12 | 13F | Insigneo Advisory Services, Llc | 48,421 | 25.91 | 117 | 30.34 | ||||
| 2025-08-06 | 13F | Simmons Bank | 17,923 | 43 | ||||||
| 2025-04-21 | 13F | Nelson, Van Denburg & Campbell Wealth Management Group, LLC | 0 | -100.00 | 0 | |||||
| 2025-08-14 | 13F | Bnp Paribas Arbitrage, Sa | 283,529 | 5.77 | 683 | 9.46 | ||||
| 2025-07-29 | NP | FEGE - First Eagle Global Equity ETF | 979,225 | 175.21 | 2,389 | 224.59 | ||||
| 2025-08-28 | NP | SPGM - SPDR(R) Portfolio MSCI Global Stock Market ETF | 85,485 | 2.96 | 206 | 6.74 | ||||
| 2025-07-23 | 13F | Armstrong, Fleming & Moore, Inc | 0 | -100.00 | 0 | |||||
| 2025-04-28 | 13F | DAVENPORT & Co LLC | 0 | -100.00 | 0 | |||||
| 2025-08-13 | 13F | Scotia Capital Inc. | 263,290 | 0.63 | 635 | 4.11 | ||||
| 2025-08-14 | 13F | Stansberry Asset Management, Llc | 2,617,541 | 304.19 | 6,308 | 318.30 | ||||
| 2025-07-31 | 13F | Cambridge Investment Research Advisors, Inc. | 902,704 | -5.60 | 2 | 0.00 | ||||
| 2025-08-12 | 13F | Cornerstone Wealth Management, LLC | 12,900 | 31 | ||||||
| 2025-08-14 | 13F | Jane Street Group, Llc | 1,098,536 | 272.14 | 2,647 | 285.30 | ||||
| 2025-07-22 | 13F | Sage Investment Counsel LLC | 165,500 | 0.00 | 399 | 3.38 | ||||
| 2025-08-14 | 13F | Boston Private Wealth Llc | 0 | -100.00 | 0 | |||||
| 2025-04-21 | 13F | Essex Savings Bank | 0 | -100.00 | 0 | -100.00 | ||||
| 2025-08-04 | 13F | Atria Investments Llc | 103,393 | 48.98 | 249 | 54.66 | ||||
| 2025-07-15 | 13F | Fifth Third Bancorp | 246 | -85.66 | 1 | -100.00 | ||||
| 2025-07-22 | 13F | Old National Bancorp /in/ | 22,819 | 55 | ||||||
| 2025-05-14 | 13F | Orion Portfolio Solutions, LLC | 85,740 | 0.00 | 159 | 0.00 | ||||
| 2025-08-14 | 13F | TCG Advisory Services, LLC | 46,303 | -13.51 | 112 | -10.48 | ||||
| 2025-08-27 | NP | JNL SERIES TRUST - JNL/GQG Emerging Markets Equity Fund (A) | 3,008,691 | -23.81 | 7,251 | -0.75 | ||||
| 2025-04-14 | 13F | First Citizens Bank & Trust Co | 0 | -100.00 | 0 | |||||
| 2025-05-09 | 13F | Ruffer LLP | 0 | -100.00 | 0 | |||||
| 2025-05-01 | 13F | Schechter Investment Advisors, LLC | 434,671 | -7.77 | 1,013 | 16.19 | ||||
| 2025-08-08 | 13F | Capstone Financial Advisors, Inc. | 50,000 | 0.00 | 120 | 3.45 | ||||
| 2025-05-05 | 13F | Eagle Bay Advisors LLC | 0 | -100.00 | 0 | -100.00 | ||||
| 2025-07-15 | 13F | Bfsg, Llc | 115,130 | 0.00 | 277 | 3.36 | ||||
| 2025-08-14 | 13F | Mpwm Advisory Solutions, Llc | 0 | -100.00 | 0 | |||||
| 2025-07-14 | 13F | Foundation Resource Management Inc | 6,826,347 | 0.17 | 16,451 | 3.61 | ||||
| 2025-08-08 | 13F | Creative Planning | 125,401 | 19.28 | 302 | 23.77 | ||||
| 2025-07-11 | 13F | Assenagon Asset Management S.A. | 0 | -100.00 | 0 | |||||
| 2025-08-28 | NP | SPEM - SPDR(R) Portfolio Emerging Markets ETF | 6,405,285 | 8.75 | 15,437 | 12.49 | ||||
| 2025-07-14 | 13F | CHICAGO TRUST Co NA | 131,282 | 19.35 | 316 | 23.44 | ||||
| 2025-08-13 | 13F | Invesco Ltd. | 3,978,085 | 4.59 | 9,587 | 8.18 | ||||
| 2025-07-21 | 13F | Mirae Asset Global Investments Co., Ltd. | 242,669 | -73.42 | 585 | -76.80 | ||||
| 2025-08-07 | 13F | Montag A & Associates Inc | 4,808 | -7.75 | 12 | -8.33 | ||||
| 2025-08-04 | 13F | Mesirow Financial Investment Management, Inc. | 40,270 | 23.96 | 97 | 29.33 | ||||
| 2025-08-14 | 13F | Toroso Investments, LLC | 0 | -100.00 | 0 | |||||
| 2025-08-11 | 13F | Anderson Financial Strategies, LLC | 0 | -100.00 | 0 | |||||
| 2025-08-12 | 13F | Private Management Group Inc | 15,377,504 | -0.40 | 37,060 | 3.02 | ||||
| 2025-08-04 | 13F | Savvy Advisors, Inc. | 0 | -100.00 | 0 | |||||
| 2025-08-12 | 13F | Heron Bay Capital Management | 0 | -100.00 | 0 | |||||
| 2025-08-13 | 13F | Brandes Investment Partners, Lp | 20,606,928 | -1.56 | 49,663 | 1.82 | ||||
| 2025-08-28 | NP | SEUIX - Simt Large Cap Value Fund Class I | 1,387,221 | -13.03 | 3,343 | -10.04 | ||||
| 2025-08-04 | 13F | Balentine LLC | 11,548 | 0.00 | 28 | 3.85 | ||||
| 2025-07-29 | NP | LSAGX - Loomis Sayles Global Growth Fund Class A | 835,741 | 16.37 | 2,039 | 37.21 | ||||
| 2025-08-14 | 13F | Group One Trading, L.p. | Put | 821,000 | 384.94 | 1,979 | 402.03 | |||
| 2025-08-27 | NP | RYWTX - Emerging Markets 2x Strategy Fund Class A | 23,469 | 157.05 | 57 | 166.67 | ||||
| 2025-08-27 | NP | BBTIX - Bridge Builder Tax Managed International Equity Fund | 1,197,881 | 0.00 | 2,887 | 3.40 | ||||
| 2025-08-06 | 13F | Commonwealth Equity Services, Llc | 119,395 | 6.36 | 0 | |||||
| 2025-08-14 | 13F | Vident Advisory, LLC | 43,441 | -78.63 | 105 | -78.01 | ||||
| 2025-08-14 | 13F | Group One Trading, L.p. | Call | 37,100 | 148.99 | 89 | 161.76 | |||
| 2025-08-21 | NP | MNCSX - Mercer Non-US Core Equity Fund Class I | 0 | -100.00 | 0 | -100.00 | ||||
| 2025-08-14 | 13F | Group One Trading, L.p. | 403,820 | 190.72 | 973 | 201.24 | ||||
| 2025-07-30 | NP | APIE - ActivePassive International Equity ETF | 364,253 | -11.71 | 889 | 1.60 | ||||
| 2025-07-31 | 13F | 180 Wealth Advisors, Llc | 37,591 | 4.06 | 91 | 7.14 | ||||
| 2025-08-13 | 13F | Amundi | 122,148 | -46.78 | 304 | -45.23 | ||||
| 2025-08-14 | 13F | BTG Pactual Asset Management US LLC | 97,668 | 235 | ||||||
| 2025-08-06 | 13F | Altrius Capital Management Inc | 3,973,716 | -2.09 | 9,577 | 1.27 | ||||
| 2025-08-13 | 13F | Ted Buchan & Co | 0 | -100.00 | 0 |