Mga Batayang Estadistika
| Pemilik Institusional | 672 total, 670 long only, 2 short only, 0 long/short - change of 4.17% MRQ |
| Alokasi Portofolio Rata-rata | 1.3698 % - change of -4.22% MRQ |
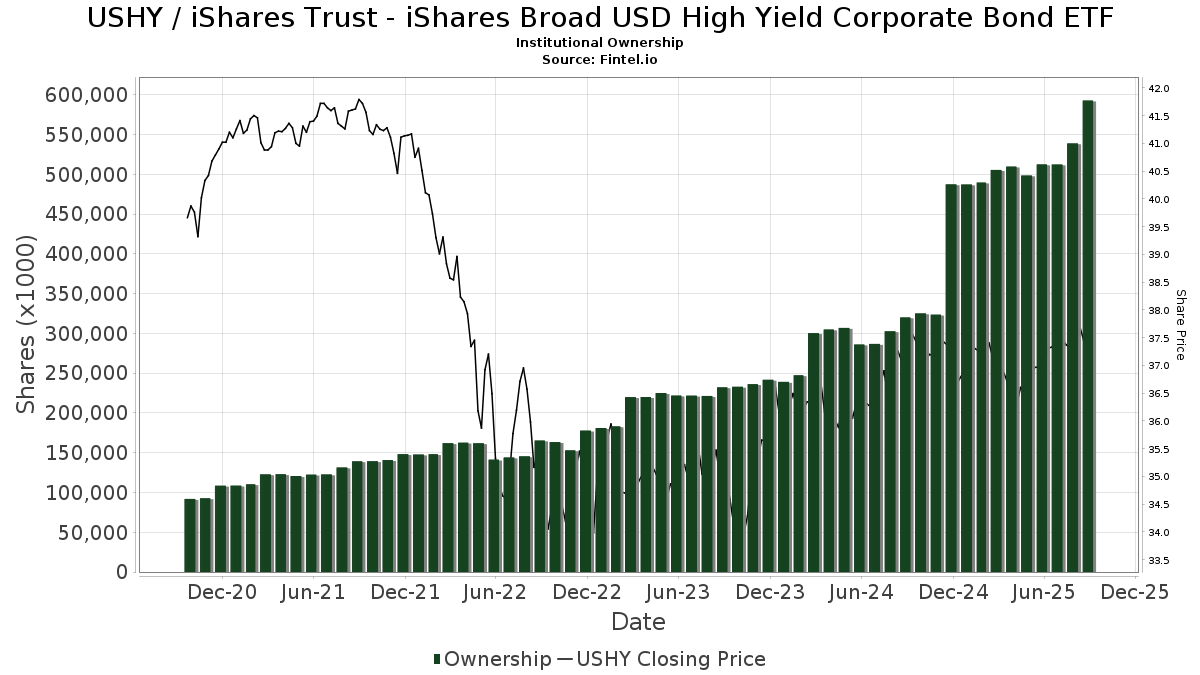
| Saham Institusional (Jangka Panjang) | 592,628,668 (ex 13D/G) - change of 80.28MM shares 15.67% MRQ |
| Nilai Institusional (Jangka Panjang) | $ 21,046,052 USD ($1000) |
Kepemilikan Institusional dan Pemegang Saham
iShares Trust - iShares Broad USD High Yield Corporate Bond ETF (US:USHY) memiliki 672 pemilik institusional dan pemegang saham yang telah mengajukan formulir 13D/G atau 13F kepada Komisi Bursa Efek (Securities Exchange Commission/SEC). Lembaga-lembaga ini memegang total 596,044,963 saham. Pemegang saham terbesar meliputi Prudential Plc, BlackRock, Inc., Wells Fargo & Company/mn, Northern Trust Corp, Bank Of America Corp /de/, Jpmorgan Chase & Co, BlackRock Funds V - BlackRock High Yield Bond Portfolio Service Shares, Jones Financial Companies Lllp, Ilmarinen Mutual Pension Insurance Co, and Raymond James Financial Inc .
Struktur kepemilikan institusional iShares Trust - iShares Broad USD High Yield Corporate Bond ETF (BATS:USHY) menunjukkan posisi terkini di perusahaan oleh institusi dan dana, serta perubahan terbaru dalam ukuran posisi. Pemegang saham utama dapat mencakup investor individu, reksa dana, dana lindung nilai, atau institusi. Jadwal 13D menunjukkan bahwa investor memegang (atau pernah memegang) lebih dari 5% saham perusahaan dan bermaksud (atau pernah bermaksud) untuk secara aktif mengejar perubahan strategi bisnis. Jadwal 13G menunjukkan investasi pasif lebih dari 5%.
The share price as of September 11, 2025 is 37.70 / share. Previously, on September 12, 2024, the share price was 37.26 / share. This represents an increase of 1.17% over that period.
Skor Sentimen Dana
Skor Sentimen Dana (sebelumnya dikenal sebagai Skor Akumulasi Kepemilikan) menemukan saham-saham yang paling banyak dibeli oleh dana. Ini adalah hasil dari model kuantitatif multi-faktor yang canggih yang mengidentifikasi perusahaan dengan tingkat akumulasi institusional tertinggi. Model penilaian menggunakan kombinasi dari total peningkatan pemilik yang diungkapkan, perubahan dalam alokasi portofolio pada pemilik tersebut, dan metrik lainnya. Angka berkisar dari 0 hingga 100, dengan angka yang lebih tinggi menunjukkan tingkat akumulasi yang lebih tinggi dibandingkan dengan perusahaan sejenisnya, dan 50 adalah rata-ratanya.
Frekuensi Pembaruan: Setiap Hari
Lihat Ownership Explorer, yang menyediakan daftar perusahaan dengan peringkat tertinggi.
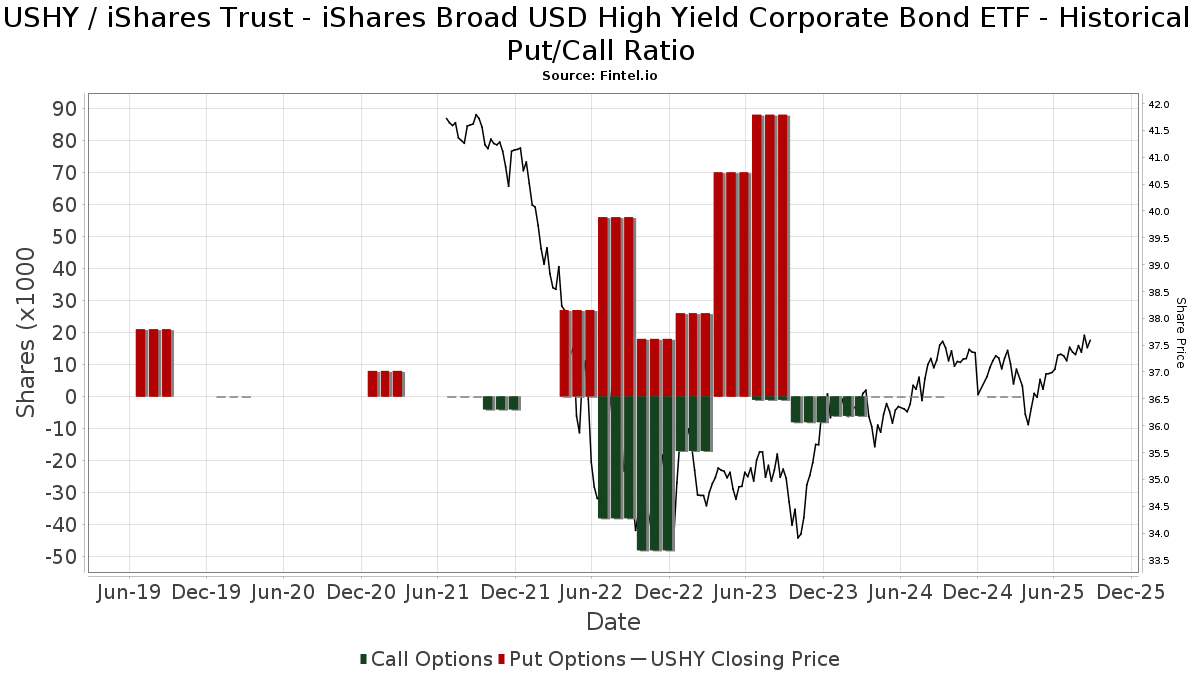
Rasio Put/Call Institusional
Selain melaporkan isu ekuitas dan utang standar, institusi dengan aset di bawah manajemen lebih dari 100 juta dolar AS juga harus mengungkapkan kepemilikan opsi put dan call mereka. Karena opsi put umumnya menunjukkan sentimen negatif, dan opsi call menunjukkan sentimen positif, kita dapat mengetahui sentimen institusional secara keseluruhan dengan memplot rasio put terhadap call. Grafik di sebelah kanan memplot rasio put/call historis untuk instrumen ini.
Menggunakan Rasio Put/Call sebagai indikator sentimen investor mengatasi salah satu kekurangan utama dari penggunaan total kepemilikan institusional, yaitu sejumlah besar aset yang dikelola diinvestasikan secara pasif untuk melacak indeks. Dana yang dikelola secara pasif biasanya tidak membeli opsi, sehingga indikator rasio put/call lebih akurat dalam melacak sentimen dana yang dikelola secara aktif.
Pengajuan 13D/G
Kami menyajikan pengajuan 13D/G secara terpisah dari pengajuan 13F karena perlakuan yang berbeda oleh SEC. Pengajuan 13D/G dapat diajukan oleh kelompok investor (dengan satu pemimpin), sedangkan pengajuan 13F tidak bisa. Hal ini mengakibatkan situasi di mana seorang investor dapat mengajukan 13D/G yang melaporkan satu nilai untuk total saham (mewakili semua saham yang dimiliki oleh kelompok investor), tetapi kemudian mengajukan 13F yang melaporkan nilai yang berbeda untuk total saham (mewakili kepemilikan mereka sendiri). Ini berarti bahwa kepemilikan saham dari pengajuan 13D/G dan pengajuan 13F seringkali tidak dapat dibandingkan secara langsung, sehingga kami menyajikannya secara terpisah.
Catatan: Mulai 16 Mei 2021, kami tidak lagi menampilkan pemilik yang belum mengajukan 13D/G dalam setahun terakhir. Sebelumnya, kami menampilkan riwayat lengkap pengajuan 13D/G. Secara umum, entitas yang diwajibkan untuk mengajukan pengajuan 13D/G harus mengajukan setidaknya setiap tahun sebelum mengirimkan pengajuan penutupan. Namun, terkadang dana keluar dari posisi tanpa mengirimkan pengajuan penutupan (misalnya, mereka menghentikan operasi), sehingga menampilkan riwayat lengkap terkadang menyebabkan kebingungan tentang kepemilikan saat ini. Untuk mencegah kebingungan, kami sekarang hanya menampilkan pemilik 'saat ini' - yaitu - pemilik yang telah mengajukan dalam setahun terakhir.
Upgrade to unlock premium data.
| Tanggal File | Formulir | Investor | Sebelumnya Saham |
Terbaru Saham |
Δ Saham (Persen) |
Kepemilikan (Persen) |
Δ Pagmamay-ari (Persen) |
|
|---|---|---|---|---|---|---|---|---|
| 2025-04-22 | BlackRock, Inc. | 78,000 | 1,172,683 | 1,403.44 | 0.20 | -98.97 | ||
| 2025-04-15 | BlackRock Portfolio Management LLC | 37,591,883 | 6.90 |
Pengajuan 13F dan NPORT
Detail pada pengajuan 13F tersedia gratis. Detail pada pengajuan NP memerlukan keanggotaan premium. Baris berwarna hijau menunjukkan posisi baru. Baris berwarna merah menunjukkan posisi yang sudah ditutup. Klik tautan ini ikon untuk melihat riwayat transaksi selengkapnya.
Tingkatkan
untuk membuka data premium dan mengekspor ke Excel ![]() .
.
Important Note
In an effort to reduce load times for our mobile users, we are testing some ways to deliver lighter pages.
In this first test, we will deliver only the most recent 750 transactions (out of 804 for this stock). If you are interested in loading *all* the transactions for this company, click the "load all" button below. This is just a test and if you don't like it, please let us know by submitting some gentle feedback via the link at the bottom of this page.
Load All| Tanggal File | Sumber | Investor | Ketik | Presyo ng Avg (Silangan) |
Saham | Δ Saham (%) |
Dilaporkan Nilai ($1000) |
Nilai Δ (%) |
Alokasi Port (%) |
|
|---|---|---|---|---|---|---|---|---|---|---|
| 2025-08-13 | 13F | Millstone Evans Group, LLC | 0 | -100.00 | 0 | |||||
| 2025-07-18 | 13F | Vicus Capital | 82,539 | 6.02 | 3,096 | 8.06 | ||||
| 2025-07-23 | 13F | Venturi Wealth Management, LLC | 1,349,330 | 4,385.21 | 50,613 | 4,472.09 | ||||
| 2025-04-25 | NP | PMSAX - Global Multi-Strategy Fund Class A | 15,560 | 7.05 | 583 | 6.79 | ||||
| 2025-07-11 | 13F | Grove Bank & Trust | 223,846 | 1.56 | 8,396 | 3.49 | ||||
| 2025-07-09 | 13F | VisionPoint Advisory Group, LLC | 80,654 | 4.18 | 3,025 | 6.18 | ||||
| 2025-07-28 | 13F | Axxcess Wealth Management, Llc | 872,245 | -1.99 | 32,718 | -0.13 | ||||
| 2025-07-30 | NP | AMHYX - INVESCO High Yield Fund Class A | 935,000 | 34,623 | ||||||
| 2025-07-30 | 13F | Bogart Wealth, LLC | 419 | 0.00 | 16 | 0.00 | ||||
| 2025-08-04 | 13F | Quaker Wealth Management, LLC | 2 | 0 | ||||||
| 2025-07-24 | 13F | Endeavor Private Wealth, Inc. | 31,592 | -51.15 | 1,185 | -50.21 | ||||
| 2025-08-14 | 13F | Raymond James Financial Inc | 16,496,902 | 3.81 | 618,799 | 5.78 | ||||
| 2025-08-08 | 13F | Principal Financial Group Inc | 4,220,839 | 1,134.11 | 158,324 | 1,157.63 | ||||
| 2025-08-27 | NP | TOBAX - Touchstone Active Bond Fund Class A | 35,191 | 1,320 | ||||||
| 2025-07-29 | NP | WAVLX - Wavelength Interest Rate Neutral Fund | 143,215 | -18.45 | 5,303 | -19.36 | ||||
| 2025-08-12 | 13F | Charles Schwab Investment Management Inc | 2,908,868 | -9.80 | 109,112 | -8.08 | ||||
| 2025-07-17 | 13F | Coastline Trust Co | 48 | 0.00 | 2 | 0.00 | ||||
| 2025-08-13 | 13F | Northwestern Mutual Wealth Management Co | 386,653 | 39.74 | 14,503 | 42.40 | ||||
| 2025-06-23 | NP | IYLD - iShares Morningstar Multi-Asset Income ETF | 468,504 | 2.18 | 17,147 | 0.29 | ||||
| 2025-08-29 | NP | GDMA - Gadsden Dynamic Multi-Asset ETF | 0 | -100.00 | 0 | -100.00 | ||||
| 2025-03-31 | NP | FSHNX - Fidelity Series High Income Fund | 39,100 | 0.00 | 1,458 | 0.48 | ||||
| 2025-08-14 | 13F | Transamerica Financial Advisors, Inc. | 0 | -100.00 | 0 | |||||
| 2025-07-17 | 13F | Charles Schwab Trust Co | 97,813 | 206.88 | 3,669 | 212.70 | ||||
| 2025-07-29 | NP | Invesco High Income Trust Ii This fund is a listed as child fund of Invesco Ltd. and if that institution has disclosed ownership in this security, then these positions will not be double counted when calculating total shares and total value | 85,000 | 3,148 | ||||||
| 2025-08-12 | 13F | WealthTrak Capital Management LLC | 0 | -100.00 | 0 | |||||
| 2025-08-13 | 13F | Jones Financial Companies Lllp | 22,299,575 | 7.17 | 834,004 | 9.00 | ||||
| 2025-08-11 | 13F | Empowered Funds, LLC | 0 | -100.00 | 0 | |||||
| 2025-08-06 | 13F | Prospera Financial Services Inc | 11,671 | -2.20 | 438 | -0.46 | ||||
| 2025-08-14 | 13F | Diversify Advisory Services, LLC | 5,733 | 2.50 | 214 | 4.39 | ||||
| 2025-07-08 | 13F | Zrc Wealth Management, Llc | 1,526 | 1.73 | 57 | 3.64 | ||||
| 2025-07-10 | 13F | Bigelow Investment Advisors, LLC | 6,056 | -0.92 | 227 | 1.34 | ||||
| 2025-08-14 | 13F | Strategic Wealth Designers | 0 | 0 | ||||||
| 2025-07-31 | 13F | CAP Partners, LLC | 26,543 | 3.12 | 996 | 5.07 | ||||
| 2025-08-07 | 13F | Vise Technologies, Inc. | 142,422 | 6.11 | 5,342 | 8.20 | ||||
| 2025-08-11 | 13F | Portside Wealth Group, LLC | 18,980 | 10.41 | 712 | 12.50 | ||||
| 2025-05-13 | 13F | CacheTech Inc. | 13,325 | -11.53 | 490 | -11.55 | ||||
| 2025-07-09 | 13F | Harbor Capital Advisors, Inc. | 12,464 | 0 | ||||||
| 2025-06-13 | NP | JHYIX - abrdn Global High Income Fund Institutional Class | 76,440 | 2,798 | ||||||
| 2025-08-28 | 13F/A | Tolleson Wealth Management, Inc. | 167,643 | -3.34 | 6,288 | -1.50 | ||||
| 2025-07-15 | 13F | FLP Wealth Management, LLC | 0 | -100.00 | 0 | |||||
| 2025-05-09 | 13F | Cary Street Partners Financial Llc | 0 | -100.00 | 0 | |||||
| 2025-08-14 | 13F | BRITISH COLUMBIA INVESTMENT MANAGEMENT Corp | 14,399,000 | 526.32 | 540,106 | 538.23 | ||||
| 2025-07-16 | 13F | Octavia Wealth Advisors, LLC | 87,478 | 1.47 | 3,281 | 3.40 | ||||
| 2025-08-26 | NP | EQ ADVISORS TRUST - Equitable Moderate Growth MF/ETF Portfolio Class K | 18,510 | -38.73 | 694 | -37.59 | ||||
| 2025-08-06 | 13F | Moors & Cabot, Inc. | 10,123 | 0.34 | 380 | 2.16 | ||||
| 2025-08-19 | 13F | Hohimer Wealth Management, Llc | 110,765 | -4.35 | 4,155 | -2.53 | ||||
| 2025-08-14 | 13F | EP Wealth Advisors, Inc. | 5,777 | -30.16 | 217 | -28.95 | ||||
| 2025-05-12 | 13F | Sandy Spring Bank | 161 | 6 | ||||||
| 2025-07-28 | 13F | Eq Wealth Advisors, Llc | 142 | 0.00 | 5 | 0.00 | ||||
| 2025-05-23 | NP | TRANSAMERICA SERIES TRUST - Transamerica PIMCO Tactical - Growth VP Service | 68,841 | 0.00 | 2,534 | 0.08 | ||||
| 2025-08-13 | 13F | Cheviot Value Management, LLC | 29 | 0.00 | 1 | 0.00 | ||||
| 2025-08-04 | 13F | AMG National Trust Bank | 18,383 | 2.07 | 690 | 4.08 | ||||
| 2025-08-11 | 13F | Nomura Asset Management Co Ltd | 276,400 | -23.98 | 10,368 | -22.54 | ||||
| 2025-08-13 | 13F | Capital Analysts, Inc. | 23,453 | 104.03 | 1 | |||||
| 2025-08-13 | 13F | EverSource Wealth Advisors, LLC | 23,686 | 16.40 | 888 | 18.72 | ||||
| 2025-04-29 | 13F | Td Private Client Wealth Llc | 0 | -100.00 | 0 | |||||
| 2025-08-13 | 13F | Baird Financial Group, Inc. | 835,552 | 206.71 | 31,342 | 212.53 | ||||
| 2025-07-08 | 13F | Twele Capital Management, Inc. | 42,630 | 0.00 | 1,599 | 1.91 | ||||
| 2025-07-31 | 13F | Keeler THomas Management LLC | 175,910 | 6,598 | ||||||
| 2025-08-26 | 13F/A | Thrivent Financial For Lutherans | 5,617,910 | -9.09 | 211 | -7.49 | ||||
| 2025-08-07 | 13F | PFG Advisors | 5,395 | 202 | ||||||
| 2025-05-15 | 13F | BlueCrest Capital Management Ltd | 0 | -100.00 | 0 | |||||
| 2025-08-04 | 13F | Leeward Financial Partners, LLC | 59,134 | 6.58 | 2,218 | 8.62 | ||||
| 2025-07-31 | 13F | Japan Science & Technology Agency | 8,819,906 | 0.00 | 330,835 | 1.90 | ||||
| 2025-08-12 | 13F | Cornerstone Wealth Management, LLC | 7,093 | 266 | ||||||
| 2025-05-27 | NP | BlackRock Funds V - BlackRock Strategic Income Opportunities Portfolio Investor A Shares | 0 | -100.00 | 0 | -100.00 | ||||
| 2025-07-18 | 13F | New Wave Wealth Advisors Llc | 74,319 | -0.34 | 2,788 | 1.53 | ||||
| 2025-07-30 | 13F | BTS Asset Management, Inc. | 805,427 | 274.61 | 30,212 | 281.74 | ||||
| 2025-08-12 | 13F | LPL Financial LLC | 4,376,374 | -9.69 | 164,158 | -7.98 | ||||
| 2025-08-12 | 13F | Titleist Asset Management, Llc | 40,678 | -0.31 | 1,526 | 1.53 | ||||
| 2025-07-28 | 13F | Copia Wealth Management | 103 | 4 | ||||||
| 2025-08-12 | 13F | Change Path, LLC | 147,003 | 35.61 | 5,514 | 38.20 | ||||
| 2025-04-23 | 13F | GHP Investment Advisors, Inc. | 0 | -100.00 | 0 | |||||
| 2025-07-30 | 13F/A | Old Point Trust & Financial Services N A | 120 | -90.68 | 5 | -91.49 | ||||
| 2025-07-10 | 13F | Tompkins Financial Corp | 223 | 0.00 | 8 | 0.00 | ||||
| 2025-08-28 | NP | Northern Lights Fund Trust - Sierra Tactical Bond Fund Investor Class Shares | 8,122,600 | -6.68 | 304,679 | -4.91 | ||||
| 2025-08-14 | 13F | Bragg Financial Advisors, Inc | 7,124 | -4.47 | 267 | -2.55 | ||||
| 2025-08-14 | 13F | Gotham Asset Management, LLC | 41,063 | -0.20 | 1,540 | 1.72 | ||||
| 2025-07-25 | 13F | Apollon Wealth Management, LLC | 20,349 | -5.94 | 763 | -4.15 | ||||
| 2025-04-30 | 13F | Nisa Investment Advisors, Llc | 0 | -100.00 | 0 | |||||
| 2025-07-29 | 13F | Unison Advisors LLC | 59,243 | 3.07 | 2,222 | 5.06 | ||||
| 2025-08-04 | 13F | Flagship Harbor Advisors, Llc | 0 | -100.00 | 0 | |||||
| 2025-08-07 | 13F | Summit X, LLC | 0 | -100.00 | 0 | |||||
| 2025-08-12 | 13F | Personal Cfo Solutions, Llc | 6,444 | 242 | ||||||
| 2025-08-08 | 13F | Advyzon Investment Management, LLC | 13,632 | 47.80 | 511 | 50.74 | ||||
| 2025-05-12 | 13F | Polen Capital Management Llc | 0 | -100.00 | 0 | |||||
| 2025-07-21 | 13F | DHJJ Financial Advisors, Ltd. | 0 | -100.00 | 0 | |||||
| 2025-07-18 | 13F | PFG Investments, LLC | 12,774 | 3.19 | 479 | 5.27 | ||||
| 2025-07-29 | NP | HFND - Unlimited HFND Multi-Strategy Return Tracker ETF | 0 | -100.00 | 0 | -100.00 | ||||
| 2025-07-25 | 13F | Genesee Capital Advisors, LLC | 8,149 | -26.79 | 306 | -25.43 | ||||
| 2025-08-01 | 13F | New York Life Investment Management Llc | 310,853 | 30.87 | 11,660 | 33.36 | ||||
| 2025-08-28 | NP | BlackRock Funds II - BLACKROCK MANAGED INCOME FUND CLASS K SHARES | 743,531 | 27,890 | ||||||
| 2025-07-18 | 13F | Trust Co Of Vermont | 348 | 13 | ||||||
| 2025-08-26 | NP | Blackrock Floating Rate Income Trust This fund is a listed as child fund of BlackRock, Inc. and if that institution has disclosed ownership in this security, then these positions will not be double counted when calculating total shares and total value | 195,000 | 11.43 | 7,314 | 13.55 | ||||
| 2025-07-24 | 13F/A | TFR Capital, LLC. | 10,403 | -1.65 | 390 | 0.26 | ||||
| 2025-07-10 | 13F | Sovran Advisors, LLC | 27,447 | 120.78 | 1,021 | 126.89 | ||||
| 2025-08-14 | 13F | Alliancebernstein L.p. | 401,924 | 3.57 | 15,076 | 5.54 | ||||
| 2025-08-18 | 13F | Hollencrest Capital Management | 20 | 0.00 | 1 | |||||
| 2025-08-08 | 13F | Angel Oak Capital Advisors, LLC | 48,500 | -10.81 | 1,819 | -9.10 | ||||
| 2025-07-17 | 13F | Janney Montgomery Scott LLC | 58,937 | 40.55 | 2 | 100.00 | ||||
| 2025-08-14 | 13F | Comerica Bank | 148,390 | -8.58 | 5,566 | -6.83 | ||||
| 2025-08-12 | 13F | Mmbg Investment Advisors Co. | 14,440 | 0.00 | 542 | 1.88 | ||||
| 2025-08-13 | 13F | Loomis Sayles & Co L P | 311,410 | -53.28 | 11,681 | 48,566.67 | ||||
| 2025-08-12 | 13F | Prudential Financial Inc | 404,138 | -2.41 | 15,159 | -0.56 | ||||
| 2025-08-14 | 13F | Harwood Advisory Group, LLC | 0 | -100.00 | 0 | |||||
| 2025-08-14 | 13F | Clark Capital Management Group, Inc. | 0 | -100.00 | 0 | |||||
| 2025-07-16 | 13F | Kathmere Capital Management, LLC | 82,929 | 1.97 | 3,111 | 3.91 | ||||
| 2025-08-12 | 13F | Hillsdale Investment Management Inc. | 11,280 | 26.60 | 423 | 29.36 | ||||
| 2025-07-09 | 13F | Pines Wealth Management, LLC | 14,856 | -23.71 | 555 | -19.21 | ||||
| 2025-07-23 | 13F | Allegiance Financial Group Advisory Services LLC | 400,305 | 6.64 | 15,015 | 8.66 | ||||
| 2025-08-25 | 13F/A | Promus Capital, LLC | 1,881 | 0.00 | 71 | 1.45 | ||||
| 2025-05-07 | 13F | Spectrum Wealth Counsel, LLC | 0 | -100.00 | 0 | -100.00 | ||||
| 2025-08-14 | 13F | Mpwm Advisory Solutions, Llc | 548 | -16.34 | 21 | -16.67 | ||||
| 2025-06-23 | NP | Global Macro Absolute Return Advantage Portfolio - Global Macro Absolute Return Advantage Portfolio | Short | -2,613,963 | -95,671 | |||||
| 2025-08-13 | 13F | Russell Investments Group, Ltd. | 0 | -100.00 | 0 | |||||
| 2025-08-14 | 13F | Great Valley Advisor Group, Inc. | 92,968 | 6.09 | 3,487 | 8.12 | ||||
| 2025-07-17 | 13F | Raleigh Capital Management Inc. | 267 | 1.52 | 10 | 11.11 | ||||
| 2025-07-17 | 13F | Sound Income Strategies, LLC | 5,668 | 2.11 | 213 | 3.92 | ||||
| 2025-07-07 | 13F | Salem Investment Counselors Inc | 0 | -100.00 | 0 | |||||
| 2025-08-08 | 13F | Foundations Investment Advisors, LLC | 13,140 | 6.64 | 493 | 8.61 | ||||
| 2025-08-14 | 13F | Smartleaf Asset Management LLC | 1,841 | 8.36 | 69 | 9.68 | ||||
| 2025-08-28 | NP | BlackRock Series Fund, Inc. - BlackRock Global Allocation Portfolio This fund is a listed as child fund of BlackRock, Inc. and if that institution has disclosed ownership in this security, then these positions will not be double counted when calculating total shares and total value | 4,187 | 0.00 | 157 | 1.95 | ||||
| 2025-08-12 | NP | KAMIX - Kensington Managed Income Fund Institutional Class Shares | 3,795,450 | -17.54 | 142,367 | -15.97 | ||||
| 2025-08-14 | 13F | CoreCap Advisors, LLC | 236,694 | 9.58 | 8,878 | 11.66 | ||||
| 2025-07-25 | 13F | Bricktown Capital, LLC | 1,574,912 | 0.26 | 59,075 | 2.17 | ||||
| 2025-08-11 | 13F | Advisor Resource Council | 0 | -100.00 | 0 | |||||
| 2025-07-11 | 13F | First PREMIER Bank | 14,200 | 0.00 | 1 | |||||
| 2025-06-26 | NP | BlackRock ETF Trust II - BlackRock Floating Rate Loan ETF This fund is a listed as child fund of BlackRock, Inc. and if that institution has disclosed ownership in this security, then these positions will not be double counted when calculating total shares and total value | 18,000 | -45.45 | 659 | -46.50 | ||||
| 2025-08-28 | NP | ABHIX - High-yield Fund Investor Class This fund is a listed as child fund of American Century Companies Inc and if that institution has disclosed ownership in this security, then these positions will not be double counted when calculating total shares and total value | 53,100 | 0.00 | 1,992 | 1.89 | ||||
| 2025-07-23 | 13F | Nbt Bank N A /ny | 2,233 | 0.00 | 84 | 1.22 | ||||
| 2025-08-14 | 13F | Gen-Wealth Partners Inc | 384 | 14 | ||||||
| 2025-08-06 | 13F | Adviser Investments LLC | 0 | -100.00 | 0 | |||||
| 2025-08-12 | 13F | YANKCOM Partnership | 111 | 0.00 | 4 | 0.00 | ||||
| 2025-07-03 | 13F | CPA Asset Management LLC | 9,384 | 0.00 | 352 | 1.74 | ||||
| 2025-07-17 | 13F | Neumann Capital Management, LLC | 31,427 | 11.78 | 1,179 | 13.93 | ||||
| 2025-07-09 | 13F | First Financial Corp /in/ | 702 | -40.91 | 26 | -39.53 | ||||
| 2025-07-17 | 13F | Independence Bank of Kentucky | 133 | 0.00 | 5 | 0.00 | ||||
| 2025-08-08 | 13F | Gts Securities Llc | 0 | -100.00 | 0 | |||||
| 2025-08-13 | 13F | NEOS Investment Management LLC | 1,182,174 | 23.01 | 44,094 | 25.37 | ||||
| 2025-07-08 | 13F | Nbc Securities, Inc. | 1,037 | 221.05 | 0 | |||||
| 2025-05-22 | NP | DEUTSCHE DWS VARIABLE SERIES II - DWS High Income VIP Class A | 30,000 | -40.00 | 1,104 | -39.97 | ||||
| 2025-08-14 | 13F | Murphy & Mullick Capital Management Corp | 69 | 0.00 | 3 | 0.00 | ||||
| 2025-07-18 | 13F | SOA Wealth Advisors, LLC. | 620 | 23 | ||||||
| 2025-07-31 | 13F | Wright Fund Managment, LLC | 11,630,696 | 0.00 | 428,126 | 0.00 | ||||
| 2025-08-15 | 13F | CI Private Wealth, LLC | 15,713 | 589 | ||||||
| 2025-08-12 | 13F | DiMeo Schneider & Associates, L.L.C. | 32,534 | 0.00 | 1,220 | 1.92 | ||||
| 2025-07-14 | 13F | Pacifica Partners Inc. | 695 | 0.00 | 26 | 0.00 | ||||
| 2025-08-12 | 13F | Coldstream Capital Management Inc | 0 | -100.00 | 0 | |||||
| 2025-08-01 | 13F | a16z Perennial Management, L.P. | 226,366 | 23,422 | ||||||
| 2025-07-22 | 13F | Grimes & Company, Inc. | 4,445,406 | 166,747 | ||||||
| 2025-07-29 | 13F | Private Trust Co Na | 8,998 | -0.35 | 338 | 1.51 | ||||
| 2025-07-09 | 13F | Catalyst Private Wealth, Llc | 0 | -100.00 | 0 | |||||
| 2025-07-28 | NP | OHYFX - JPMorgan High Yield Fund Class I | 2,409,500 | 508.46 | 89,224 | 504.41 | ||||
| 2025-07-16 | 13F | Rebalance, Llc | 1,711,264 | 0.73 | 64,190 | 2.65 | ||||
| 2025-08-08 | 13F | Emerald Investment Partners, Llc | 0 | -100.00 | 0 | |||||
| 2025-05-01 | 13F | Hughes Financial Services, LLC | 0 | 0 | ||||||
| 2025-08-14 | 13F | IHT Wealth Management, LLC | 17,265 | -16.45 | 648 | -14.87 | ||||
| 2025-07-18 | 13F | Pure Financial Advisors, Inc. | 14,110 | 57.23 | 529 | 60.30 | ||||
| 2025-07-14 | 13F | Armstrong Advisory Group, Inc | 1,281 | 3.14 | 48 | 6.67 | ||||
| 2025-08-14 | 13F | New England Asset Management Inc | 53,145 | 0.00 | 1,993 | 1.89 | ||||
| 2025-05-01 | 13F | BankPlus Trust Department | 0 | -100.00 | 0 | |||||
| 2025-07-30 | 13F | Phillips Financial Management, Llc | 523,249 | 1.63 | 19,627 | 3.57 | ||||
| 2025-08-13 | 13F | Barclays Plc | 0 | -100.00 | 0 | |||||
| 2025-08-08 | 13F | Pnc Financial Services Group, Inc. | 124,090 | 282.91 | 4,655 | 290.44 | ||||
| 2025-08-13 | 13F | Guggenheim Capital Llc | 84,315 | 11.08 | 3,163 | 13.17 | ||||
| 2025-07-31 | 13F | Moloney Securities Asset Management, LLC | 0 | -100.00 | 0 | |||||
| 2025-08-22 | 13F | Carter Financial Group, INC. | 12,060 | 452 | ||||||
| 2025-08-11 | 13F | Citigroup Inc | 2,124,089 | 18.75 | 79,675 | 21.01 | ||||
| 2025-05-02 | 13F | Cullen/frost Bankers, Inc. | 0 | -100.00 | 0 | |||||
| 2025-08-11 | 13F | Shenkman Capital Management Inc | 344,380 | -30.55 | 12,876 | -28.57 | ||||
| 2025-08-14 | 13F | Logan Stone Capital, LLC | 305,733 | -68.93 | 11,468 | -68.34 | ||||
| 2025-07-17 | 13F | Paradigm Financial Partners, Llc | 9,369 | 22.07 | 351 | 24.47 | ||||
| 2025-07-22 | 13F | USAdvisors Wealth Management, LLC | 9,706 | -0.23 | 0 | |||||
| 2025-07-14 | 13F | Park Avenue Securities Llc | 88,600 | 3 | ||||||
| 2025-08-14 | 13F | Quartz Partners, LLC | 6,674 | -0.51 | 250 | 1.63 | ||||
| 2025-07-25 | 13F | Sequoia Financial Advisors, LLC | 9,268 | -57.74 | 348 | -57.00 | ||||
| 2025-06-04 | NP | NTBAX - Navigator Tactical Fixed Income Fund Class A Shares | 0 | -100.00 | 0 | -100.00 | ||||
| 2025-08-13 | 13F | Natixis Advisors, L.p. | 90,863 | 4.52 | 3 | 0.00 | ||||
| 2025-08-14 | 13F | Moneta Group Investment Advisors Llc | 77,225 | 3.71 | 2,897 | 5.69 | ||||
| 2025-08-05 | 13F | Key FInancial Inc | 610 | -34.41 | 23 | -35.29 | ||||
| 2025-04-01 | 13F | Massmutual Trust Co Fsb/adv | 0 | -100.00 | 0 | |||||
| 2025-08-26 | NP | Blackrock Debt Strategies Fund, Inc. This fund is a listed as child fund of BlackRock, Inc. and if that institution has disclosed ownership in this security, then these positions will not be double counted when calculating total shares and total value | 125,000 | 31.58 | 4,689 | 34.10 | ||||
| 2025-04-18 | 13F | Halbert Hargrove Global Advisors, Llc | 0 | -100.00 | 0 | -100.00 | ||||
| 2025-07-23 | 13F | Citizens National Bank Trust Department | 143 | 0.00 | 5 | 0.00 | ||||
| 2025-07-25 | 13F | Cwm, Llc | 1,519,300 | 32.72 | 57 | 33.33 | ||||
| 2025-07-25 | 13F | Richardson Financial Services Inc. | 8,385 | 35.59 | 313 | 37.44 | ||||
| 2025-08-13 | 13F | GeoWealth Management, LLC | 1,504 | 56 | ||||||
| 2025-05-01 | 13F | High Note Wealth, LLC | 0 | -100.00 | 0 | |||||
| 2025-08-05 | 13F | Sumitomo Life Insurance Co | 219,900 | -64.28 | 8,248 | -63.60 | ||||
| 2025-08-08 | 13F | Capital Investment Advisory Services, LLC | 2,009 | -23.84 | 75 | -22.68 | ||||
| 2025-08-14 | 13F | Old Mission Capital Llc | 0 | -100.00 | 0 | |||||
| 2025-04-30 | 13F | Sofos Investments, Inc. | 0 | -100.00 | 0 | -100.00 | ||||
| 2025-08-14 | 13F | Acorn Wealth Advisors, LLC | 0 | -100.00 | 0 | |||||
| 2025-07-31 | 13F | Richards, Merrill & Peterson, Inc. | 0 | -100.00 | 0 | |||||
| 2025-08-06 | 13F | New Millennium Group LLC | 437 | 0.00 | 16 | 0.00 | ||||
| 2025-08-25 | NP | NDAA - Ned Davis Research 360 Dynamic Allocation ETF | 3,714 | 163.59 | 139 | 172.55 | ||||
| 2025-05-14 | 13F | Jane Street Group, Llc | 0 | -100.00 | 0 | |||||
| 2025-07-09 | 13F | Reyes Financial Architecture, Inc. | 176 | 0.00 | 7 | 0.00 | ||||
| 2025-08-14 | 13F | Little Harbor Advisors, LLC | 159,100 | 6 | ||||||
| 2025-07-14 | 13F | Occidental Asset Management, LLC | 22,939 | 100.17 | 860 | 104.28 | ||||
| 2025-07-29 | 13F | Two West Capital Advisors LLC | 5,901 | -2.06 | 221 | 2.33 | ||||
| 2025-08-08 | 13F | Creative Planning | 138,724 | -38.27 | 5,204 | -37.09 | ||||
| 2025-08-13 | 13F | Townsquare Capital Llc | 43,064 | -88.23 | 1,615 | -88.01 | ||||
| 2025-08-08 | 13F | Wrapmanager Inc | 7,951 | -12.19 | 298 | -10.51 | ||||
| 2025-08-11 | 13F | Y.D. More Investments Ltd | 104,903 | -72.98 | 3,935 | -72.47 | ||||
| 2025-07-15 | 13F | Norden Group Llc | 10,026 | 3.19 | 376 | 5.32 | ||||
| 2025-08-05 | 13F | Counterweight Ventures, LLC | 72,952 | 3.35 | 2,736 | 5.31 | ||||
| 2025-08-11 | 13F | Trajan Wealth LLC | 309,413 | 8.59 | 11,606 | 10.66 | ||||
| 2025-08-14 | 13F | Colony Group, LLC | 144,821 | 40.54 | 5,432 | 43.21 | ||||
| 2025-04-28 | NP | NCOAX - Nuveen Symphony High Yield Income Fund Class A This fund is a listed as child fund of Nuveen Asset Management, LLC and if that institution has disclosed ownership in this security, then these positions will not be double counted when calculating total shares and total value | 670,996 | 10.17 | 25,129 | 10.67 | ||||
| 2025-08-06 | 13F | Golden State Wealth Management, LLC | 347 | -62.28 | 13 | -60.61 | ||||
| 2025-07-22 | 13F | Simplicity Wealth,LLC | 232,550 | 149.71 | 8,723 | 154.43 | ||||
| 2025-08-11 | 13F | State of Wisconsin - Board of Commissioners of Public Lands | 48,550 | 0.00 | 1,821 | 1.90 | ||||
| 2025-08-06 | 13F | First Horizon Advisors, Inc. | 20,132 | 135.16 | 755 | 139.68 | ||||
| 2025-07-29 | 13F | Chicago Partners Investment Group LLC | 7,882 | -40.16 | 295 | -38.67 | ||||
| 2025-08-15 | 13F | Asset Allocation Strategies LLC | 0 | -100.00 | 0 | |||||
| 2025-08-28 | NP | GPTCX - GuidePath(R) Conservative Allocation Fund Service Shares | 291,421 | -1.90 | 10,931 | -0.04 | ||||
| 2025-04-22 | 13F | Castleview Partners, Llc | 0 | -100.00 | 0 | -100.00 | ||||
| 2025-08-12 | 13F | Gladstone Institutional Advisory LLC | 24,003 | 2.54 | 900 | 4.53 | ||||
| 2025-08-12 | 13F | Deutsche Bank Ag\ | 256,786 | -46.15 | 9,632 | -45.13 | ||||
| 2025-04-10 | 13F | Contravisory Investment Management, Inc. | 0 | -100.00 | 0 | |||||
| 2025-08-28 | NP | BTFAX - BTS Tactical Fixed Income Fund Class A Shares | 558,697 | 265.63 | 20,957 | 272.62 | ||||
| 2025-08-01 | 13F | Advisory Alpha, LLC | 30,986 | -9.12 | 1,162 | -7.41 | ||||
| 2025-06-26 | NP | SPHIX - Fidelity High Income Fund | 1,002,300 | 36,684 | ||||||
| 2025-07-18 | 13F | Ninety One UK Ltd | 150,811 | 0.00 | 5,657 | 1.89 | ||||
| 2025-08-13 | 13F | Farnam Financial LLC | 8,043 | -6.66 | 302 | -5.05 | ||||
| 2025-08-05 | 13F | Scarborough Advisors, LLC | 42 | 0 | ||||||
| 2025-04-28 | 13F | Mainstream Capital Management LLC | 0 | -100.00 | 0 | |||||
| 2025-08-06 | 13F | Legacy Wealth Managment, LLC/ID | 20 | 0.00 | 1 | |||||
| 2025-08-12 | 13F | Howe & Rusling Inc | 213,415 | 2.34 | 8,005 | 4.30 | ||||
| 2025-08-14 | 13F | Bbr Partners, Llc | 5,500 | 206 | ||||||
| 2025-08-07 | 13F | Verus Capital Partners, Llc | 61,122 | 10.46 | 2,293 | 12.57 | ||||
| 2025-08-28 | NP | BTSAX - BTS Managed Income Fund Class A Shares | 23,249 | 287.10 | 872 | 294.57 | ||||
| 2025-05-14 | 13F | Oarsman Capital, Inc. | 0 | -100.00 | 0 | |||||
| 2025-08-11 | 13F | Brown Brothers Harriman & Co | 500 | 19 | ||||||
| 2025-07-14 | 13F | Mechanics Bank Trust Department | 105,686 | -47.89 | 3,964 | -46.90 | ||||
| 2025-07-29 | 13F | Disciplined Investments, LLC | 5,445 | -32.27 | 204 | -30.85 | ||||
| 2025-08-12 | 13F | MAI Capital Management | 11,151 | -9.34 | 418 | -7.52 | ||||
| 2025-05-13 | 13F | Adams Wealth Management | 13,325 | -11.53 | 490 | -11.55 | ||||
| 2025-08-14 | 13F | Atomi Financial Group, Inc. | 15,537 | 18.70 | 583 | 21.00 | ||||
| 2025-08-15 | 13F | Captrust Financial Advisors | 12,133 | 22.87 | 455 | 25.34 | ||||
| 2025-07-30 | 13F | Caliber Wealth Management, LLC / KS | 28,491 | 18.61 | 1,069 | 20.81 | ||||
| 2025-07-31 | 13F | Ssa Swiss Advisors Ag | 0 | -100.00 | 0 | |||||
| 2025-07-24 | 13F | Jfs Wealth Advisors, Llc | 68 | -90.75 | 3 | -92.59 | ||||
| 2025-07-21 | 13F | Ameriflex Group, Inc. | 236 | 0.00 | 9 | 0.00 | ||||
| 2025-08-28 | NP | HYTR - CP High Yield Trend ETF | 1,630,226 | 27.39 | 61,150 | 29.82 | ||||
| 2025-08-14 | 13F | Wiley Bros.-aintree Capital, Llc | 618,865 | -4.89 | 23,225 | -2.71 | ||||
| 2025-08-14 | 13F | Stifel Financial Corp | 789,691 | 1.54 | 29,621 | 3.47 | ||||
| 2025-08-12 | 13F | PSI Advisors, LLC | 0 | -100.00 | 0 | |||||
| 2025-07-30 | NP | ENDW - Cambria Endowment Style ETF | 3,055 | 113 | ||||||
| 2025-08-07 | 13F | Winch Advisory Services, LLC | 23,317 | -3.15 | 875 | -1.35 | ||||
| 2025-08-18 | 13F/A | Kestra Investment Management, LLC | 35,050 | 46.06 | 1,315 | 48.81 | ||||
| 2025-07-25 | 13F | Verdence Capital Advisors LLC | 46,253 | 5.18 | 1,735 | 7.17 | ||||
| 2025-08-12 | 13F | J.w. Cole Advisors, Inc. | 22,054 | 827 | ||||||
| 2025-07-11 | 13F | Farther Finance Advisors, LLC | 9,983 | 7.14 | 374 | 9.68 | ||||
| 2025-08-14 | 13F | Two Sigma Securities, Llc | 0 | -100.00 | 0 | |||||
| 2025-07-14 | 13F | Golden State Equity Partners | 42,731 | -12.83 | 1,603 | -11.20 | ||||
| 2025-07-10 | 13F | High Net Worth Advisory Group LLC | 44,370 | -2.63 | 1,664 | -0.78 | ||||
| 2025-07-10 | 13F | Oliver Lagore Vanvalin Investment Group | 21 | 1 | ||||||
| 2025-07-07 | 13F | First Community Trust Na | 108 | 4 | ||||||
| 2025-07-25 | 13F | Iron Financial, LLC | 7,453 | 0.00 | 280 | 1.82 | ||||
| 2025-05-15 | 13F | Sheridan Capital Management, LLC | 0 | -100.00 | 0 | |||||
| 2025-05-13 | 13F | Blue Edge Capital, LLC | 0 | -100.00 | 0 | |||||
| 2025-07-17 | 13F | Beacon Capital Management, LLC | 4,914 | -7.60 | 184 | -5.64 | ||||
| 2025-08-12 | 13F | Prudential Plc | 75,293,185 | -5.55 | 2,824,247 | -3.75 | ||||
| 2025-08-25 | NP | MML Series Investment Fund II - MML iShares 60/40 Allocation Fund Service Class I | 16,336 | 9.76 | 613 | 11.88 | ||||
| 2025-07-11 | 13F | My Legacy Advisors, LLC | 8,314 | 0.00 | 310 | 0.98 | ||||
| 2025-04-23 | 13F | Mascagni Wealth Management, Inc. | 0 | -100.00 | 0 | -100.00 | ||||
| 2025-07-17 | 13F | San Luis Wealth Advisors LLC | 0 | -100.00 | 0 | |||||
| 2025-08-13 | 13F | Baltimore-Washington Financial Advisors, Inc. | 0 | -100.00 | 0 | |||||
| 2025-07-30 | 13F | TFB Advisors LLC | 36,271 | 8.87 | 1,361 | 10.93 | ||||
| 2025-07-30 | 13F | Securian Asset Management, Inc | 126,886 | 0.00 | 4,759 | 1.91 | ||||
| 2025-07-30 | 13F | Atlantic Edge Private Wealth Management, LLC | 0 | -100.00 | 0 | |||||
| 2025-07-17 | 13F | Nelson, Van Denburg & Campbell Wealth Management Group, LLC | 19,179 | -10.77 | 719 | -9.10 | ||||
| 2025-07-25 | 13F | LRI Investments, LLC | 39 | 0.00 | 1 | 0.00 | ||||
| 2025-08-28 | NP | GPIFX - GuidePath(R) Flexible Income Allocation Fund Service Shares | 1,107,579 | 99.40 | 41,545 | 103.20 | ||||
| 2025-08-27 | NP | TOUCHSTONE VARIABLE SERIES TRUST - Touchstone Balanced Fund | 22,499 | 844 | ||||||
| 2025-07-23 | 13F/A | Euro Pacific Asset Management, LLC | 14,875 | 0.00 | 1 | |||||
| 2025-07-28 | 13F | Morris Financial Concepts, Inc. | 0 | -100.00 | 0 | |||||
| 2025-08-01 | 13F | May Hill Capital, LLC | 0 | -100.00 | 0 | |||||
| 2025-07-11 | 13F | Windsor Capital Management, LLC | 33,407 | 19.75 | 1,253 | 22.12 | ||||
| 2025-08-06 | 13F | Founders Financial Securities Llc | 171,308 | 63.94 | 6,426 | 67.49 | ||||
| 2025-08-06 | 13F | Sage Advisory Services, Ltd.Co. | 238,455 | 11.21 | 8,944 | 13.32 | ||||
| 2025-05-01 | 13F | Diversify Wealth Management, Llc | 0 | -100.00 | 0 | |||||
| 2025-07-10 | 13F | Brooklyn FI, LLC | 6,779 | 0.00 | 254 | 2.01 | ||||
| 2025-08-11 | 13F | Heritage Wealth Advisors | 0 | 0 | ||||||
| 2025-05-15 | 13F | State Of Wisconsin Investment Board | 0 | -100.00 | 0 | |||||
| 2025-07-17 | 13F | Wolff Wiese Magana Llc | 272 | 0.00 | 10 | 0.00 | ||||
| 2025-08-14 | 13F | Hurley Capital, LLC | 0 | -100.00 | 0 | |||||
| 2025-08-13 | 13F | Manning & Napier Advisors Llc | 1,003,025 | 858.44 | 37,623 | 876.71 | ||||
| 2025-07-16 | 13F | RWM Asset Management, LLC | 262,194 | 5.09 | 9,835 | 7.08 | ||||
| 2025-07-30 | 13F | Syntegra Private Wealth Group, LLC | 10,583 | -0.02 | 397 | 1.80 | ||||
| 2025-08-05 | 13F | Bank Of Montreal /can/ | 20,126 | 27.85 | 755 | 30.22 | ||||
| 2025-08-12 | 13F | Pathstone Holdings, LLC | 256,358 | -25.27 | 9,616 | -24.27 | ||||
| 2025-08-11 | 13F | Alps Advisors Inc | 373,988 | 41.35 | 14,028 | 44.04 | ||||
| 2025-05-13 | 13F | Landing Point Financial Group, LLC | 0 | -100.00 | 0 | |||||
| 2025-07-10 | 13F | Wedmont Private Capital | 406,461 | -0.80 | 15,161 | 3.68 | ||||
| 2025-08-07 | 13F | Flagship Wealth Advisors, Llc | 666 | 25 | ||||||
| 2025-05-02 | 13F | Signaturefd, Llc | 0 | -100.00 | 0 | |||||
| 2025-07-28 | 13F | Harbour Investments, Inc. | 9,462 | 5.41 | 355 | 7.27 | ||||
| 2025-07-21 | 13F | Ameritas Advisory Services, LLC | 4,898 | -60.72 | 184 | -60.04 | ||||
| 2025-06-26 | NP | TMAAX - Thrivent Moderately Aggressive Allocation Fund Class A | 36,265 | 0.00 | 1,327 | -1.85 | ||||
| 2025-07-21 | 13F | Single Point Partners, LLC | 160,113 | 0.40 | 6 | 20.00 | ||||
| 2025-08-13 | 13F | Truvestments Capital Llc | 1,017 | 38 | ||||||
| 2025-08-13 | 13F | Twin Peaks Wealth Advisors, LLC | 752 | 28 | ||||||
| 2025-08-14 | 13F | Peapack Gladstone Financial Corp | 41,083 | -58.64 | 2 | -66.67 | ||||
| 2025-08-22 | NP | Variable Insurance Products Fund V - Strategic Income Portfolio Initial Class | 527,400 | 19,783 | ||||||
| 2025-07-23 | 13F | Litman Gregory Asset Management LLC | 32,190 | 0.04 | 1,207 | 1.94 | ||||
| 2025-08-13 | 13F | Fisher Asset Management, LLC | 208,991 | -9.86 | 7,839 | -8.14 | ||||
| 2025-08-14 | 13F | Headlands Technologies LLC | 27,069 | 1,015 | ||||||
| 2025-08-11 | 13F | Independent Advisor Alliance | 9,688 | -23.26 | 363 | -21.77 | ||||
| 2025-07-23 | 13F | Friedenthal Financial | 3,080 | 116 | ||||||
| 2025-08-05 | 13F | Allstate Corp | 1,274,000 | -35.92 | 47,788 | -34.70 | ||||
| 2025-08-06 | 13F | AE Wealth Management LLC | 6,067 | -10.12 | 228 | -8.47 | ||||
| 2025-08-08 | 13F | Hartland & Co., LLC | 610,653 | 6,188.26 | 22,906 | 6,315.97 | ||||
| 2025-06-26 | NP | BlackRock Funds V - BlackRock Floating Rate Income Portfolio Investor A Shares | 311,241 | 58.60 | 11,391 | 55.68 | ||||
| 2025-07-11 | 13F | Pinnacle Bancorp, Inc. | 1,044 | 0.00 | 39 | 2.63 | ||||
| 2025-07-31 | 13F | City State Bank | 56 | 0.00 | 2 | 0.00 | ||||
| 2025-08-11 | 13F | Aptus Capital Advisors, LLC | 4,616 | -6.16 | 173 | -4.42 | ||||
| 2025-06-24 | NP | MDAKX - MainStay Moderate ETF Allocation Fund Class C | 107,100 | 1.46 | 3,920 | -0.43 | ||||
| 2025-08-11 | 13F | GW&K Investment Management, LLC | 10,350 | 5.69 | 0 | |||||
| 2025-07-28 | 13F | Chesapeake Wealth Management | 128,330 | 1.15 | 4,814 | 3.08 | ||||
| 2025-08-14 | 13F | 1607 Capital Partners, LLC | 2,021,200 | -3.32 | 75,815 | -1.48 | ||||
| 2025-08-11 | 13F | Covestor Ltd | 10,581 | 27.74 | 0 | |||||
| 2025-08-13 | 13F | Continuum Advisory, LLC | 0 | -100.00 | 0 | |||||
| 2025-08-14 | 13F | Sentinus, LLC | 10,484 | 16.77 | 393 | 19.09 | ||||
| 2025-08-14 | 13F | Hilltop Holdings Inc. | 17,730 | -26.76 | 665 | -25.36 | ||||
| 2025-07-22 | 13F | Valeo Financial Advisors, LLC | 34,791 | -4.93 | 1,305 | -3.12 | ||||
| 2025-08-13 | 13F | M&t Bank Corp | 25,472 | -36.35 | 956 | -35.17 | ||||
| 2025-06-24 | NP | MOEAX - MainStay Growth ETF Allocation Fund Class A | 90,140 | -0.12 | 3,299 | -1.96 | ||||
| 2025-07-29 | 13F | Angeles Wealth Management, Llc | 1,466 | 55 | ||||||
| 2025-08-08 | 13F | Good Life Advisors, LLC | 0 | -100.00 | 0 | |||||
| 2025-07-08 | 13F | Goldstone Financial Group, LLC | 58,838 | -22.59 | 2,198 | -21.42 | ||||
| 2025-08-15 | 13F | Kestra Advisory Services, LLC | 103,580 | 123.03 | 3,885 | 127.33 | ||||
| 2025-08-14 | 13F | Gerber Kawasaki Wealth & Investment Management | 120,433 | 11.89 | 4,517 | 14.01 | ||||
| 2025-04-28 | NP | FJSIX - Nuveen High Income Bond Fund Class A This fund is a listed as child fund of Nuveen Asset Management, LLC and if that institution has disclosed ownership in this security, then these positions will not be double counted when calculating total shares and total value | 66,827 | 2,503 | ||||||
| 2025-08-14 | 13F | Ameriprise Financial Inc | 614,001 | 335.13 | 23,011 | 343.01 | ||||
| 2025-04-22 | 13F | World Equity Group, Inc. | 0 | -100.00 | 0 | |||||
| 2025-08-06 | 13F | Legacy Investment Solutions, LLC | 20 | 0.00 | 1 | |||||
| 2025-08-27 | NP | Jnl Series Trust - Jnl/blackrock Global Allocation Fund (a) | 81,483 | 0.00 | 3,056 | 1.90 | ||||
| 2025-08-01 | 13F | Twin Lakes Capital Management, LLC | 139 | 0.00 | 5 | 0.00 | ||||
| 2025-08-13 | 13F | Baker Avenue Asset Management, LP | 564,075 | 2.36 | 21,158 | 4.31 | ||||
| 2025-08-08 | 13F | Larson Financial Group LLC | 592 | 5.34 | 22 | 10.00 | ||||
| 2025-08-19 | 13F | Anchor Investment Management, LLC | 306 | 11 | ||||||
| 2025-08-07 | 13F | Kestra Private Wealth Services, Llc | 29,225 | -7.22 | 1,096 | -5.44 | ||||
| 2025-08-15 | 13F | Provenance Wealth Advisors, LLC | 0 | -100.00 | 0 | |||||
| 2025-07-14 | 13F | AdvisorNet Financial, Inc | 2,868 | 20.10 | 108 | 22.99 | ||||
| 2025-05-15 | 13F | Rakuten Investment Management, Inc. | 303,286 | -4.49 | 11,152 | -6.80 | ||||
| 2025-08-12 | 13F | Kensington Asset Management, LLC | 3,795,450 | -18.40 | 142,367 | -16.85 | ||||
| 2025-08-14 | 13F | Partners Capital Investment Group, Llp | 498,961 | -59.40 | 18,716 | -58.63 | ||||
| 2025-08-18 | 13F/A | National Bank Of Canada /fi/ | 488,026 | 292.76 | 18,305 | 300.28 | ||||
| 2025-08-06 | 13F | Atlantic Union Bankshares Corp | 264 | 10 | ||||||
| 2025-08-05 | 13F | Arrowroot Family Office, LLC | 22,191 | 832 | ||||||
| 2025-07-14 | 13F | Counterpoint Mutual Funds LLC | 13,188,558 | 56.99 | 494,703 | 60.06 | ||||
| 2025-05-29 | NP | CRMVX - Conquer Risk Managed Volatility Fund | 467,101 | -46.42 | 17,194 | -46.40 | ||||
| 2025-08-19 | 13F | MRP Capital Investments, LLC | 6,735 | 0.00 | 253 | 2.02 | ||||
| 2025-06-26 | NP | TCAAX - Thrivent Moderately Conservative Allocation Fund Class A | 2,500 | 0.00 | 92 | -2.15 | ||||
| 2025-07-07 | 13F | Wilson & Boucher Capital Management, LLC | 7,100 | -12.35 | 266 | -10.74 | ||||
| 2025-07-22 | 13F | Belpointe Asset Management LLC | 57,534 | 2,158 | ||||||
| 2025-08-04 | 13F | Twin City Private Wealth, Llc | 8,477 | 28.11 | 318 | 30.45 | ||||
| 2025-08-14 | 13F | Tudor Investment Corp Et Al | 0 | -100.00 | 0 | |||||
| 2025-08-14 | 13F | Financial Network Wealth Advisors LLC | 5,007 | 2.29 | 188 | 3.89 | ||||
| 2025-08-14 | 13F | Aqr Capital Management Llc | 24,575 | -31.41 | 922 | -30.12 | ||||
| 2025-07-11 | 13F | Kingstone Capital Partners Texas, LLC | 2,264,431 | 81 | ||||||
| 2025-07-28 | 13F | Rosenberg Matthew Hamilton | 188 | 506.45 | 7 | 600.00 | ||||
| 2025-07-08 | 13F | Parallel Advisors, LLC | 56 | -12.50 | 2 | 0.00 | ||||
| 2025-07-23 | 13F | Mullooly Asset Management, Inc. | 19,058 | 1.72 | 715 | 3.63 | ||||
| 2025-08-05 | 13F | Mission Wealth Management, Lp | 35,879 | 4.75 | 1,346 | 6.75 | ||||
| 2025-07-07 | 13F | Capital Asset Advisory Services LLC | 879,733 | -0.76 | 32,796 | 0.70 | ||||
| 2025-08-19 | 13F | Newbridge Financial Services Group, Inc. | 1,500 | 0.00 | 56 | 1.82 | ||||
| 2025-07-28 | 13F | Kiker Wealth Management, LLC | 135 | 5 | ||||||
| 2025-08-14 | 13F | GWM Advisors LLC | 33,472 | -0.39 | 1,256 | 1.54 | ||||
| 2025-08-07 | 13F | Allworth Financial LP | 2,228 | -1.76 | 84 | 0.00 | ||||
| 2025-04-24 | 13F | Park Place Capital Corp | 0 | -100.00 | 0 | |||||
| 2025-07-31 | 13F | Cornerstone Management, Inc. | 147,998 | -0.63 | 5,551 | 1.26 | ||||
| 2025-04-29 | 13F | Hm Payson & Co | 0 | -100.00 | 0 | |||||
| 2025-08-13 | 13F | F/M Investments LLC | 8,078 | -66.39 | 303 | -65.72 | ||||
| 2025-07-11 | 13F | Harbour Capital Advisors, LLC | 6,700 | -8.77 | 250 | -6.02 | ||||
| 2025-07-09 | 13F | Beacon Financial Group | 10,591 | -1.53 | 397 | 0.51 | ||||
| 2025-08-12 | 13F | Foster Dykema Cabot & Partners, Llc | 1,422 | 0.00 | 53 | 1.92 | ||||
| 2025-07-14 | 13F | UMA Financial Services, Inc. | 476 | 18 | ||||||
| 2025-08-05 | 13F | Tme Financial, Inc. | 0 | -100.00 | 0 | |||||
| 2025-07-29 | 13F | Stratos Wealth Partners, LTD. | 78,215 | 26.65 | 2,934 | 29.04 | ||||
| 2025-08-04 | 13F | Lockheed Martin Investment Management Co | 0 | -100.00 | 0 | |||||
| 2025-08-07 | 13F | Factory Mutual Insurance Co | 1,355,000 | 0.00 | 50,826 | 1.90 | ||||
| 2025-08-18 | 13F | Front Row Advisors LLC | 670 | 0.00 | 25 | 4.17 | ||||
| 2025-07-17 | 13F | Venture Visionary Partners LLC | 11,124 | -0.23 | 417 | 1.71 | ||||
| 2025-08-28 | NP | CPATX - Counterpoint Tactical Income Fund Class A Shares | 11,558,332 | 191.57 | 433,553 | 197.12 | ||||
| 2025-05-20 | NP | GSHIX - Goldman Sachs High Yield Fund Institutional | 356,595 | 0.00 | 13,126 | 0.05 | ||||
| 2025-08-14 | 13F | Ubs Asset Management Americas Inc | 77,265 | 0.00 | 2,898 | 1.90 | ||||
| 2025-04-25 | 13F | Westfuller Advisors, LLC | 0 | -100.00 | 0 | -100.00 | ||||
| 2025-08-13 | 13F | Renaissance Technologies Llc | 421,457 | 15,809 | ||||||
| 2025-08-05 | 13F | Sigma Planning Corp | 165,055 | -1.31 | 6,191 | 0.57 | ||||
| 2025-07-16 | 13F | FORM Wealth Advisors, LLC | 272,994 | -30.52 | 10,240 | -29.19 | ||||
| 2025-07-29 | 13F | Activest Wealth Management | 265 | 1.53 | 10 | 0.00 | ||||
| 2025-08-13 | 13F | 1832 Asset Management L.P. | 3,591,445 | 55.77 | 134,715 | 58.73 | ||||
| 2025-05-06 | 13F | Lifeworks Advisors, LLC | 0 | -100.00 | 0 | |||||
| 2025-07-31 | 13F | Whipplewood Advisors, LLC | 0 | -100.00 | 0 | |||||
| 2025-07-28 | 13F | Private Wealth Asset Management, LLC | 7,907 | 0.00 | 297 | 1.72 | ||||
| 2025-07-28 | 13F | Davidson Trust Co | 8,445 | -0.92 | 317 | 0.96 | ||||
| 2025-08-06 | 13F | Rialto Wealth Management, LLC | 196 | 0.00 | 7 | 0.00 | ||||
| 2025-08-12 | 13F | BlackRock, Inc. | 45,973,300 | 18.60 | 1,724,458 | 20.85 | ||||
| 2025-08-08 | 13F | Kingsview Wealth Management, LLC | 30,629 | 26.11 | 1,149 | 28.56 | ||||
| 2025-08-12 | 13F | Argent Trust Co | 13,398 | 15.59 | 503 | 17.84 | ||||
| 2025-08-11 | 13F | CFS Investment Advisory Services, LLC | 0 | -100.00 | 0 | |||||
| 2025-08-14 | 13F | BTG Pactual Asset Management US LLC | 34,185 | -2.47 | 1,258 | -2.48 | ||||
| 2025-08-01 | 13F | Gwn Securities Inc. | 12,545 | -36.98 | 471 | -35.79 | ||||
| 2025-04-22 | 13F | Synergy Financial Management, LLC | 0 | -100.00 | 0 | |||||
| 2025-08-13 | 13F | Transce3nd, LLC | 482 | -47.84 | 18 | -47.06 | ||||
| 2025-08-18 | 13F | N.E.W. Advisory Services LLC | 19 | -50.00 | 1 | -100.00 | ||||
| 2025-07-31 | 13F | State of New Jersey Common Pension Fund D | 400,000 | 15,004 | ||||||
| 2025-08-04 | 13F | Quaker Wealth Management, LLC | Put | 0 | -100.00 | 0 | ||||
| 2025-08-14 | 13F | Mml Investors Services, Llc | 130,201 | 6.35 | 5 | 0.00 | ||||
| 2025-08-13 | 13F | Rinkey Investments | 9,000 | 0.00 | 338 | 1.81 | ||||
| 2025-08-14 | 13F | Prestige Wealth Management Group LLC | 725,945 | -4.13 | 27,230 | -2.30 | ||||
| 2025-07-14 | 13F | Bank & Trust Co | 464 | 0.00 | 17 | 0.00 | ||||
| 2025-08-26 | NP | EQ ADVISORS TRUST - 1290 VT High Yield Bond Portfolio Class IB | 256,750 | 0.00 | 9,631 | 1.90 | ||||
| 2025-07-24 | 13F | Monument Capital Management | 127,608 | -21.21 | 4,787 | -19.72 | ||||
| 2025-08-08 | 13F | SG Americas Securities, LLC | 6,760 | 0 | ||||||
| 2025-07-31 | 13F | Buckingham Strategic Partners | 401,208 | 15,049 | ||||||
| 2025-03-27 | NP | BlackRock ETF Trust II - BlackRock Flexible Income ETF This fund is a listed as child fund of BlackRock, Inc. and if that institution has disclosed ownership in this security, then these positions will not be double counted when calculating total shares and total value | 1,179,391 | 0.00 | 43,979 | 0.43 | ||||
| 2025-07-16 | 13F | Independent Wealth Network Inc. | 16,740 | -1.36 | 628 | 0.48 | ||||
| 2025-07-15 | 13F | Fifth Third Bancorp | 243 | -83.78 | 9 | -83.64 | ||||
| 2025-05-28 | NP | THRIVENT SERIES FUND INC - Thrivent Moderately Aggressive Allocation Portfolio Class A | 5,478 | -35.39 | 202 | -35.37 | ||||
| 2025-08-12 | 13F | Steward Partners Investment Advisory, Llc | 223,138 | 0.24 | 8,370 | 2.14 | ||||
| 2025-08-07 | 13F | Everhart Financial Group, Inc. | 6,420 | -2.93 | 241 | -1.23 | ||||
| 2025-07-22 | 13F | Innovative Wealth Building LLC | 70,500 | -13.94 | 2,644 | -12.31 | ||||
| 2025-07-30 | NP | FPCIX - Strategic Advisers Core Income Fund This fund is a listed as child fund of Fmr Llc and if that institution has disclosed ownership in this security, then these positions will not be double counted when calculating total shares and total value | 2,838,504 | 105,110 | ||||||
| 2025-07-24 | NP | DFRAX - DWS Floating Rate Fund Class A | 5,604 | 208 | ||||||
| 2025-04-02 | 13F | Marcum Wealth, LLC | 48,138 | 5.50 | 1,772 | 5.54 | ||||
| 2025-08-14 | 13F | Integrated Wealth Concepts LLC | 25,502 | -43.17 | 957 | -42.10 | ||||
| 2025-07-22 | 13F | Merit Financial Group, LLC | 50,621 | -30.10 | 1,899 | -28.78 | ||||
| 2025-07-14 | 13F | Sowell Financial Services LLC | 36,340 | -1.17 | 1,363 | 0.74 | ||||
| 2025-07-15 | 13F | Financial Management Professionals, Inc. | 119 | -80.07 | 4 | -80.95 | ||||
| 2025-08-14 | 13F | Glen Eagle Advisors, LLC | 576 | 0.00 | 22 | 0.00 | ||||
| 2025-08-19 | 13F | Advisory Services Network, LLC | 47,793 | 100.78 | 1,787 | 103.88 | ||||
| 2025-08-14 | 13F | Bnp Paribas Arbitrage, Sa | 1,101,515 | -68.18 | 41,318 | -67.58 | ||||
| 2025-07-16 | 13F | ORG Partners LLC | 1,404 | -45.52 | 52 | -44.68 | ||||
| 2025-08-14 | 13F | Sunbelt Securities, Inc. | 33,759 | 4.99 | 1,242 | 4.99 | ||||
| 2025-07-17 | 13F | David Kennon Inc | 110,283 | -22.70 | 4,137 | -21.23 | ||||
| 2025-05-15 | 13F | Proquility Private Wealth Partners, LLC | 14,800 | 545 | ||||||
| 2025-08-27 | NP | TOUCHSTONE VARIABLE SERIES TRUST - Touchstone Bond Fund - Class I | 5,948 | 223 | ||||||
| 2025-07-07 | 13F | Investors Research Corp | 1,918 | 0.00 | 72 | 1.43 | ||||
| 2025-07-14 | 13F | McGlone Suttner Wealth Management, Inc. | 0 | -100.00 | 0 | |||||
| 2025-07-17 | 13F | Elwood & Goetz Wealth Advisory Group, LLC | 9,836 | 369 | ||||||
| 2025-08-25 | NP | BETFX - Morningstar Balanced ETF Asset Allocation Portfolio Class I | 130,382 | 20.74 | 4,891 | 23.05 | ||||
| 2025-08-11 | 13F | Hexagon Capital Partners LLC | 26,364 | 2.01 | 989 | 3.89 | ||||
| 2025-08-25 | NP | IETFX - Morningstar Income and Growth ETF Asset Allocation Portfolio Class II | 54,214 | 15.29 | 2,034 | 17.51 | ||||
| 2025-08-04 | 13F | Kovack Advisors, Inc. | 5,980 | -7.19 | 224 | -5.49 | ||||
| 2025-08-13 | 13F | Summit Financial, LLC | 11,231 | 4.13 | 421 | 6.05 | ||||
| 2025-08-07 | 13F | FDx Advisors, Inc. | 39,889 | 1 | ||||||
| 2025-08-08 | 13F | Cetera Investment Advisers | 875,803 | 7.26 | 32,851 | 9.30 | ||||
| 2025-08-11 | 13F | Strategic Wealth Partners, Ltd. | 896 | 34 | ||||||
| 2025-08-12 | 13F | Integrated Advisors Network LLC | 65,751 | 0.25 | 2,466 | 2.15 | ||||
| 2025-07-25 | 13F | Atria Wealth Solutions, Inc. | 26,977 | 21.96 | 1,011 | 24.08 | ||||
| 2025-05-08 | 13F | XTX Topco Ltd | 0 | -100.00 | 0 | |||||
| 2025-05-15 | 13F | StoneX Group Inc. | 0 | -100.00 | 0 | -100.00 | ||||
| 2025-05-15 | 13F/A | Orion Portfolio Solutions, LLC | 78,802 | 21.04 | 2,901 | 21.09 | ||||
| 2025-08-11 | 13F | HighTower Advisors, LLC | 203,181 | 307.69 | 7,621 | 315.54 | ||||
| 2025-07-10 | 13F | Kmg Fiduciary Partners, Llc | 20,140 | 35.92 | 755 | 38.53 | ||||
| 2025-08-14 | 13F | DSC Meridian Capital LP | 1,013,199 | -15.00 | 38,005 | 88,283.72 | ||||
| 2025-08-12 | 13F | Boreal Capital Management LLC | 0 | 643 | ||||||
| 2025-05-06 | NP | KADIX - Kensington Active Advantage Fund Institutional Class Shares | 48,200 | -1.43 | 1,774 | -1.39 | ||||
| 2025-07-15 | 13F | Heritage Oak Wealth Advisors Llc | 92,624 | 360.22 | 3,474 | 369.46 | ||||
| 2025-08-06 | 13F | Wedbush Securities Inc | 0 | -100.00 | 0 | |||||
| 2025-07-31 | 13F | TSA Wealth Managment LLC | 5,549 | 208 | ||||||
| 2025-07-31 | 13F | Brighton Jones Llc | 31,929 | 8.18 | 1,198 | 10.22 | ||||
| 2025-07-24 | NP | HYGY - NEOS Enhanced Income Credit Select ETF | 1,208,022 | -30.69 | 44,733 | -31.47 | ||||
| 2025-08-01 | 13F | Boyd Watterson Asset Management Llc/oh | 11,785 | 163.59 | 442 | 169.51 | ||||
| 2025-07-30 | 13F | Gables Capital Management Inc. | 255 | 10 | ||||||
| 2025-07-29 | 13F | Koshinski Asset Management, Inc. | 9,493 | 4.34 | 356 | 6.59 | ||||
| 2025-08-08 | 13F | Petix & Botte Co | 20,004 | 2.22 | 750 | 4.17 | ||||
| 2025-07-17 | 13F | Symmetry Partners, LLC | 14,503 | -24.08 | 544 | -22.62 | ||||
| 2025-07-16 | 13F | ORG Wealth Partners, LLC | 2,064 | 0.00 | 77 | 1.33 | ||||
| 2025-07-29 | 13F | JTC Employer Solutions Trusteee Ltd | 310,219 | 0.00 | 12 | 0.00 | ||||
| 2025-08-13 | 13F | Edgestream Partners, L.P. | 148,112 | 644.58 | 5,556 | 658.88 | ||||
| 2025-08-14 | 13F | Fmr Llc | 6,984,595 | 7,386.73 | 261,992 | 7,529.35 | ||||
| 2025-08-01 | 13F | Bessemer Group Inc | 159 | 0 | ||||||
| 2025-06-20 | NP | ABXB - TrimTabs Donoghue Forlines Tactical High Yield ETF | 2,573 | -83.11 | 94 | -83.42 | ||||
| 2025-07-18 | 13F | Liberty Capital Management, Inc. | 12,201 | 122.32 | 458 | 126.24 | ||||
| 2025-06-26 | NP | BYLD - iShares Yield Optimized Bond ETF | 687,176 | -45.25 | 25,151 | -46.27 | ||||
| 2025-08-19 | 13F | Asset Dedication, LLC | 585 | 29,150.00 | 22 | |||||
| 2025-07-29 | 13F | Oxbow Advisors, LLC | 6,960 | 261 | ||||||
| 2025-08-11 | 13F | One Capital Management, LLC | 1,767,633 | 3.09 | 66,304 | 5.05 | ||||
| 2025-08-13 | 13F | Northern Trust Corp | 35,043,226 | -12.94 | 1,314,471 | -11.28 | ||||
| 2025-06-23 | NP | Global Opportunities Portfolio - Global Opportunities Portfolio | 4,454,600 | -4.82 | 163,038 | -6.58 | ||||
| 2025-07-30 | NP | FPIOX - Strategic Advisers Income Opportunities Fund This fund is a listed as child fund of Fmr Llc and if that institution has disclosed ownership in this security, then these positions will not be double counted when calculating total shares and total value | 50,600 | 1,874 | ||||||
| 2025-05-27 | NP | QHI2Q - High Income Portfolio Initial Class | 21,300 | 0.00 | 784 | 0.13 | ||||
| 2025-07-24 | 13F | Robertson Stephens Wealth Management, LLC | 78,475 | 2,944 | ||||||
| 2025-05-08 | 13F | Eastern Bank | 0 | -100.00 | 0 | |||||
| 2025-08-04 | 13F | Hantz Financial Services, Inc. | 131 | 0 | ||||||
| 2025-08-12 | 13F | Insigneo Advisory Services, Llc | 7,199 | -1.46 | 270 | 0.75 | ||||
| 2025-07-31 | 13F | Wealthfront Advisers Llc | 1,225,670 | -4.49 | 45,975 | -2.67 | ||||
| 2025-08-11 | 13F | Ppm America Inc/il | 0 | -100.00 | 0 | |||||
| 2025-07-24 | 13F | Blair William & Co/il | 2,353 | 1.12 | 88 | 3.53 | ||||
| 2025-04-25 | NP | QVOY - Q3 All-Season Active Rotation ETF | 17,215 | -16.84 | 645 | -17.01 | ||||
| 2025-07-09 | 13F | Heritage Family Offices, LLP | 251,467 | 0.02 | 9,246 | -0.09 | ||||
| 2025-08-01 | 13F | First Command Advisory Services, Inc. | 498,512 | 15.39 | 18,699 | 17.59 | ||||
| 2025-07-10 | 13F | NorthCrest Asset Manangement, LLC | 0 | -100.00 | 0 | |||||
| 2025-07-23 | 13F | WestEnd Advisors, LLC | 14 | 1 | ||||||
| 2025-07-08 | 13F | Arlington Trust Co LLC | 1,000 | 0.00 | 38 | 2.78 | ||||
| 2025-08-14 | 13F | Scott Marsh Financial, LLC | 45,836 | 1,719 | ||||||
| 2025-06-26 | NP | DINAX - Global Fixed Income Opportunities Fund A | 0 | -100.00 | 0 | -100.00 | ||||
| 2025-08-14 | 13F | Royal Bank Of Canada | 3,513,071 | 206.92 | 131,776 | 212.76 | ||||
| 2025-03-25 | NP | CPHYX - High Yield Fund Class A | 0 | -100.00 | 0 | -100.00 | ||||
| 2025-06-24 | NP | MNERX - MainStay Conservative ETF Allocation Fund Class R3 | 39,797 | -0.31 | 1,457 | -2.15 | ||||
| 2025-08-08 | 13F | L & S Advisors Inc | 10,893 | -31.62 | 409 | -30.38 | ||||
| 2025-08-14 | 13F | Engineers Gate Manager LP | 245,704 | 4,073.67 | 9,216 | 4,166.67 | ||||
| 2025-05-14 | 13F | Family Wealth Group, LLC | 0 | -100.00 | 0 | -100.00 | ||||
| 2025-07-18 | 13F/A | MJT & Associates Financial Advisory Group, Inc. | 4,403 | 0.00 | 165 | 1.85 | ||||
| 2025-07-22 | 13F | Olistico Wealth, LLC | 1,954 | -0.46 | 73 | 1.39 | ||||
| 2025-07-24 | 13F | Drucker Wealth 3.0, LLC | 9,012 | 336 | ||||||
| 2025-05-01 | 13F | Q3 Asset Management | 0 | -100.00 | 0 | |||||
| 2025-07-29 | 13F | Signature Estate & Investment Advisors Llc | 111,414 | 1.86 | 4,179 | 3.80 | ||||
| 2025-08-08 | 13F | Avantax Advisory Services, Inc. | 36,105 | 50.49 | 1,354 | 53.34 | ||||
| 2025-08-14 | 13F/A | Rockefeller Capital Management L.P. | 107,798 | 28.20 | 4,044 | 30.63 | ||||
| 2025-03-28 | NP | AOHY - Angel Oak High Yield Opportunities ETF | 54,380 | -49.82 | 2,028 | -49.63 | ||||
| 2025-08-07 | 13F/A | Tortoise Investment Management, LLC | 0 | -100.00 | 0 | |||||
| 2025-06-26 | NP | BlackRock Funds II - BlackRock Dynamic High Income Portfolio Investor A This fund is a listed as child fund of BlackRock, Inc. and if that institution has disclosed ownership in this security, then these positions will not be double counted when calculating total shares and total value | 2,297,150 | 84,076 | ||||||
| 2025-08-14 | 13F | Betterment LLC | 1,294,511 | 9.40 | 49 | 11.63 | ||||
| 2025-08-06 | 13F | Modera Wealth Management, LLC | 18,133 | 2.52 | 680 | 4.45 | ||||
| 2025-07-25 | 13F | Concurrent Investment Advisors, LLC | 80,052 | 50.47 | 3,003 | 53.32 | ||||
| 2025-06-23 | NP | Global Macro Portfolio - Global Macro Portfolio | Short | -802,332 | -29,365 | |||||
| 2025-08-26 | NP | Blackrock Corporate High Yield Fund, Inc. This fund is a listed as child fund of BlackRock, Inc. and if that institution has disclosed ownership in this security, then these positions will not be double counted when calculating total shares and total value | 488,154 | -45.34 | 18,311 | -44.31 | ||||
| 2025-07-15 | 13F | Mather Group, Llc. | 0 | -100.00 | 0 | |||||
| 2025-08-22 | NP | KHYAX - DWS High Income Fund Class A | 100,000 | -65.52 | 3,751 | -64.86 | ||||
| 2025-08-14 | 13F | Nepc Llc | 2,563,323 | 0.00 | 96,150 | 1.90 | ||||
| 2025-08-25 | NP | CETFX - Morningstar Conservative ETF Asset Allocation Portfolio Class I | 46,152 | 19.78 | 1,731 | 22.07 | ||||
| 2025-07-09 | 13F | WealthCare Investment Partners, LLC | 56,679 | 8.05 | 2,118 | 12.07 | ||||
| 2025-08-25 | NP | GETFX - Morningstar Growth ETF Asset Allocation Portfolio Class I | 143,240 | 101.63 | 5,373 | 105.51 | ||||
| 2025-08-27 | NP | TRANSAMERICA SERIES TRUST - Transamerica PIMCO Tactical - Balanced VP Service | 84,925 | -51.71 | 3,186 | -50.80 | ||||
| 2025-05-16 | 13F | Coppell Advisory Solutions LLC | 0 | -100.00 | 0 | |||||
| 2025-07-31 | 13F | Forte Asset Management Llc | 164,403 | -2.90 | 6,167 | -1.06 | ||||
| 2025-08-26 | NP | EQ ADVISORS TRUST - 1290 VT DoubleLine Dynamic Allocation Portfolio Class IB | 67,200 | -39.19 | 2,521 | -38.04 | ||||
| 2025-08-13 | 13F | Gibbs Wealth Management | 97,104 | 3,642 | ||||||
| 2025-07-15 | 13F | MCF Advisors LLC | 266 | 0.00 | 10 | 0.00 | ||||
| 2025-08-11 | 13F | Private Advisor Group, LLC | 25,994 | -16.85 | 975 | -15.22 | ||||
| 2025-07-28 | 13F | BRYN MAWR TRUST Co | 2,121 | -34.13 | 80 | -33.05 | ||||
| 2025-08-04 | 13F | Spire Wealth Management | 134 | -73.83 | 5 | -72.22 | ||||
| 2025-08-01 | 13F | Envestnet Asset Management Inc | 5,466,151 | 19.93 | 205,032 | 22.21 | ||||
| 2025-07-30 | 13F | Mid-American Wealth Advisory Group, Inc. | 197 | 7 | ||||||
| 2025-07-18 | 13F | Naples Global Advisors, Llc | 21,817 | -5.62 | 818 | -3.76 | ||||
| 2025-08-12 | 13F | Proequities, Inc. | 0 | 0 | ||||||
| 2025-08-01 | 13F | Rossby Financial, LCC | 398 | 27.56 | 15 | 27.27 | ||||
| 2025-08-14 | 13F | Citadel Advisors Llc | 0 | -100.00 | 0 | |||||
| 2025-07-14 | 13F | Opal Wealth Advisors, LLC | 0 | -100.00 | 0 | |||||
| 2025-04-08 | 13F | Retirement Wealth Solutions LLC | 0 | -100.00 | 0 | |||||
| 2025-07-24 | 13F | Ronald Blue Trust, Inc. | 1,359 | 11,225.00 | 51 | |||||
| 2025-08-12 | 13F | Franklin Resources Inc | 0 | -100.00 | 0 | |||||
| 2025-08-04 | 13F | Atria Investments Llc | 38,767 | 423.17 | 1,454 | 434.56 | ||||
| 2025-08-07 | 13F | Topel & Distasi Wealth Management, LLC | 108,031 | -38.24 | 4,052 | -37.06 | ||||
| 2025-03-27 | NP | LBHYX - Thrivent High Yield Fund Class A | 516,920 | 39.52 | 19,276 | 40.12 | ||||
| 2025-08-12 | 13F | State Farm Mutual Automobile Insurance Co | 10,315 | 423.34 | 387 | 436.11 | ||||
| 2025-07-25 | 13F | Joel Adams & Associates, Inc. | 43,907 | 5.44 | 1,647 | 7.44 | ||||
| 2025-08-14 | 13F | Bank Of America Corp /de/ | 29,365,210 | 5.74 | 1,101,489 | 7.75 | ||||
| 2025-08-14 | 13F | Modern Wealth Management, LLC | 190,962 | 7,163 | ||||||
| 2025-07-15 | 13F | RVW Wealth, LLC | 21,037 | 0.00 | 789 | 1.94 | ||||
| 2025-08-07 | 13F | Resources Investment Advisors, LLC. | 591,461 | -16.16 | 22,186 | -14.56 | ||||
| 2025-09-04 | 13F/A | Advisor Group Holdings, Inc. | 1,136,643 | 11.43 | 42,586 | 13.41 | ||||
| 2025-07-07 | 13F | Global Wealth Strategies & Associates | 0 | -100.00 | 0 | |||||
| 2025-08-12 | 13F | Financial Advocates Investment Management | 18,647 | -1.58 | 699 | 0.29 | ||||
| 2025-07-14 | 13F | Farmers & Merchants Investments Inc | 495 | 19 | ||||||
| 2025-08-14 | 13F | Millennium Management Llc | 28,039 | -2.29 | 1,052 | -0.47 | ||||
| 2025-08-15 | 13F | Chapman Financial Group, Llc | 12 | 0.00 | 0 | |||||
| 2025-08-14 | 13F | Goldman Sachs Group Inc | 16,420,973 | 4.77 | 615,951 | 6.76 | ||||
| 2025-08-13 | 13F | Level Four Advisory Services, Llc | 63,182 | 2.01 | 2,370 | 3.95 | ||||
| 2025-07-15 | 13F | Garrett Investment Advisors LLC | 30,361 | -8.61 | 1,139 | -6.87 | ||||
| 2025-07-28 | 13F | Duncker Streett & Co Inc | 213 | 0.00 | 8 | 0.00 | ||||
| 2025-08-15 | 13F | Tower Research Capital LLC (TRC) | 1,891 | -84.07 | 71 | -83.98 | ||||
| 2025-08-14 | 13F | Horizon Investments, LLC | 163,917 | 78.10 | 6,080 | 81.46 | ||||
| 2025-08-06 | 13F | Mark Sheptoff Financial Planning, Llc | 109 | 0.00 | 4 | 0.00 | ||||
| 2025-08-04 | 13F | Assetmark, Inc | 2,682,367 | 75.93 | 100,616 | 79.28 | ||||
| 2025-07-25 | 13F | Hazlett, Burt & Watson, Inc. | 184 | 1.66 | 0 | |||||
| 2025-07-31 | 13F | Oak Harbor Wealth Partners, Llc | 43,660 | -7.23 | 1,638 | -5.48 | ||||
| 2025-08-08 | 13F | TD Capital Management LLC | 164 | -81.41 | 6 | -81.25 | ||||
| 2025-08-25 | 13F/A | Neuberger Berman Group LLC | 559,086 | 2.48 | 20,971 | 4.43 | ||||
| 2025-07-22 | 13F | DAVENPORT & Co LLC | 59,964 | 6.21 | 2,249 | 8.23 | ||||
| 2025-08-07 | 13F | Commerce Bank | 5,623 | 0.00 | 211 | 1.94 | ||||
| 2025-07-29 | 13F | Salomon & Ludwin, LLC | 1 | 0.00 | 0 | |||||
| 2025-07-30 | 13F | Whittier Trust Co Of Nevada Inc | 714 | 0.00 | 27 | 0.00 | ||||
| 2025-07-18 | 13F | Consolidated Portfolio Review Corp | 60,280 | -0.89 | 2,261 | 1.03 | ||||
| 2025-07-30 | 13F | Brookstone Capital Management | 68,520 | -10.69 | 2,570 | -8.99 | ||||
| 2025-05-13 | 13F | Measured Risk Portfolios, Inc. | 0 | -100.00 | 0 | |||||
| 2025-08-05 | 13F | Dunhill Financial, LLC | 2,500 | 0.00 | 94 | 1.09 | ||||
| 2025-08-19 | 13F | Cape Investment Advisory, Inc. | 1,238 | 62.47 | 46 | 64.29 | ||||
| 2025-07-23 | 13F | Steel Peak Wealth Management LLC | 0 | -100.00 | 0 | |||||
| 2025-07-09 | 13F | Defined Wealth Management, Llc | 31,196 | 24.51 | 1,170 | 26.90 | ||||
| 2025-07-28 | 13F | Mutual Advisors, LLC | 47,963 | 98.97 | 1,795 | 102.82 | ||||
| 2025-08-13 | 13F | Mackenzie Financial Corp | 840,484 | 7.83 | 31,527 | 9.88 | ||||
| 2025-04-09 | 13F | HBW Advisory Services LLC | 0 | -100.00 | 0 | |||||
| 2025-07-17 | 13F | SWS Partners | 85,703 | 0.11 | 3,215 | 2.00 | ||||
| 2025-08-11 | 13F | TAGStone Capital, Inc. | 7,310 | 8.83 | 273 | |||||
| 2025-08-14 | 13F | Silver Point Capital L.P. | 2,950,000 | 110,654 | ||||||
| 2025-05-29 | NP | SSIZX - Sierra Tactical Core Income Fund Class A Shares | 2,764,600 | 0.00 | 101,765 | 0.05 | ||||
| 2025-07-29 | 13F | International Assets Investment Management, Llc | 8,845 | -4.18 | 332 | -2.36 | ||||
| 2025-08-28 | NP | BlackRock Variable Series Funds, Inc. - BlackRock Global Allocation V.I. Fund Class I This fund is a listed as child fund of BlackRock, Inc. and if that institution has disclosed ownership in this security, then these positions will not be double counted when calculating total shares and total value | 130,551 | 0.00 | 4,897 | 1.89 | ||||
| 2025-08-05 | 13F | Tiaa Trust, National Association | 8,868,136 | 112.20 | 331,994 | 115.82 | ||||
| 2025-07-21 | 13F | Ascent Group, LLC | 126,250 | 2.34 | 4,736 | 4.30 | ||||
| 2025-08-27 | NP | TRANSAMERICA SERIES TRUST - Transamerica PIMCO Tactical - Conservative VP Service | 41,860 | -53.02 | 1,570 | -52.13 | ||||
| 2025-08-14 | 13F | UBS Group AG | 2,010,966 | -33.01 | 75,431 | -31.74 | ||||
| 2025-08-08 | 13F | Atlanta Consulting Group Advisors, LLC | 10,233 | 3.59 | 384 | 5.51 | ||||
| 2025-06-23 | NP | PGDIX - Global Diversified Income Fund Institutional Class | 287,237 | -14.13 | 10,513 | -15.72 | ||||
| 2025-07-25 | 13F | Stephens Consulting, LLC | 0 | -100.00 | 0 | |||||
| 2025-07-30 | 13F | Roman Butler Fullerton & Co | 30,132 | 1,128 | ||||||
| 2025-07-28 | 13F | Toews Corp /adv | 6,149,000 | 230,649 | ||||||
| 2025-08-05 | 13F | Plante Moran Financial Advisors, LLC | 0 | -100.00 | 0 | |||||
| 2025-08-11 | 13F | Wealthgarden F.s. Llc | 9,114 | 0.00 | 341 | 1.49 | ||||
| 2025-08-14 | 13F | Susquehanna International Group, Llp | 21,582 | -88.55 | 810 | -88.34 | ||||
| 2025-08-13 | 13F | Cerity Partners LLC | 1,536,717 | -2.39 | 57,642 | -0.53 | ||||
| 2025-08-11 | 13F | TD Waterhouse Canada Inc. | 49 | -99.12 | 2 | -99.51 | ||||
| 2025-08-05 | 13F | Ellevest, Inc. | 114,193 | -6.72 | 4,283 | -4.95 | ||||
| 2025-08-01 | 13F | Ashton Thomas Private Wealth, LLC | 34,656 | 2.75 | 1,300 | 4.67 | ||||
| 2025-08-15 | 13F | Morgan Stanley | 12,555,513 | 1.29 | 470,957 | 3.22 | ||||
| 2025-08-11 | 13F | United Capital Financial Advisers, Llc | 238,192 | -19.79 | 8,935 | -18.27 | ||||
| 2025-05-02 | 13F | Transcendent Capital Group LLC | 0 | -100.00 | 0 | |||||
| 2025-08-12 | 13F | Kohmann Bosshard Financial Services, LLC | 11,181 | -1.23 | 419 | 0.72 | ||||
| 2025-06-27 | NP | THY - Agility Shares Dynamic Tactical Income ETF | 249,000 | 7.70 | 9,113 | 5.71 | ||||
| 2025-07-18 | 13F | Union Bancaire Privee, UBP SA | 47,000 | 0.00 | 1,758 | 1.68 | ||||
| 2025-07-24 | 13F | Standard Life Aberdeen plc | 86,440 | 59.93 | 3,242 | 63.00 | ||||
| 2025-08-08 | 13F | ERTS Wealth Advisors, LLC | 1,061,940 | -40.90 | 39,833 | -39.78 | ||||
| 2025-08-14 | 13F | Ilmarinen Mutual Pension Insurance Co | 17,080,000 | -0.58 | 641 | 1.27 | ||||
| 2025-07-31 | 13F | Asset Management One Co., Ltd. | 28,369 | 32,508.05 | 1,064 | 35,366.67 | ||||
| 2025-07-25 | 13F | Envestnet Portfolio Solutions, Inc. | 72,034 | 31.24 | 2,702 | 33.71 | ||||
| 2025-08-11 | 13F | HHM Wealth Advisors, LLC | 1,025 | 0.00 | 38 | 2.70 | ||||
| 2025-08-06 | NP | LINCOLN VARIABLE INSURANCE PRODUCTS TRUST - LVIP BlackRock Global Allocation Fund Standard Class | 56,993 | 0.00 | 2,138 | 1.91 | ||||
| 2025-08-25 | NP | MPHAX - MassMutual Premier High Yield Fund Class A | 365,000 | 13,691 | ||||||
| 2025-08-11 | 13F | Bell Investment Advisors, Inc | 1,934 | 1.74 | 73 | 4.35 | ||||
| 2025-06-26 | NP | AAINX - Thrivent Opportunity Income Plus Fund Class A | 341,692 | -9.29 | 12,506 | -10.97 | ||||
| 2025-08-12 | 13F | Archer Investment Corp | 137 | -25.14 | 5 | -16.67 | ||||
| 2025-07-11 | 13F/A | Umb Bank N A/mo | 163,255 | 1.71 | 6,124 | 3.64 | ||||
| 2025-08-28 | NP | Northern Lights Fund Trust - Ocean Park High Income ETF | 71,828 | -44.16 | 2,694 | -43.09 | ||||
| 2025-08-14 | 13F | Mercer Global Advisors Inc /adv | 981,399 | 1.88 | 36,812 | 3.82 | ||||
| 2025-06-24 | NP | TNIIX - 1290 Retirement 2020 Fund Class I | 1,310 | 0.00 | 48 | -2.08 | ||||
| 2025-07-23 | 13F | Kingswood Wealth Advisors, Llc | 8,866 | -5.20 | 333 | -3.21 | ||||
| 2025-07-09 | 13F | Riversedge Advisors, Llc | 74,352 | 47.20 | 2,789 | 49.97 | ||||
| 2025-07-31 | 13F | CNB Bank | 60 | 0.00 | 2 | 0.00 | ||||
| 2025-08-14 | 13F | Hrt Financial Lp | 338,106 | -31.36 | 13 | -33.33 | ||||
| 2025-08-14 | 13F | Boston Private Wealth Llc | 0 | -100.00 | 0 | |||||
| 2025-07-17 | 13F | Keystone Global Partners, LLC | 7,228 | -71.97 | 271 | -71.44 | ||||
| 2025-07-22 | 13F | Iron Horse Wealth Management, LLC | 0 | -100.00 | 0 | |||||
| 2025-08-14 | 13F | Wells Fargo & Company/mn | 39,789,440 | 4.07 | 1,492,502 | 6.05 | ||||
| 2025-07-07 | 13F | Thurston, Springer, Miller, Herd & Titak, Inc. | 335 | 48.89 | 13 | 50.00 | ||||
| 2025-07-10 | 13F | Exchange Traded Concepts, Llc | 99,072 | -38.81 | 3,716 | -37.64 | ||||
| 2025-05-12 | 13F | Aveo Capital Partners, LLC | 0 | -100.00 | 0 | |||||
| 2025-08-13 | 13F | Kilter Group LLC | 145 | 5 | ||||||
| 2025-07-03 | 13F | Garde Capital, Inc. | 8,613 | 0.00 | 323 | 1.89 | ||||
| 2025-07-17 | 13F | Fort Washington Investment Advisors Inc /oh/ | 572,228 | 21,464 | ||||||
| 2025-08-27 | 13F/A | Brinker Capital Investments, LLC | 102,143 | 29.62 | 3,831 | 32.10 | ||||
| 2025-08-27 | NP | EBABX - Eaton Vance Core Plus Bond Fund Class A | 740,000 | 311.11 | 27,757 | 324.22 | ||||
| 2025-08-06 | 13F | Ethos Financial Group, LLC | 98,772 | -62.60 | 3,705 | -61.87 | ||||
| 2025-08-22 | NP | RMIF - LHA Risk-Managed Income ETF | 159,100 | 5,968 | ||||||
| 2025-08-12 | 13F | Barings Llc | 445,500 | 16,711 | ||||||
| 2025-08-14 | 13F | Mariner, LLC | 44,030 | 13.01 | 1,652 | 15.13 | ||||
| 2025-08-11 | 13F | Nations Financial Group Inc, /ia/ /adv | 7,807 | 293 | ||||||
| 2025-08-12 | 13F | Richard W. Paul & Associates, LLC | 31 | 0.00 | 1 | 0.00 | ||||
| 2025-07-21 | 13F | Old Second National Bank Of Aurora | 0 | -100.00 | 0 | |||||
| 2025-06-24 | NP | TNKIX - 1290 Retirement 2030 Fund Class I | 704 | 0.00 | 26 | -3.85 | ||||
| 2025-08-14 | 13F | Aldebaran Financial Inc. | 8,500 | 0.00 | 319 | 1.92 | ||||
| 2025-06-24 | NP | TNJIX - 1290 Retirement 2025 Fund Class I | 146 | -10.43 | 5 | -16.67 | ||||
| 2025-08-04 | 13F | Daymark Wealth Partners, Llc | 5,935 | 223 | ||||||
| 2025-08-15 | 13F/A | Florida Financial Advisors, Llc | 5,470 | 205 | ||||||
| 2025-08-14 | 13F | Alaska Permanent Fund Corp | 2,286,619 | 74.34 | 85,497 | 78.10 | ||||
| 2025-08-11 | 13F | Angeles Investment Advisors, LLC | 1,048,000 | -34.66 | 39,310 | -33.42 | ||||
| 2025-08-12 | 13F | Bokf, Na | 1,845 | -79.20 | 69 | -78.83 | ||||
| 2025-08-22 | NP | FSTAX - Fidelity Advisor Strategic Income Fund Class A This fund is a listed as child fund of Fmr Llc and if that institution has disclosed ownership in this security, then these positions will not be double counted when calculating total shares and total value | 5,013,200 | 188,045 | ||||||
| 2025-07-08 | 13F | Braun-Bostich & Associates Inc. | 34,639 | -21.60 | 1,299 | -20.11 | ||||
| 2025-08-04 | 13F | Arkadios Wealth Advisors | 26,624 | 128.26 | 999 | 132.63 | ||||
| 2025-05-09 | 13F | Cary Street Partner Investment Advisory Llc | 0 | -100.00 | 0 | |||||
| 2025-07-23 | 13F | Prime Capital Investment Advisors, LLC | 990,338 | -5.10 | 37,148 | -3.30 | ||||
| 2025-07-18 | 13F | Wetzel Investment Advisors, Inc. | 39,340 | -61.91 | 1,476 | -61.20 | ||||
| 2025-06-26 | NP | BLACKROCK GLOBAL ALLOCATION FUND, INC. - BLACKROCK GLOBAL ALLOCATION FUND, INC. Investor A This fund is a listed as child fund of BlackRock, Inc. and if that institution has disclosed ownership in this security, then these positions will not be double counted when calculating total shares and total value | 505,031 | 0.00 | 18,484 | -1.85 | ||||
| 2025-08-12 | 13F | Global Retirement Partners, LLC | 60,667 | -0.67 | 2,276 | 1.25 | ||||
| 2025-05-08 | 13F | Strategic Advocates LLC | 0 | -100.00 | 0 | |||||
| 2025-07-24 | 13F | Trust Co Of Toledo Na /oh/ | 1,080 | 41 | ||||||
| 2025-05-15 | 13F | Marshall Wace, Llp | 0 | -100.00 | 0 | |||||
| 2025-05-05 | 13F | Morningstar Investment Services LLC | 115,938 | -47.02 | 4 | -50.00 | ||||
| 2025-08-25 | 13F | Silverlake Wealth Management Llc | 10,479 | 393 | ||||||
| 2025-08-12 | 13F | O'shaughnessy Asset Management, Llc | 12,740 | 81.90 | 478 | 85.60 | ||||
| 2025-07-31 | 13F/A | Avion Wealth | 58 | 0.00 | 0 | |||||
| 2025-08-06 | 13F | Decker Retirement Planning Inc. | 26,992 | 11,484.55 | 1,012 | 12,550.00 | ||||
| 2025-08-13 | 13F | Victory Financial Group, Llc | 6,145 | -15.78 | 231 | -14.18 | ||||
| 2025-07-15 | 13F | Maseco Llp | 125,135 | 4,694 | ||||||
| 2025-08-13 | 13F | Congress Wealth Management LLC / DE / | 17,105 | 68.84 | 642 | 71.85 | ||||
| 2025-07-18 | 13F | Dogwood Wealth Management LLC | 22 | 1 | ||||||
| 2025-07-28 | 13F | Sagespring Wealth Partners, Llc | 163,280 | -9.07 | 6,125 | -7.34 | ||||
| 2025-07-29 | 13F | Swmg, Llc | 0 | -100.00 | 0 | |||||
| 2025-08-01 | 13F | Koss-Olinger Consulting, LLC | 1,212,510 | -7.70 | 45,481 | -5.94 | ||||
| 2025-08-14 | 13F | Ausdal Financial Partners, Inc. | 15,773 | -2.31 | 592 | -0.51 | ||||
| 2025-08-04 | 13F | Simon Quick Advisors, Llc | 28,060 | 1,053 | ||||||
| 2025-07-25 | 13F | NorthRock Partners, LLC | 214 | -82.08 | 8 | -81.40 | ||||
| 2025-08-08 | 13F | Security Financial Services, INC. | 12,926 | -62.71 | 485 | -62.07 | ||||
| 2025-08-12 | 13F | Fairscale Capital, LLC | 683 | 68.23 | 26 | 78.57 | ||||
| 2025-08-14 | 13F | Sei Investments Co | 19,392 | 727 | ||||||
| 2025-06-27 | NP | THHYX - Toews Tactical Income Fund | 5,900,000 | -1.67 | 215,940 | -3.49 | ||||
| 2025-07-31 | 13F | Cambridge Investment Research Advisors, Inc. | 774,867 | 439.68 | 29 | 480.00 | ||||
| 2025-09-03 | 13F | American Trust | 131,310 | 4,925 | ||||||
| 2025-07-14 | 13F | Narus Financial Partners, LLC | 10,630 | -1.07 | 399 | 0.76 | ||||
| 2025-08-06 | 13F | SOUTH STATE Corp | 203 | -55.58 | 8 | -56.25 | ||||
| 2025-08-05 | 13F | Huntington National Bank | 35 | 580.00 | ||||||
| 2025-07-28 | 13F | RFG Advisory, LLC | 15,790 | 39.34 | 592 | 41.97 | ||||
| 2025-08-12 | 13F | Park Square Financial Group, LLC | 102 | 8.51 | 4 | 0.00 | ||||
| 2025-08-13 | 13F | BCJ Capital Management, LLC | 331,281 | 274.64 | 12,426 | 281.75 | ||||
| 2025-07-18 | 13F | Northeast Financial Group, Inc. | 324,016 | 47.40 | 12,154 | 50.20 | ||||
| 2025-08-14 | 13F | Santa Clara Valley Transportation Authority | 614,225 | 0.00 | 23,040 | 1.90 | ||||
| 2025-07-24 | 13F | Us Bancorp \de\ | 990,169 | 2.83 | 37,141 | 4.79 | ||||
| 2025-08-08 | 13F | Massachusetts Financial Services Co /ma/ | 24,800 | 930 | ||||||
| 2025-08-04 | 13F | Pensionmark Financial Group, Llc | 162,151 | -12.78 | 6,082 | -11.12 | ||||
| 2025-07-24 | 13F | McKinley Carter Wealth Services, Inc. | 27,150 | -7.25 | 1,018 | -5.48 | ||||
| 2025-07-21 | 13F | Credential Qtrade Securities Inc. | 0 | -100.00 | 0 | -100.00 | ||||
| 2025-08-14 | 13F | FC Advisory LLC | 275,659 | 1.52 | 10,340 | 3.44 | ||||
| 2025-08-05 | 13F | Wakefield Asset Management LLLP | 15,707 | 3.10 | 589 | 5.18 | ||||
| 2025-07-31 | 13F | AlTi Global, Inc. | 0 | -100.00 | 0 | |||||
| 2025-06-24 | NP | NSTLX - Neuberger Berman Strategic Income Fund Institutional Class | 315,229 | 11,537 | ||||||
| 2025-04-24 | 13F | Vista Investment Partners Ii, Llc | 0 | -100.00 | 0 | |||||
| 2025-05-12 | 13F | Empirical Asset Management, LLC | 0 | -100.00 | 0 | |||||
| 2025-08-25 | NP | PRINCIPAL VARIABLE CONTRACTS FUNDS INC - Core Plus Bond Account Class 1 | 221,000 | 8,290 | ||||||
| 2025-08-07 | 13F | CENTRAL TRUST Co | 296 | 0.00 | 11 | 10.00 | ||||
| 2025-07-21 | 13F | Clarity Capital Partners LLC | 14,587 | -71.30 | 547 | -70.75 | ||||
| 2025-08-08 | 13F | Condor Capital Management | 23,870 | -0.00 | 895 | 1.94 | ||||
| 2025-08-14 | 13F | Strive Asset Management, LLC | 88,503 | 17.76 | 3,320 | 19.99 | ||||
| 2025-08-11 | 13F | Cornerstone Planning Group LLC | 26 | 0.00 | 1 | |||||
| 2025-07-29 | 13F | Aire Advisors, Llc | 5,795 | -1.48 | 217 | 0.46 | ||||
| 2025-07-30 | 13F | Blume Capital Management, Inc. | 299 | 11 | ||||||
| 2025-08-14 | 13F | Federation des caisses Desjardins du Quebec | 688 | 52.89 | 26 | 56.25 | ||||
| 2025-07-17 | 13F | G&S Capital LLC | 5,863 | 1.72 | 220 | 3.30 | ||||
| 2025-08-13 | 13F | Flow Traders U.s. Llc | 97,897 | 4 | ||||||
| 2025-07-25 | 13F | We Are One Seven, LLC | 7,574 | 284 | ||||||
| 2025-05-15 | 13F | Ancora Advisors, LLC | 0 | -100.00 | 0 | -100.00 | ||||
| 2025-08-14 | 13F | Toroso Investments, LLC | 0 | -100.00 | 0 | |||||
| 2025-07-10 | 13F | Farmers & Merchants Trust Co of Chambersburg PA | 269 | 0.00 | 0 | |||||
| 2025-08-14 | 13F | Daiwa Securities Group Inc. | 328 | 864.71 | 0 | |||||
| 2025-08-07 | 13F | Addison Advisors LLC | 612 | 23 | ||||||
| 2025-07-15 | 13F | LeConte Wealth Management, LLC | 42,976 | 87.50 | 1,612 | 91.22 | ||||
| 2025-08-14 | 13F/A | Skopos Labs, Inc. | 220 | 8 | ||||||
| 2025-08-25 | NP | MML Series Investment Fund II - MML iShares 80/20 Allocation Fund Service Class I | 29,514 | 7.35 | 1,107 | 9.39 | ||||
| 2025-06-26 | NP | THMAX - Thrivent Moderate Allocation Fund Class A | 56,000 | 0.00 | 2,050 | -1.87 | ||||
| 2025-08-13 | 13F | SageView Advisory Group, LLC | 20,639 | 49.78 | 772 | 52.27 | ||||
| 2025-08-28 | NP | Northern Lights Fund Trust - Ocean Park Diversified Income ETF | 26,950 | -18.98 | 1,011 | -17.48 | ||||
| 2025-08-13 | 13F | Hsbc Holdings Plc | 90,078 | -3.27 | 3,379 | -1.43 | ||||
| 2025-08-13 | 13F | Mount Yale Investment Advisors, LLC | 81 | 3 | ||||||
| 2025-07-10 | 13F | Piscataqua Savings Bank | 168 | 0.00 | 6 | 0.00 | ||||
| 2025-07-18 | 13F | Provident Wealth Management, LLC | 14,221 | -3.20 | 533 | -1.30 | ||||
| 2025-08-12 | 13F | Nuveen, LLC | 226,206 | -1.29 | 8,485 | 0.58 | ||||
| 2025-05-13 | 13F | Quadrature Capital Ltd | 0 | -100.00 | 0 | |||||
| 2025-08-06 | 13F | Atlas Legacy Advisors, LLC | 41,448 | 5.99 | 1,555 | 7.32 | ||||
| 2025-08-11 | 13F | PFG Private Wealth Management, LLC | 0 | -100.00 | 0 | |||||
| 2025-08-13 | 13F | Berkshire Asset Management Llc/pa | 6,622 | -3.88 | 248 | -1.20 | ||||
| 2025-08-11 | 13F | Parr Mcknight Wealth Management Group, Llc | 165,549 | -11.41 | 6,210 | -9.73 | ||||
| 2025-07-25 | 13F | Concord Wealth Partners | 2,011 | -3.69 | 75 | -1.32 | ||||
| 2025-07-17 | 13F | Mattern Wealth Management LLC | 8,141 | 6.54 | 305 | 8.54 |