Mga Batayang Estadistika
| Pemilik Institusional | 941 total, 934 long only, 1 short only, 6 long/short - change of -1.16% MRQ |
| Alokasi Portofolio Rata-rata | 0.2389 % - change of -8.63% MRQ |
| Saham Institusional (Jangka Panjang) | 173,393,905 (ex 13D/G) - change of -6.49MM shares -3.61% MRQ |
| Nilai Institusional (Jangka Panjang) | $ 10,010,838 USD ($1000) |
Kepemilikan Institusional dan Pemegang Saham
TotalEnergies SE - Depositary Receipt (Common Stock) (US:TTE) memiliki 941 pemilik institusional dan pemegang saham yang telah mengajukan formulir 13D/G atau 13F kepada Komisi Bursa Efek (Securities Exchange Commission/SEC). Lembaga-lembaga ini memegang total 173,403,035 saham. Pemegang saham terbesar meliputi Fisher Asset Management, LLC, Aristotle Capital Management, LLC, Fmr Llc, Bank Of America Corp /de/, Morgan Stanley, Wellington Management Group Llp, Franklin Resources Inc, Wells Fargo & Company/mn, FLPSX - Fidelity Low-Priced Stock Fund, and Price T Rowe Associates Inc /md/ .
Struktur kepemilikan institusional TotalEnergies SE - Depositary Receipt (Common Stock) (NYSE:TTE) menunjukkan posisi terkini di perusahaan oleh institusi dan dana, serta perubahan terbaru dalam ukuran posisi. Pemegang saham utama dapat mencakup investor individu, reksa dana, dana lindung nilai, atau institusi. Jadwal 13D menunjukkan bahwa investor memegang (atau pernah memegang) lebih dari 5% saham perusahaan dan bermaksud (atau pernah bermaksud) untuk secara aktif mengejar perubahan strategi bisnis. Jadwal 13G menunjukkan investasi pasif lebih dari 5%.
The share price as of September 4, 2025 is 61.54 / share. Previously, on September 5, 2024, the share price was 66.81 / share. This represents a decline of 7.89% over that period.

Skor Sentimen Dana
Skor Sentimen Dana (sebelumnya dikenal sebagai Skor Akumulasi Kepemilikan) menemukan saham-saham yang paling banyak dibeli oleh dana. Ini adalah hasil dari model kuantitatif multi-faktor yang canggih yang mengidentifikasi perusahaan dengan tingkat akumulasi institusional tertinggi. Model penilaian menggunakan kombinasi dari total peningkatan pemilik yang diungkapkan, perubahan dalam alokasi portofolio pada pemilik tersebut, dan metrik lainnya. Angka berkisar dari 0 hingga 100, dengan angka yang lebih tinggi menunjukkan tingkat akumulasi yang lebih tinggi dibandingkan dengan perusahaan sejenisnya, dan 50 adalah rata-ratanya.
Frekuensi Pembaruan: Setiap Hari
Lihat Ownership Explorer, yang menyediakan daftar perusahaan dengan peringkat tertinggi.
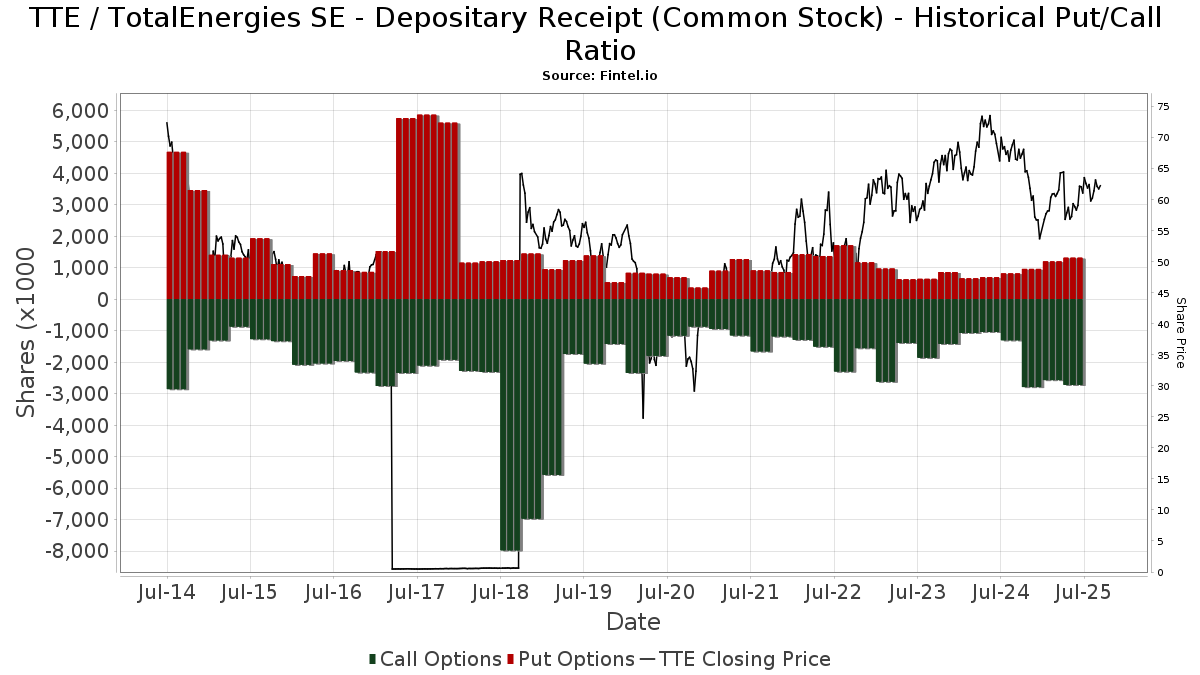
Rasio Put/Call Institusional
Selain melaporkan isu ekuitas dan utang standar, institusi dengan aset di bawah manajemen lebih dari 100 juta dolar AS juga harus mengungkapkan kepemilikan opsi put dan call mereka. Karena opsi put umumnya menunjukkan sentimen negatif, dan opsi call menunjukkan sentimen positif, kita dapat mengetahui sentimen institusional secara keseluruhan dengan memplot rasio put terhadap call. Grafik di sebelah kanan memplot rasio put/call historis untuk instrumen ini.
Menggunakan Rasio Put/Call sebagai indikator sentimen investor mengatasi salah satu kekurangan utama dari penggunaan total kepemilikan institusional, yaitu sejumlah besar aset yang dikelola diinvestasikan secara pasif untuk melacak indeks. Dana yang dikelola secara pasif biasanya tidak membeli opsi, sehingga indikator rasio put/call lebih akurat dalam melacak sentimen dana yang dikelola secara aktif.
Pengajuan 13D/G
Kami menyajikan pengajuan 13D/G secara terpisah dari pengajuan 13F karena perlakuan yang berbeda oleh SEC. Pengajuan 13D/G dapat diajukan oleh kelompok investor (dengan satu pemimpin), sedangkan pengajuan 13F tidak bisa. Hal ini mengakibatkan situasi di mana seorang investor dapat mengajukan 13D/G yang melaporkan satu nilai untuk total saham (mewakili semua saham yang dimiliki oleh kelompok investor), tetapi kemudian mengajukan 13F yang melaporkan nilai yang berbeda untuk total saham (mewakili kepemilikan mereka sendiri). Ini berarti bahwa kepemilikan saham dari pengajuan 13D/G dan pengajuan 13F seringkali tidak dapat dibandingkan secara langsung, sehingga kami menyajikannya secara terpisah.
Catatan: Mulai 16 Mei 2021, kami tidak lagi menampilkan pemilik yang belum mengajukan 13D/G dalam setahun terakhir. Sebelumnya, kami menampilkan riwayat lengkap pengajuan 13D/G. Secara umum, entitas yang diwajibkan untuk mengajukan pengajuan 13D/G harus mengajukan setidaknya setiap tahun sebelum mengirimkan pengajuan penutupan. Namun, terkadang dana keluar dari posisi tanpa mengirimkan pengajuan penutupan (misalnya, mereka menghentikan operasi), sehingga menampilkan riwayat lengkap terkadang menyebabkan kebingungan tentang kepemilikan saat ini. Untuk mencegah kebingungan, kami sekarang hanya menampilkan pemilik 'saat ini' - yaitu - pemilik yang telah mengajukan dalam setahun terakhir.
Upgrade to unlock premium data.
Pengajuan 13F dan NPORT
Detail pada pengajuan 13F tersedia gratis. Detail pada pengajuan NP memerlukan keanggotaan premium. Baris berwarna hijau menunjukkan posisi baru. Baris berwarna merah menunjukkan posisi yang sudah ditutup. Klik tautan ini ikon untuk melihat riwayat transaksi selengkapnya.
Tingkatkan
untuk membuka data premium dan mengekspor ke Excel ![]() .
.
Important Note
In an effort to reduce load times for our mobile users, we are testing some ways to deliver lighter pages.
In this first test, we will deliver only the most recent 750 transactions (out of 1102 for this stock). If you are interested in loading *all* the transactions for this company, click the "load all" button below. This is just a test and if you don't like it, please let us know by submitting some gentle feedback via the link at the bottom of this page.
Load All| Tanggal File | Sumber | Investor | Ketik | Presyo ng Avg (Silangan) |
Saham | Δ Saham (%) |
Dilaporkan Nilai ($1000) |
Nilai Δ (%) |
Alokasi Port (%) |
|
|---|---|---|---|---|---|---|---|---|---|---|
| 2025-07-15 | 13F | Drum Hill Capital, LLC | 60,399 | -1.80 | 3,708 | -6.81 | ||||
| 2025-03-11 | 13F | Anchor Pointe Wealth Management, LLC | 3,680 | 200 | ||||||
| 2025-08-07 | 13F | Parkside Financial Bank & Trust | 1,940 | 83.54 | 119 | 75.00 | ||||
| 2025-05-15 | 13F | Altshuler Shaham Ltd | 0 | -100.00 | 0 | |||||
| 2025-04-15 | 13F | Mv Capital Management, Inc. | 0 | -100.00 | 0 | |||||
| 2025-07-08 | 13F | Persium Advisors, LLC | 11,744 | 31.88 | 721 | 25.00 | ||||
| 2025-08-12 | 13F | Deutsche Bank Ag\ | 6,613 | 0.00 | 406 | -5.15 | ||||
| 2025-08-14 | 13F | Kovitz Investment Group Partners, LLC | 101,245 | 19.69 | 6,218 | 13.63 | ||||
| 2025-07-23 | 13F | Clear Creek Financial Management, LLC | 6,184 | 2.81 | 380 | -2.57 | ||||
| 2025-08-13 | 13F | Bollard Group LLC | 1,000 | 0.00 | 0 | |||||
| 2025-08-13 | 13F | Legacy Capital Wealth Partners, LLC | 8,807 | -3.04 | 541 | -8.01 | ||||
| 2025-08-14 | 13F | Peak6 Llc | Call | 200,000 | 12,278 | |||||
| 2025-07-09 | 13F | Bank of New Hampshire | 0 | -100.00 | 0 | |||||
| 2025-06-25 | NP | EIPX - FT Energy Income Partners Strategy ETF | 267,789 | -6.35 | 15,224 | -8.26 | ||||
| 2025-07-29 | NP | DIVY - Sound Equity Income ETF | 13,279 | -3.99 | 779 | -6.48 | ||||
| 2025-07-15 | 13F | Td Private Client Wealth Llc | 81,768 | 5,020 | ||||||
| 2025-08-12 | 13F | Archer Investment Corp | 30 | 0.00 | 2 | 0.00 | ||||
| 2025-08-14 | 13F | Ameriprise Financial Inc | 1,047,687 | 16.09 | 64,360 | 10.01 | ||||
| 2025-08-04 | 13F | Atria Investments Llc | 100,251 | -8.92 | 6,154 | -13.57 | ||||
| 2025-08-08 | 13F | Wealth Alliance | 27,265 | -0.06 | 1,674 | -5.16 | ||||
| 2025-07-14 | 13F | Sowell Financial Services LLC | 3,588 | -17.02 | 220 | -21.15 | ||||
| 2025-08-14 | 13F | Vident Advisory, LLC | 0 | -100.00 | 0 | |||||
| 2025-07-24 | 13F | JNBA Financial Advisors | 412 | 0.00 | 25 | -3.85 | ||||
| 2025-05-15 | 13F | Hall Laurie J Trustee | 0 | -100.00 | 0 | |||||
| 2025-08-04 | 13F | Simon Quick Advisors, Llc | 5,121 | 51.51 | 314 | 44.04 | ||||
| 2025-07-25 | 13F | Fifth Third Wealth Advisors LLC | 3,873 | 16.55 | 238 | 10.75 | ||||
| 2025-08-26 | NP | FVD - First Trust Value Line Dividend Index Fund This fund is a listed as child fund of First Trust Advisors Lp and if that institution has disclosed ownership in this security, then these positions will not be double counted when calculating total shares and total value | 615,635 | 37,794 | ||||||
| 2025-08-08 | 13F | New England Capital Financial Advisors LLC | 101 | 6 | ||||||
| 2025-08-13 | 13F | Federated Hermes, Inc. | 3,582,127 | 0.85 | 219,907 | -4.30 | ||||
| 2025-07-28 | 13F | Sagespring Wealth Partners, Llc | 14,740 | 7.47 | 905 | 1.92 | ||||
| 2025-08-05 | 13F | GHP Investment Advisors, Inc. | 2,016 | 0.00 | 124 | -5.38 | ||||
| 2025-08-14 | 13F | Horizon Investments, LLC | 11,546 | 10.11 | 709 | 4.42 | ||||
| 2025-08-13 | 13F | Capital World Investors | 69,605 | -1.19 | 4,281 | -5.27 | ||||
| 2025-04-29 | 13F | Pacific Point Advisors, LLC | 0 | -100.00 | 0 | |||||
| 2025-07-18 | 13F | Institute for Wealth Management, LLC. | 3,391 | 0.00 | 208 | -5.02 | ||||
| 2025-08-08 | 13F | Thoroughbred Financial Services, Llc | 0 | -100.00 | 0 | |||||
| 2025-07-23 | 13F | Prime Capital Investment Advisors, LLC | 8,396 | -2.60 | 515 | -7.54 | ||||
| 2025-07-31 | 13F | Kornitzer Capital Management Inc /ks | 12,312 | -7.30 | 756 | -12.11 | ||||
| 2025-08-14 | 13F | Css Llc/il | 11,788 | 69.81 | 724 | 61.02 | ||||
| 2025-05-15 | 13F | Activest Wealth Management | 0 | -100.00 | 0 | -100.00 | ||||
| 2025-08-07 | 13F/A | Curat Global, LLC | 1,400 | 0.00 | 86 | -5.56 | ||||
| 2025-08-11 | 13F | FSC Wealth Advisors, LLC | 0 | -100.00 | 0 | |||||
| 2025-07-10 | 13F | Moody National Bank Trust Division | 9,704 | -3.70 | 596 | -8.60 | ||||
| 2025-08-14 | 13F | Boston Private Wealth Llc | 0 | -100.00 | 0 | |||||
| 2025-07-29 | 13F | Beverly Hills Private Wealth, LLC | 11,172 | -26.43 | 686 | -30.24 | ||||
| 2025-08-13 | 13F | Russell Investments Group, Ltd. | 24,274 | 14.92 | 1,490 | 9.08 | ||||
| 2025-08-14 | 13F | Wellington Management Group Llp | 7,268,049 | -3.04 | 446,186 | -7.98 | ||||
| 2025-08-13 | 13F | Congress Wealth Management LLC / DE / | 35,747 | -2.10 | 2,195 | -6.72 | ||||
| 2025-08-12 | 13F | SRS Capital Advisors, Inc. | 938 | -35.40 | 116 | 24.73 | ||||
| 2025-08-04 | 13F | Center for Financial Planning, Inc. | 200 | 0.00 | 12 | 0.00 | ||||
| 2025-06-23 | NP | UEPIX - Europe 30 Profund Investor Class | 2,107 | 74.13 | 120 | 70.00 | ||||
| 2025-08-14 | 13F | Pingora Partners LLC | 209 | 0.00 | 13 | -7.69 | ||||
| 2025-08-14 | 13F | Turim 21 Investimentos Ltda. | 410 | 0.00 | 25 | -3.85 | ||||
| 2025-06-26 | NP | DFIEX - International Core Equity Portfolio - Institutional Class This fund is a listed as child fund of Dimensional Fund Advisors Lp and if that institution has disclosed ownership in this security, then these positions will not be double counted when calculating total shares and total value | 215,223 | 0.00 | 12,235 | -2.03 | ||||
| 2025-07-29 | 13F | Salomon & Ludwin, LLC | 44 | 100.00 | 3 | 100.00 | ||||
| 2025-08-13 | 13F | Walleye Trading LLC | Call | 88,100 | 23.04 | 5,408 | 16.78 | |||
| 2025-08-05 | 13F | Burney Co/ | 4,559 | -19.41 | 280 | -23.56 | ||||
| 2025-08-13 | 13F | Walleye Trading LLC | Put | 323,100 | 220.54 | 19,835 | 204.22 | |||
| 2025-08-13 | 13F | Walleye Trading LLC | 67,482 | 406.17 | 4,143 | 380.51 | ||||
| 2025-08-01 | 13F | Ashton Thomas Private Wealth, LLC | 47,316 | 6.82 | 2,951 | 1.69 | ||||
| 2025-08-13 | 13F | EverSource Wealth Advisors, LLC | 8,693 | 75.05 | 534 | 66.04 | ||||
| 2025-08-14 | 13F | Mercer Global Advisors Inc /adv | 99,341 | -1.44 | 6,099 | -6.47 | ||||
| 2025-08-14 | 13F | Mml Investors Services, Llc | 181,476 | 2.12 | 11 | 0.00 | ||||
| 2025-08-14 | 13F | Verition Fund Management LLC | 0 | -100.00 | 0 | |||||
| 2025-07-31 | 13F | Nisa Investment Advisors, Llc | 1,100 | 22.22 | 69 | 17.24 | ||||
| 2025-07-25 | 13F | Envestnet Portfolio Solutions, Inc. | 63,898 | -0.34 | 3,923 | -5.43 | ||||
| 2025-08-14 | 13F | SIH Partners, LLLP | 8,599 | 0.00 | 528 | -5.22 | ||||
| 2025-07-22 | 13F | Net Worth Advisory Group | 4,701 | -0.36 | 289 | -5.57 | ||||
| 2025-08-14 | 13F | Nomura Holdings Inc | Call | 496,100 | 118.64 | 30,456 | 107.49 | |||
| 2025-08-13 | 13F | Quadrant Capital Group Llc | 57,477 | -6.69 | 3,529 | -11.45 | ||||
| 2025-08-13 | 13F | Rsm Us Wealth Management Llc | 23,916 | 5.64 | 1,492 | 0.47 | ||||
| 2025-07-17 | 13F | Vermillion Wealth Management, Inc. | 200 | 0.00 | 12 | 0.00 | ||||
| 2025-07-16 | 13F | Advisors Management Group Inc /adv | 149,343 | -0.01 | 9 | 0.00 | ||||
| 2025-07-14 | 13F | Farmers & Merchants Investments Inc | 7,804 | -1.68 | 479 | -6.63 | ||||
| 2025-08-13 | 13F | New York State Common Retirement Fund | 20,448 | -8.01 | 1 | 0.00 | ||||
| 2025-08-13 | 13F | Millstone Evans Group, LLC | 154 | 0.00 | 9 | 0.00 | ||||
| 2025-07-25 | NP | AIWEX - World Energy Fund Institutional | 40,000 | -20.00 | 2,347 | -22.05 | ||||
| 2025-08-26 | NP | UPAR - UPAR Ultra Risk Parity ETF | 5,280 | -7.85 | 324 | -12.43 | ||||
| 2025-08-14 | 13F | Van Eck Associates Corp | 35,574 | 5.22 | 2 | 0.00 | ||||
| 2025-08-08 | 13F | SG Americas Securities, LLC | 0 | -100.00 | 0 | |||||
| 2025-08-14 | 13F | Colony Group, LLC | 5,271 | -84.26 | 324 | -85.09 | ||||
| 2025-08-13 | 13F | Grantham, Mayo, Van Otterloo & Co. LLC | 102,643 | 51.08 | 6,301 | 43.37 | ||||
| 2025-05-14 | 13F | Van Hulzen Asset Management, LLC | 0 | -100.00 | 0 | |||||
| 2025-07-16 | 13F | St Germain D J Co Inc | 458 | 0.00 | 28 | -3.45 | ||||
| 2025-07-18 | 13F | New Wave Wealth Advisors Llc | 4,520 | -4.44 | 277 | -9.18 | ||||
| 2025-08-12 | 13F | MAI Capital Management | 6,281 | 12.56 | 386 | 6.94 | ||||
| 2025-08-04 | 13F | Arkadios Wealth Advisors | 19,203 | 6.68 | 1,179 | 1.20 | ||||
| 2025-08-15 | 13F | CI Private Wealth, LLC | 194,537 | 90.73 | 11,943 | 80.99 | ||||
| 2025-07-23 | NP | EIPI - FT Energy Income Partners Enhanced Income ETF | 514,185 | -1.25 | 30,172 | -3.79 | ||||
| 2025-07-31 | 13F | Linden Thomas Advisory Services, LLC | 9,906 | 35.33 | 608 | 28.54 | ||||
| 2025-08-14 | 13F | State Street Corp | 129,968 | -4.34 | 8,074 | -9.02 | ||||
| 2025-07-11 | 13F | Mitchell & Pahl Private Wealth, Llc | 4,490 | -3.63 | 276 | -8.64 | ||||
| 2025-07-07 | 13F | Retirement Wealth Solutions LLC | 61 | 0.00 | 4 | 0.00 | ||||
| 2025-08-08 | 13F | Massachusetts Financial Services Co /ma/ | 181,214 | 5.52 | 11,125 | 0.14 | ||||
| 2025-08-05 | 13F | Fullcircle Wealth Llc | 8,725 | -0.14 | 519 | -0.95 | ||||
| 2025-08-06 | 13F | Legacy Bridge, LLC | 1,099 | 37.55 | 67 | 31.37 | ||||
| 2025-08-11 | 13F | Brown Brothers Harriman & Co | 1,893 | 77.08 | 116 | 68.12 | ||||
| 2025-08-07 | 13F | Connor, Clark & Lunn Investment Management Ltd. | 545,749 | 295.48 | 33,504 | 275.30 | ||||
| 2025-08-05 | 13F | American Assets Investment Management, LLC | 150,000 | 0.00 | 9,208 | -5.10 | ||||
| 2025-07-29 | 13F | Stephens Inc /ar/ | 24,774 | -25.34 | 1,521 | -29.17 | ||||
| 2025-07-30 | 13F | Argonautica Private Wealth Management, Inc | 6,295 | -1.33 | 386 | -6.31 | ||||
| 2025-08-08 | 13F | Creative Planning | 185,658 | -1.00 | 11,398 | -6.04 | ||||
| 2025-08-13 | 13F | Colonial Trust Advisors | 198 | -92.99 | 12 | -93.41 | ||||
| 2025-08-14 | 13F | Lighthouse Investment Partners, LLC | 0 | -100.00 | 0 | |||||
| 2025-08-27 | NP | Liberty All Star Equity Fund | 126,800 | -2.46 | 7,784 | -7.43 | ||||
| 2025-08-14 | 13F | Capitolis Liquid Global Markets LLC | 0 | -100.00 | 0 | |||||
| 2025-08-01 | 13F | First National Trust Co | 16,750 | -0.37 | 1,028 | -5.43 | ||||
| 2025-07-23 | 13F | Venturi Wealth Management, LLC | 18,499 | -31.39 | 1,136 | -34.92 | ||||
| 2025-07-28 | 13F | Frazier Financial Advisors, LLC | 508 | 20.67 | 31 | 14.81 | ||||
| 2025-07-08 | 13F | Everpar Advisors Llc | 5,504 | -14.29 | 338 | -18.80 | ||||
| 2025-07-21 | 13F | Hilltop National Bank | 2,723 | 103.97 | 167 | 131.94 | ||||
| 2025-08-12 | 13F | LPL Financial LLC | 1,302,314 | 2.41 | 79,949 | -2.81 | ||||
| 2025-08-14 | 13F | BTG Pactual Asset Management US LLC | 0 | -100.00 | 0 | |||||
| 2025-08-25 | 13F/A | Neuberger Berman Group LLC | 50,590 | 20.17 | 3,106 | 14.03 | ||||
| 2025-07-24 | 13F | Standard Life Aberdeen plc | 347,500 | 2.99 | 21,333 | -2.26 | ||||
| 2025-08-13 | 13F | Kilter Group LLC | 23 | 1 | ||||||
| 2025-08-06 | 13F | North Capital, Inc. | 136 | -10.53 | 8 | -11.11 | ||||
| 2025-08-26 | NP | TEQI - T. Rowe Price Equity Income ETF This fund is a listed as child fund of Price T Rowe Associates Inc /md/ and if that institution has disclosed ownership in this security, then these positions will not be double counted when calculating total shares and total value | 87,437 | 0.65 | 5,368 | -4.48 | ||||
| 2025-08-14 | 13F | Engineers Gate Manager LP | 12,243 | 752 | ||||||
| 2025-07-24 | 13F | Costello Asset Management, INC | 500 | 0.00 | 31 | -6.25 | ||||
| 2025-08-29 | NP | DIVGX - Guardian Dividend Growth Fund Class I | 20,209 | 22.20 | 1,241 | 16.00 | ||||
| 2025-07-28 | 13F | BRYN MAWR TRUST Co | 4,705 | -7.82 | 289 | -12.73 | ||||
| 2025-08-14 | 13F | Jain Global LLC | 3,779 | 232 | ||||||
| 2025-08-01 | 13F | Bessemer Group Inc | 4,834 | 11.59 | 0 | |||||
| 2025-08-08 | 13F | Avantax Advisory Services, Inc. | 69,544 | 5.83 | 4,269 | 0.42 | ||||
| 2025-08-05 | 13F | South Dakota Investment Council | 1,425 | 0.00 | 0 | |||||
| 2025-08-06 | 13F | SOUTH STATE Corp | 0 | -100.00 | 0 | |||||
| 2025-07-30 | NP | FCTDX - Strategic Advisers Fidelity U.S. Total Stock Fund This fund is a listed as child fund of Fmr Llc and if that institution has disclosed ownership in this security, then these positions will not be double counted when calculating total shares and total value | 245,620 | -17.56 | 14,413 | -19.68 | ||||
| 2025-07-30 | 13F | Axecap Investments, LLC | 41,493 | -7.28 | 2,547 | -12.02 | ||||
| 2025-04-22 | 13F | Mendota Financial Group, LLC | 0 | -100.00 | 0 | |||||
| 2025-07-29 | 13F | AssuredPartners Investment Advisors, LLC | 18,833 | -3.31 | 1,156 | -8.18 | ||||
| 2025-08-11 | 13F | Delta Asset Management Llc/tn | 66 | 0.00 | 4 | 0.00 | ||||
| 2025-07-25 | 13F | Cwm, Llc | 99,214 | 3.34 | 6 | 0.00 | ||||
| 2025-08-14 | 13F | Optiver Holding B.V. | 412,512 | 25,324 | ||||||
| 2025-08-14 | 13F | Susquehanna International Group, Llp | 15,159 | 41.65 | 931 | 34.39 | ||||
| 2025-08-14 | 13F | Prestige Wealth Management Group LLC | 750 | 0.00 | 47 | -6.12 | ||||
| 2025-08-15 | 13F | Keel Point, LLC | 7,185 | 69.86 | 441 | 61.54 | ||||
| 2025-08-14 | 13F | Susquehanna International Group, Llp | Call | 978,900 | -8.30 | 60,095 | -12.98 | |||
| 2025-07-21 | 13F | Riverview Trust Co | 1,750 | 0.00 | 107 | -5.31 | ||||
| 2025-08-14 | 13F | Susquehanna International Group, Llp | Put | 805,100 | 10.12 | 49,425 | 4.51 | |||
| 2025-08-05 | 13F | Code Waechter LLC | 14,708 | 52.54 | 903 | |||||
| 2025-08-13 | 13F | Todd Asset Management Llc | 1,180,711 | -0.33 | 72,484 | -5.37 | ||||
| 2025-08-14 | 13F | Citadel Advisors Llc | Call | 645,200 | 72.98 | 39,609 | 64.15 | |||
| 2025-09-02 | NP | EIPIX - EIP Growth and Income Fund Class I | 21,940 | -20.33 | 1,307 | -16.55 | ||||
| 2025-08-14 | 13F | Citadel Advisors Llc | 11,017 | -49.15 | 676 | -51.75 | ||||
| 2025-08-14 | 13F | Miller Value Partners, Llc | 7,650 | 0.00 | 470 | -5.06 | ||||
| 2025-08-14 | 13F | Citadel Advisors Llc | Put | 98,100 | -27.44 | 6,022 | -31.15 | |||
| 2025-07-14 | 13F | Toth Financial Advisory Corp | 0 | -100.00 | 0 | -100.00 | ||||
| 2025-08-01 | 13F | Jennison Associates Llc | 406,834 | 21.75 | 24,976 | 15.54 | ||||
| 2025-08-13 | 13F | Diametric Capital, LP | 3,276 | 201 | ||||||
| 2025-08-14 | 13F | Federation des caisses Desjardins du Quebec | 10,153 | 1.36 | 623 | -3.86 | ||||
| 2025-08-13 | 13F | Jones Financial Companies Lllp | 340,695 | -2.46 | 20,940 | -6.89 | ||||
| 2025-07-24 | 13F | U S Global Investors Inc | 15,000 | 275.00 | 921 | 256.59 | ||||
| 2025-08-15 | 13F | Kestra Advisory Services, LLC | 26,505 | 50.40 | 1,627 | 42.72 | ||||
| 2025-08-26 | NP | BlackRock ESG Capital Allocation Trust This fund is a listed as child fund of BlackRock, Inc. and if that institution has disclosed ownership in this security, then these positions will not be double counted when calculating total shares and total value | 44,000 | 0.00 | 2,701 | -5.09 | ||||
| 2025-07-30 | 13F | Eqis Capital Management, Inc. | 0 | -100.00 | 0 | |||||
| 2025-04-24 | 13F | Decker Retirement Planning Inc. | 0 | -100.00 | 0 | |||||
| 2025-07-14 | 13F | Painted Porch Advisors LLC | 0 | -100.00 | 0 | -100.00 | ||||
| 2025-08-06 | 13F | Marco Investment Management Llc | 19,559 | -0.51 | 1,201 | -5.59 | ||||
| 2025-07-25 | 13F | Gw Henssler & Associates Ltd | 317,286 | -0.27 | 19,478 | -5.35 | ||||
| 2025-08-11 | 13F | Portside Wealth Group, LLC | 3,845 | 16.62 | 236 | 10.80 | ||||
| 2025-05-12 | 13F | Pinpoint Asset Management Ltd | 30,885 | 0.00 | 1,998 | 18.66 | ||||
| 2025-07-14 | 13F | Opal Wealth Advisors, LLC | 1,495 | 49.80 | 92 | 42.19 | ||||
| 2025-08-12 | 13F | Aviso Financial Inc. | 49,700 | 5.40 | 3,051 | 0.03 | ||||
| 2025-08-06 | 13F | AE Wealth Management LLC | 21,458 | 4.91 | 1,317 | -0.45 | ||||
| 2025-08-04 | 13F | Pensionmark Financial Group, Llc | 7,169 | -1.86 | 442 | -6.75 | ||||
| 2025-07-22 | 13F | Inlight Wealth Management, LLC | 500 | 0.00 | 31 | -6.25 | ||||
| 2025-07-22 | 13F | Old National Bancorp /in/ | 7,535 | -17.56 | 463 | -21.83 | ||||
| 2025-08-11 | 13F | Pin Oak Investment Advisors Inc | 459 | 0.00 | 0 | |||||
| 2025-08-27 | NP | TIQIX - Touchstone Global ESG Equity Fund Class Y | 221,361 | 11.99 | 13,589 | 6.27 | ||||
| 2025-08-13 | 13F | First Trust Advisors Lp | 680,494 | 220.32 | 41,776 | 204.00 | ||||
| 2025-08-13 | 13F | Mount Yale Investment Advisors, LLC | 14,379 | 4.71 | 883 | -0.68 | ||||
| 2025-08-27 | NP | SEASONS SERIES TRUST - SA Multi-Managed Large Cap Value Portfolio Class 1 | 7,720 | 5.32 | 474 | -0.21 | ||||
| 2025-08-13 | 13F | Colonial Trust Co / SC | 347 | -0.29 | 21 | -4.55 | ||||
| 2025-08-05 | 13F | Core Alternative Capital | 0 | -100.00 | 0 | |||||
| 2025-08-13 | 13F | Kayne Anderson Rudnick Investment Management Llc | 379,440 | 2.81 | 23,294 | -2.44 | ||||
| 2025-08-14 | 13F | Manufacturers Life Insurance Company, The | 0 | -100.00 | 0 | |||||
| 2025-07-25 | 13F | Asset Planning,Inc | 569 | 0.00 | 35 | -5.56 | ||||
| 2025-08-14 | 13F | Wells Fargo & Company/mn | 5,545,441 | -2.85 | 340,435 | -7.81 | ||||
| 2025-07-21 | 13F | Kennebec Savings Bank | 81 | 0.00 | 5 | -20.00 | ||||
| 2025-08-14 | 13F | Wells Fargo & Company/mn | Call | 77,600 | -60.37 | 4,764 | -62.40 | |||
| 2025-08-07 | 13F | Boston Partners | 0 | -100.00 | 0 | |||||
| 2025-07-18 | 13F | Lynx Investment Advisory | 4,046 | 0.00 | 248 | -4.98 | ||||
| 2025-07-14 | 13F | Legacy Capital Group California, Inc. | 11,447 | 83.83 | 703 | 74.63 | ||||
| 2025-08-08 | 13F | Smithfield Trust Co | 874 | 0.00 | 0 | |||||
| 2025-07-07 | 13F | Roxbury Financial LLC | 3,060 | -26.02 | 188 | -24.90 | ||||
| 2025-08-07 | 13F | Teachers Retirement System Of The State Of Kentucky | 760,380 | 0.51 | 47 | -4.17 | ||||
| 2025-08-11 | 13F | Private Advisor Group, LLC | 23,251 | 4.64 | 1,427 | -0.70 | ||||
| 2025-05-15 | 13F | Concorde Asset Management, LLC | 4,670 | 265 | ||||||
| 2025-08-13 | 13F | Sanibel Captiva Trust Company, Inc. | 3,343 | -11.86 | 205 | -16.33 | ||||
| 2025-07-18 | 13F | First Pacific Financial | 30,285 | 178,047.06 | 1,859 | 185,800.00 | ||||
| 2025-08-08 | 13F | Banco Bilbao Vizcaya Argentaria, S.a. | 4,543 | -9.93 | 279 | -14.72 | ||||
| 2025-07-25 | 13F | Hemington Wealth Management | 445 | 0.00 | 0 | |||||
| 2025-07-23 | 13F | PARK CIRCLE Co | 10,000 | 0.00 | 614 | -5.11 | ||||
| 2025-08-28 | NP | AIGOX - Alger Growth & Income Portfolio Class I-2 | 4,622 | 0.00 | 284 | -5.03 | ||||
| 2025-08-19 | NP | NORTHWESTERN MUTUAL SERIES FUND INC - Large Company Value Portfolio | 29,305 | 142.61 | 1,799 | 130.35 | ||||
| 2025-08-25 | NP | HIADX - Hartford Dividend And Growth Hls Fund Ia | 649,834 | -1.91 | 39,893 | -6.91 | ||||
| 2025-08-14 | 13F | Barometer Capital Management Inc. | 0 | -100.00 | 0 | |||||
| 2025-07-11 | 13F/A | Umb Bank N A/mo | 4,107 | 4.34 | 252 | -0.79 | ||||
| 2025-08-12 | 13F | AlphaCore Capital LLC | 4,937 | 289 | ||||||
| 2025-07-09 | 13F | Sawyer & Company, Inc | 3,086 | 0.00 | 0 | |||||
| 2025-07-29 | 13F | TrueMark Investments, LLC | 24,607 | 18.37 | 1,511 | 12.35 | ||||
| 2025-06-13 | NP | Alpine Global Dynamic Dividend Fund | 41,200 | 0.00 | 2,342 | -2.01 | ||||
| 2025-06-26 | NP | ALBAX - Alger Growth & Income Fund Class A | 70,891 | 9.42 | 4,030 | 7.21 | ||||
| 2025-07-11 | 13F | Adirondack Trust Co | 122 | 0.00 | 7 | 0.00 | ||||
| 2025-08-06 | 13F | Valued Wealth Advisors LLC | 45 | 0.00 | 3 | 0.00 | ||||
| 2025-05-15 | 13F | Cinctive Capital Management LP | 0 | -100.00 | 0 | |||||
| 2025-08-05 | 13F | EPG Wealth Management LLC | 8,973 | 3.06 | 551 | -2.31 | ||||
| 2025-07-15 | 13F | Forte Capital Llc /adv | 32,480 | -0.31 | 1,994 | -5.41 | ||||
| 2025-08-14 | 13F | Hrt Financial Lp | 141,157 | 9 | ||||||
| 2025-08-14 | 13F | Strategic Global Advisors, LLC | 5,435 | 13.16 | 334 | 7.42 | ||||
| 2025-03-27 | NP | PTEU - Pacer Trendpilot European Index ETF | 9,360 | -16.02 | 543 | -28.08 | ||||
| 2025-07-22 | 13F | Clarius Group, LLC | 8,603 | 12.44 | 528 | 6.88 | ||||
| 2025-04-29 | 13F | Callan Capital, LLC | 22,014 | 56.79 | 1,424 | 86.14 | ||||
| 2025-07-16 | 13F | Fortune Financial Advisors, LLC | 14,122 | 1.77 | 867 | -3.46 | ||||
| 2025-08-12 | 13F | Steward Partners Investment Advisory, Llc | 17,402 | -6.16 | 1,068 | -10.93 | ||||
| 2025-07-25 | 13F | We Are One Seven, LLC | 10,070 | 21.38 | 618 | 15.30 | ||||
| 2025-08-13 | 13F | Capital Group Private Client Services, Inc. | 8,288 | 509 | ||||||
| 2025-07-14 | 13F | GAMMA Investing LLC | 4,518 | 30.77 | 277 | 24.22 | ||||
| 2025-07-25 | NP | FQTEX - Franklin Templeton SMACS: Series E Advisor Class | 150,000 | 0.00 | 8,802 | -2.57 | ||||
| 2025-08-14 | 13F | Group One Trading, L.p. | 12,290 | 754 | ||||||
| 2025-04-23 | 13F | Mascagni Wealth Management, Inc. | 0 | -100.00 | 0 | -100.00 | ||||
| 2025-08-28 | NP | JINTX - Johnson International Fund | 2,352 | 0.00 | 144 | -5.26 | ||||
| 2025-08-01 | 13F | MorganRosel Wealth Management, LLC | 49 | 0.00 | 3 | 0.00 | ||||
| 2025-07-30 | 13F | Drive Wealth Management, Llc | 9,645 | 596 | ||||||
| 2025-04-10 | 13F | Juncture Wealth Strategies, Llc | 0 | -100.00 | 0 | |||||
| 2025-07-09 | 13F | Bruce G. Allen Investments, LLC | 3,752 | 2.18 | 230 | -2.95 | ||||
| 2025-08-04 | 13F | Haven Private, LLC | 3,281 | 201 | ||||||
| 2025-07-10 | 13F | Global Financial Private Client, LLC | 0 | -100.00 | 0 | |||||
| 2025-07-11 | 13F | Seacrest Wealth Management, Llc | 0 | -100.00 | 0 | |||||
| 2025-07-17 | 13F | Park Place Capital Corp | 9,776 | -5.56 | 605 | -9.57 | ||||
| 2025-06-30 | NP | RGEF - Rockefeller Global Equity ETF | 135,316 | -5.93 | 7,693 | -7.85 | ||||
| 2025-07-11 | 13F | Farther Finance Advisors, LLC | 13,567 | 96.71 | 833 | 87.39 | ||||
| 2025-08-14 | 13F | Bank Of America Corp /de/ | 9,802,968 | 9.97 | 601,804 | 4.36 | ||||
| 2025-07-16 | 13F | Kathmere Capital Management, LLC | 5,216 | 11.96 | 320 | 6.31 | ||||
| 2025-08-11 | 13F | Elequin Capital Lp | 1 | 0.00 | 0 | |||||
| 2025-08-13 | 13F | Gabelli Funds Llc | 311,400 | 0.00 | 19,117 | -5.10 | ||||
| 2025-08-14 | 13F | Fred Alger Management, Llc | 80,432 | 0.00 | 5,004 | -4.85 | ||||
| 2025-08-11 | 13F | Cornerstone Planning Group LLC | 65 | -38.68 | 4 | -50.00 | ||||
| 2025-08-26 | NP | VIRTUS VARIABLE INSURANCE TRUST - Virtus Rampart Enhanced Core Equity Series Class A | 25,492 | -6.91 | 1,565 | -11.69 | ||||
| 2025-07-31 | 13F/A | Avion Wealth | 222 | 101.82 | 0 | |||||
| 2025-08-11 | 13F | Citigroup Inc | 611,603 | -3.64 | 37,546 | -8.55 | ||||
| 2025-08-01 | 13F | Belvedere Trading LLC | 0 | -100.00 | 0 | |||||
| 2025-07-10 | 13F | Sovran Advisors, LLC | 4,217 | 262 | ||||||
| 2025-07-29 | 13F | Albert D Mason Inc | 19,225 | -7.74 | 1,180 | -12.46 | ||||
| 2025-08-14 | 13F | Diversify Wealth Management, Llc | 18,957 | 20.45 | 1,169 | 27.09 | ||||
| 2025-07-08 | 13F | Parallel Advisors, LLC | 8,325 | 34.53 | 511 | 27.75 | ||||
| 2025-08-05 | 13F | Dunhill Financial, LLC | 500 | 31 | ||||||
| 2025-07-14 | 13F | UMA Financial Services, Inc. | 114 | 500.00 | 7 | 500.00 | ||||
| 2025-06-24 | NP | FNCRX - Franklin Natural Resources Fund Class C | 63,100 | -23.05 | 3,587 | -24.61 | ||||
| 2025-08-13 | 13F | Pinpoint Asset Management (Singapore) Pte. Ltd. | 30,885 | 1,896 | ||||||
| 2025-08-14 | 13F | Parvin Asset Management, LLC | 2,075 | 0.00 | 127 | -5.22 | ||||
| 2025-05-09 | 13F | William Blair Investment Management, Llc | 0 | -100.00 | 0 | |||||
| 2025-08-14 | 13F | Jane Street Group, Llc | Call | 56,500 | -88.21 | 3,469 | -88.81 | |||
| 2025-05-12 | 13F | Strengthening Families & Communities, LLC | 0 | -100.00 | 0 | |||||
| 2025-08-14 | 13F | Jane Street Group, Llc | 175,538 | 10,776 | ||||||
| 2025-08-14 | 13F | Diversify Advisory Services, LLC | 3,763 | 232 | ||||||
| 2025-08-06 | 13F | First Horizon Advisors, Inc. | 2,429 | 17.46 | 149 | 12.03 | ||||
| 2025-05-09 | 13F | Pathway Financial Advisers, LLC | 0 | -100.00 | 0 | |||||
| 2025-07-21 | 13F | Credential Securities Inc. | 15,141 | -6.06 | 919 | -1.08 | ||||
| 2025-07-15 | 13F | Missouri Trust & Investment Co | 1,090 | -0.91 | 67 | -7.04 | ||||
| 2025-07-07 | 13F | Investors Research Corp | 12,692 | 1.60 | 779 | -3.59 | ||||
| 2025-07-11 | 13F | Wedge Capital Management L L P/nc | 226,458 | -7.62 | 13,902 | -12.33 | ||||
| 2025-07-11 | 13F | First PREMIER Bank | 85 | 0 | ||||||
| 2025-07-30 | 13F | Whittier Trust Co | 10,425 | 6.05 | 640 | 0.63 | ||||
| 2025-04-03 | 13F | First Hawaiian Bank | 11,311 | -17.47 | 732 | -2.01 | ||||
| 2025-07-29 | 13F | Tweedy, Browne Co LLC | 133,168 | -2.93 | 8,175 | -7.89 | ||||
| 2025-08-12 | 13F | Timber Creek Capital Management LLC | 100,241 | -5.46 | 6,043 | -11.91 | ||||
| 2025-08-07 | 13F | Guardian Partners Inc. | 126,709 | -2.05 | 7,927 | 4.39 | ||||
| 2025-05-02 | 13F | Capital A Wealth Management, LLC | 53 | 0.00 | 3 | 50.00 | ||||
| 2025-08-08 | 13F | Renasant Bank | 4,447 | -5.82 | 273 | -10.49 | ||||
| 2025-07-28 | NP | AVDEX - Avantis International Equity Fund Institutional Class This fund is a listed as child fund of American Century Companies Inc and if that institution has disclosed ownership in this security, then these positions will not be double counted when calculating total shares and total value | 30,791 | 0.00 | 1,807 | -2.59 | ||||
| 2025-07-21 | 13F | Patriot Financial Group Insurance Agency, LLC | 3,347 | 7.72 | 205 | 2.50 | ||||
| 2025-08-15 | 13F | Equitable Holdings, Inc. | 6,351 | 27.92 | 390 | 21.18 | ||||
| 2025-08-12 | 13F | YANKCOM Partnership | 158 | 0.00 | 10 | -10.00 | ||||
| 2025-08-05 | 13F | Cambiar Investors Llc | 4,891 | -97.91 | 300 | -98.01 | ||||
| 2025-08-11 | 13F | Dorsey & Whitney Trust CO LLC | 9,098 | -7.30 | 559 | -11.99 | ||||
| 2025-05-07 | 13F | Advantage Trust Co | 0 | -100.00 | 0 | |||||
| 2025-08-13 | 13F | Truvestments Capital Llc | 1,235 | -12.66 | 76 | -17.58 | ||||
| 2025-08-01 | 13F | Belvedere Trading LLC | Put | 0 | -100.00 | 0 | ||||
| 2025-08-04 | 13F | Spire Wealth Management | 5,344 | -1.15 | 328 | -6.02 | ||||
| 2025-06-26 | NP | LSVMX - LSV U.S. MANAGED VOLATILITY FUND Institutional Class Shares | 1,600 | 0.00 | 91 | -2.17 | ||||
| 2025-07-10 | 13F | Baader Bank INC | 10,494 | 4.94 | 633 | -2.17 | ||||
| 2025-08-14 | 13F | GWM Advisors LLC | 41,564 | -7.32 | 2,552 | -12.06 | ||||
| 2025-08-14 | 13F | Icon Wealth Advisors, LLC | 2,470 | 0.00 | 152 | -5.03 | ||||
| 2025-08-26 | NP | EQ ADVISORS TRUST - EQ/Wellington Energy Portfolio Class IB | 47,562 | -2.04 | 2,920 | -7.04 | ||||
| 2025-08-14 | 13F | Principia Wealth Advisory, LLC | 40 | 2 | ||||||
| 2025-07-30 | 13F | Ethic Inc. | 6,166 | 25.79 | 379 | 19.94 | ||||
| 2025-08-14 | 13F | Synovus Financial Corp | 47,794 | -3.90 | 2,934 | -8.80 | ||||
| 2025-05-16 | 13F/A | Atlanta Consulting Group Advisors, LLC | 0 | -100.00 | 0 | |||||
| 2025-08-12 | 13F | Global Retirement Partners, LLC | 5,023 | 41.25 | 308 | 59.59 | ||||
| 2025-08-13 | 13F | Capital Analysts, Inc. | 2,346 | -4.67 | 0 | |||||
| 2025-07-17 | 13F | Sage Rhino Capital Llc | 7,175 | 0.07 | 440 | -4.97 | ||||
| 2025-08-12 | 13F | Jpmorgan Chase & Co | 2,250,845 | 2.66 | 138,179 | -2.58 | ||||
| 2025-08-14 | 13F | TCG Advisory Services, LLC | 4,281 | 10.73 | 263 | 4.80 | ||||
| 2025-07-30 | 13F | Legacy Wealth Asset Management, LLC | 20,895 | -37.16 | 1,283 | -40.40 | ||||
| 2025-08-14 | 13F | Harwood Advisory Group, LLC | 47 | 0.00 | 3 | 0.00 | ||||
| 2025-07-31 | 13F | Oppenheimer & Co Inc | 16,414 | 197.62 | 1,008 | 182.87 | ||||
| 2025-07-09 | 13F | Gilman Hill Asset Management, LLC | 83,259 | 3.90 | 5,111 | -1.39 | ||||
| 2025-08-14 | 13F/A | Rockefeller Capital Management L.P. | 1,088,065 | 11.66 | 66,796 | 5.97 | ||||
| 2025-08-14 | 13F | Fayez Sarofim & Co | 148,946 | -4.86 | 9,144 | -9.72 | ||||
| 2025-08-05 | 13F | Intellectus Partners, LLC | 25,992 | 0.00 | 1,622 | -4.82 | ||||
| 2025-08-27 | 13F/A | Brinker Capital Investments, LLC | 71,962 | 16.42 | 4,418 | 10.48 | ||||
| 2025-07-15 | 13F | Cranbrook Wealth Management, LLC | 151 | 0.00 | 9 | 0.00 | ||||
| 2025-07-17 | 13F | Independence Bank of Kentucky | 1,980 | -5.71 | 122 | -10.37 | ||||
| 2025-07-14 | 13F | Park Avenue Securities Llc | 39,085 | 10.36 | 2 | 0.00 | ||||
| 2025-08-14 | 13F | Wetherby Asset Management Inc | 24,420 | -2.28 | 1,499 | 10.06 | ||||
| 2025-07-17 | 13F | Raleigh Capital Management Inc. | 35,455 | 3.32 | 2,177 | -1.94 | ||||
| 2025-08-14 | 13F | Murphy & Mullick Capital Management Corp | 299 | 0.00 | 18 | -10.53 | ||||
| 2025-05-15 | 13F | CAPROCK Group, Inc. | 19,395 | 82.20 | 1,270 | 115.99 | ||||
| 2025-07-18 | 13F | PFG Investments, LLC | 9,315 | -2.14 | 572 | -7.15 | ||||
| 2025-08-12 | 13F | O'shaughnessy Asset Management, Llc | 177,610 | 0.82 | 10,903 | -4.33 | ||||
| 2025-07-31 | 13F | R Squared Ltd | 4,756 | 292 | ||||||
| 2025-08-13 | 13F | Mackenzie Financial Corp | 1,447,104 | 3.23 | 88,838 | -2.03 | ||||
| 2025-08-18 | 13F | Hollencrest Capital Management | 503 | 0.00 | 31 | -6.25 | ||||
| 2025-08-13 | 13F | Manning & Napier Advisors Llc | 126,288 | 8.63 | 7,753 | 3.10 | ||||
| 2025-08-15 | 13F | Morse Asset Management, Inc | 43 | 3 | ||||||
| 2025-07-17 | 13F | City Holding Co | 0 | -100.00 | 0 | |||||
| 2025-05-15 | 13F/A | Orion Portfolio Solutions, LLC | 61,815 | 10.50 | 3,999 | 31.17 | ||||
| 2025-08-14 | 13F | Mpwm Advisory Solutions, Llc | 69 | 0.00 | 4 | 0.00 | ||||
| 2025-08-26 | NP | GVEYX - VALUE EQUITY FUND Institutional | 60,088 | 18.94 | 3,689 | 12.85 | ||||
| 2025-07-11 | 13F | Lantz Financial LLC | 12,624 | -2.74 | 775 | -7.75 | ||||
| 2025-07-11 | 13F | Grove Bank & Trust | 1,841 | -22.81 | 113 | -26.62 | ||||
| 2025-05-12 | 13F | Operose Advisors LLC | 0 | -100.00 | 0 | |||||
| 2025-07-17 | 13F | First County Bank /CT/ | 11,121 | -12.00 | 683 | -16.52 | ||||
| 2025-08-28 | NP | CIHDX - Cullen International High Dividend Fund Retail Class | 61,562 | 18.54 | 3,779 | 12.50 | ||||
| 2025-07-01 | 13F | Confluence Investment Management Llc | 12,695 | 0.13 | 779 | -5.00 | ||||
| 2025-08-11 | 13F | Empowered Funds, LLC | 44,442 | 8.43 | 2,728 | 2.90 | ||||
| 2025-08-06 | 13F | Prospera Financial Services Inc | 24,231 | -6.85 | 1,488 | -11.65 | ||||
| 2025-07-22 | 13F | Iron Horse Wealth Management, LLC | 21 | 0.00 | 1 | 0.00 | ||||
| 2025-08-08 | 13F | Foundations Investment Advisors, LLC | 5,605 | -12.04 | 344 | -16.50 | ||||
| 2025-08-05 | 13F | GPS Wealth Strategies Group, LLC | 578 | -4.78 | 36 | -10.26 | ||||
| 2025-07-17 | 13F | Catalytic Wealth RIA, LLC | 4,182 | -30.35 | 257 | -34.02 | ||||
| 2025-07-25 | 13F | JustInvest LLC | 97,713 | 4.57 | 5,999 | -0.76 | ||||
| 2025-08-04 | 13F | Hantz Financial Services, Inc. | 46,066 | 19.02 | 3 | 0.00 | ||||
| 2025-08-07 | 13F | Vise Technologies, Inc. | 19,353 | 33.80 | 1,188 | 50.76 | ||||
| 2025-08-14 | 13F | Aventail Capital Group, LP | 261,623 | 0.00 | 16,061 | -5.10 | ||||
| 2025-08-07 | 13F | CENTRAL TRUST Co | 16,039 | -1.78 | 985 | -6.82 | ||||
| 2025-08-27 | NP | RYEUX - Europe 1.25x Strategy Fund Class H | 378 | -85.09 | 23 | -85.89 | ||||
| 2025-08-06 | 13F | Kcm Investment Advisors Llc | 3,943 | 19.34 | 242 | 13.62 | ||||
| 2025-08-13 | 13F | Beacon Pointe Advisors, LLC | 40,545 | -5.36 | 2,489 | -10.18 | ||||
| 2025-07-10 | 13F | Wealth Enhancement Advisory Services, Llc | 89,967 | 25.20 | 5,643 | 21.39 | ||||
| 2025-08-14 | 13F | McIlrath & Eck, LLC | 53 | 0.00 | 3 | 0.00 | ||||
| 2025-08-14 | 13F | Aquatic Capital Management LLC | 28,141 | -43.51 | 1,728 | -46.40 | ||||
| 2025-07-18 | 13F | Trust Co Of Vermont | 68 | 0.00 | 4 | 0.00 | ||||
| 2025-08-12 | 13F | Coldstream Capital Management Inc | 5,409 | 12.24 | 332 | 6.75 | ||||
| 2025-05-05 | 13F | Lindbrook Capital, Llc | 4,221 | 19.14 | 273 | 41.45 | ||||
| 2025-08-11 | 13F | HighTower Advisors, LLC | 755,768 | -1.70 | 46,397 | -6.71 | ||||
| 2025-06-30 | NP | GCOW - Pacer Global Cash Cows Dividend ETF | 735,083 | 7.75 | 41,789 | 5.56 | ||||
| 2025-08-01 | 13F | Oarsman Capital, Inc. | 4,232 | 4.13 | 260 | -1.15 | ||||
| 2025-08-04 | 13F | Assetmark, Inc | 203,990 | 9.38 | 12,523 | 3.80 | ||||
| 2025-08-06 | 13F | Moors & Cabot, Inc. | 28,444 | -5.23 | 1,746 | -10.05 | ||||
| 2025-08-14 | 13F | Wealth Advisors of Tampa Bay, LLC | 0 | -100.00 | 0 | |||||
| 2025-08-14 | 13F | Aqr Capital Management Llc | 71,123 | 5.43 | 4,366 | 0.05 | ||||
| 2025-08-07 | 13F | Addison Advisors LLC | 758 | -30.59 | 47 | -34.29 | ||||
| 2025-08-11 | 13F | Bell Investment Advisors, Inc | 132 | 6.45 | 8 | 0.00 | ||||
| 2025-08-14 | 13F | Greenline Partners, LLC | 43,700 | 0.43 | 2,683 | -4.69 | ||||
| 2025-07-25 | 13F | Sippican Capital Advisors | 3,898 | 0.00 | 239 | -5.16 | ||||
| 2025-08-13 | 13F | Scotia Capital Inc. | 4,800 | -12.90 | 295 | -17.42 | ||||
| 2025-07-17 | 13F | Greenleaf Trust | 13,708 | -4.40 | 842 | -9.28 | ||||
| 2025-08-14 | 13F | Snowden Capital Advisors LLC | 20,131 | -14.88 | 1,256 | -18.97 | ||||
| 2025-07-08 | 13F | Gallacher Capital Management LLC | 6,883 | 2.06 | 423 | -3.21 | ||||
| 2025-08-15 | 13F | Tower Research Capital LLC (TRC) | 13,574 | 6,333.18 | 833 | 6,307.69 | ||||
| 2025-08-12 | 13F | Inscription Capital, LLC | 0 | -100.00 | 0 | |||||
| 2025-08-29 | NP | Gabelli Dividend & Income Trust | 70,000 | 0.00 | 4,297 | -5.10 | ||||
| 2025-08-12 | 13F | Tradition Wealth Management, LLC | 5,173 | -27.11 | 318 | -30.94 | ||||
| 2025-08-26 | NP | PRFDX - T. Rowe Price Equity Income Fund This fund is a listed as child fund of Price T Rowe Associates Inc /md/ and if that institution has disclosed ownership in this security, then these positions will not be double counted when calculating total shares and total value | 565,000 | -17.41 | 34,685 | -21.62 | ||||
| 2025-08-14 | 13F | Benjamin Edwards Inc | 38,738 | 25.80 | 2,378 | 19.44 | ||||
| 2025-07-22 | 13F | Global Assets Advisory, LLC | 5,031 | -49.85 | 98 | -83.39 | ||||
| 2025-07-10 | 13F | Arkfeld Wealth Strategies, L.L.C. | 0 | -100.00 | 0 | |||||
| 2025-08-14 | 13F | Beaird Harris Wealth Management, LLC | 40 | 0.00 | 2 | 0.00 | ||||
| 2025-08-13 | 13F | Alerus Financial Na | 1,005 | 62 | ||||||
| 2025-08-14 | 13F | Cubist Systematic Strategies, LLC | 25,905 | 0.00 | 1,590 | -5.07 | ||||
| 2025-08-08 | 13F | Cetera Investment Advisers | 226,211 | -1.18 | 13,887 | -6.22 | ||||
| 2025-08-06 | 13F | Cetera Trust Company, N.A | 4,315 | 5.50 | 265 | 0.00 | ||||
| 2025-08-08 | 13F | Wrapmanager Inc | 6,321 | 1.46 | 388 | -3.72 | ||||
| 2025-08-13 | 13F | Brentview Investment Management LLC | 693 | 0.00 | 43 | -4.55 | ||||
| 2025-08-14 | 13F | Toronto Dominion Bank | 2,314 | 12.33 | 142 | 6.77 | ||||
| 2025-08-04 | 13F | HBK Sorce Advisory LLC | 4,619 | 5.94 | 284 | 0.35 | ||||
| 2025-08-01 | 13F | Banco Santander, S.A. | 64,598 | -3.42 | 3,966 | -8.34 | ||||
| 2025-08-14 | 13F | Sunbelt Securities, Inc. | 887 | 0.00 | 48 | -15.79 | ||||
| 2025-08-13 | 13F | Johnson Financial Group, Inc. | 1,627 | -21.21 | 102 | -25.19 | ||||
| 2025-08-14 | 13F | Warren Averett Asset Management, LLC | 22,418 | -10.61 | 1,376 | -15.17 | ||||
| 2025-08-07 | 13F | 1620 Investment Advisors, Inc. | 5,496 | 5.69 | 337 | 0.30 | ||||
| 2025-08-08 | 13F | Good Life Advisors, LLC | 8,069 | -9.08 | 495 | -13.76 | ||||
| 2025-07-30 | 13F | Financial Perspectives, Inc | 132 | 0.00 | 8 | 0.00 | ||||
| 2025-07-29 | 13F | Hoese & Co LLP | 0 | -100.00 | 0 | |||||
| 2025-08-04 | 13F | Creative Financial Designs Inc /adv | 28 | -41.67 | 2 | -66.67 | ||||
| 2025-08-14 | 13F | DRW Securities, LLC | 26,182 | -52.74 | 1,607 | -55.15 | ||||
| 2025-07-25 | 13F | Yousif Capital Management, Llc | 58,082 | 8.34 | 3,566 | 2.80 | ||||
| 2025-08-13 | 13F | Cerity Partners LLC | 174,441 | 3.59 | 10,709 | -1.69 | ||||
| 2025-07-11 | 13F | Annex Advisory Services, LLC | 0 | -100.00 | 0 | |||||
| 2025-08-05 | 13F | Bridgewater Advisors Inc. | 3,924 | 5.34 | 241 | 11.06 | ||||
| 2025-08-06 | 13F | Vestmark Advisory Solutions, Inc. | 59,424 | -9.96 | 3,648 | -14.55 | ||||
| 2025-08-13 | 13F | SCS Capital Management LLC | 0 | -100.00 | 0 | |||||
| 2025-07-23 | 13F/A | Euro Pacific Asset Management, LLC | 163,513 | -0.83 | 10 | 0.00 | ||||
| 2025-07-23 | 13F | Nbt Bank N A /ny | 2,250 | 0.00 | 138 | -4.83 | ||||
| 2025-07-28 | 13F | Courier Capital Llc | 11,616 | 0.00 | 713 | -5.06 | ||||
| 2025-08-07 | 13F | HighPoint Advisor Group LLC | 10,333 | 0.03 | 634 | 5.14 | ||||
| 2025-07-21 | 13F | Barrett & Company, Inc. | 350 | 0.00 | 21 | -4.55 | ||||
| 2025-08-14 | 13F | Hara Capital LLC | 185 | 0.00 | 11 | 0.00 | ||||
| 2025-06-13 | NP | Alpine Total Dynamic Dividend Fund | 219,300 | 0.00 | 12,467 | -2.03 | ||||
| 2025-07-17 | 13F | LVW Advisors, LLC | 11,248 | -35.21 | 691 | -38.56 | ||||
| 2025-08-08 | 13F | Abn Amro Investment Solutions | 92,800 | 0.00 | 5,697 | -5.11 | ||||
| 2025-08-11 | 13F | Nikko Asset Management Americas, Inc. | 54,637 | -9.06 | 3,353 | -13.67 | ||||
| 2025-05-15 | 13F | Rise Advisors, LLC | 0 | -100.00 | 0 | -100.00 | ||||
| 2025-05-15 | 13F | Fft Wealth Management Llc | 0 | -100.00 | 0 | |||||
| 2025-08-14 | 13F | Sei Investments Co | 915,387 | 0.70 | 56,196 | -4.44 | ||||
| 2025-08-12 | 13F | Personal Cfo Solutions, Llc | 4,101 | -10.20 | 252 | -14.92 | ||||
| 2025-08-27 | NP | Brighthouse Funds Trust I - T. Rowe Price Large Cap Value Portfolio Class A | 406,484 | 1.96 | 24,954 | -3.24 | ||||
| 2025-08-12 | 13F | Wood Tarver Financial Group, LLC | 10 | 0.00 | 0 | |||||
| 2025-08-21 | NP | MXEQX - Great-West Large Cap Value Fund Investor Class | 28,778 | -11.66 | 1,767 | -16.18 | ||||
| 2025-05-15 | 13F | Macquarie Group Ltd | 0 | -100.00 | 0 | -100.00 | ||||
| 2025-08-29 | NP | LMCMX - Miller Income Fund Class IS | 7,650 | 0.00 | 470 | -5.06 | ||||
| 2025-07-30 | 13F | Loring Wolcott & Coolidge Fiduciary Advisors Llp/ma | 1,555 | 0.00 | 95 | 4.40 | ||||
| 2025-08-25 | NP | MML SERIES INVESTMENT FUND - MML Equity Income Fund Initial Class | 16,079 | 31.87 | 987 | 25.25 | ||||
| 2025-08-13 | 13F | Qtron Investments LLC | 23,499 | -22.56 | 1,443 | -26.50 | ||||
| 2025-05-08 | 13F | Jefferies Financial Group Inc. | 0 | -100.00 | 0 | |||||
| 2025-07-14 | 13F | Armstrong Advisory Group, Inc | 21 | 1 | ||||||
| 2025-07-10 | 13F | Oliver Lagore Vanvalin Investment Group | 23,252 | -52.73 | 1,504 | -43.88 | ||||
| 2025-08-11 | 13F | Pinnacle Wealth Planning Services, Inc. | 0 | -100.00 | 0 | |||||
| 2025-07-11 | 13F | Weatherly Asset Management L. P. | 62,353 | -3.98 | 3,880 | -8.69 | ||||
| 2025-08-11 | 13F | Greykasell Wealth Strategies, Inc. | 0 | -100.00 | 0 | |||||
| 2025-04-22 | 13F | World Equity Group, Inc. | 0 | -100.00 | 0 | |||||
| 2025-05-15 | 13F | Cullen Capital Management, LLC | 229,097 | -18.58 | 14,820 | -3.35 | ||||
| 2025-08-26 | NP | GMOI - GMO International Value ETF | 102,643 | 51.08 | 6,301 | 43.37 | ||||
| 2025-08-12 | 13F | Gladstone Institutional Advisory LLC | 5,365 | 0.83 | 329 | -4.36 | ||||
| 2025-07-31 | 13F | Cambridge Investment Research Advisors, Inc. | 34,059 | -36.81 | 2 | -33.33 | ||||
| 2025-08-06 | 13F | Nicholas Hoffman & Company, LLC. | 23,458 | -0.06 | 1,440 | -5.14 | ||||
| 2025-07-15 | 13F | Pictet North America Advisors SA | 0 | -100.00 | 0 | |||||
| 2025-08-07 | 13F | Montag A & Associates Inc | 231 | 0.00 | 14 | -6.67 | ||||
| 2025-07-16 | 13F | American National Bank | 1,160 | -2.27 | 71 | -6.58 | ||||
| 2025-08-05 | 13F | Carolinas Wealth Consulting Llc | 0 | -100.00 | 0 | -100.00 | ||||
| 2025-08-04 | 13F | Mayflower Financial Advisors, LLC | 14,500 | -1.00 | 890 | -6.02 | ||||
| 2025-07-18 | 13F | Truist Financial Corp | 426,666 | -0.22 | 26,193 | -5.31 | ||||
| 2025-08-14 | 13F | Summit Trail Advisors, Llc | 8,557 | 534 | ||||||
| 2025-08-26 | NP | GLBIX - Leuthold Global Fund Institutional Class | 1,559 | 96 | ||||||
| 2025-08-11 | 13F | Intrust Bank Na | 34,942 | 2.18 | 2,145 | -3.03 | ||||
| 2025-08-12 | 13F | Minot DeBlois Advisors LLC | 50 | 0.00 | 3 | 0.00 | ||||
| 2025-05-05 | 13F | Outfitter Financial LLC | 0 | -100.00 | 0 | -100.00 | ||||
| 2025-08-14 | 13F | SWAN Capital LLC | 80 | 110.53 | 5 | 100.00 | ||||
| 2025-07-23 | 13F | REAP Financial Group, LLC | 0 | -100.00 | 0 | |||||
| 2025-08-13 | 13F | Northern Trust Corp | 1,847,806 | -1.52 | 113,437 | -6.54 | ||||
| 2025-08-13 | 13F | Thornburg Investment Management Inc | 229,514 | 1.24 | 14,090 | -90.39 | ||||
| 2025-07-31 | 13F | Allied Investment Advisors, LLC | 171,238 | 4.38 | 10,512 | -0.94 | ||||
| 2025-08-13 | 13F | Arrowstreet Capital, Limited Partnership | 0 | -100.00 | 0 | |||||
| 2025-08-14 | 13F | Evergreen Wealth Solutions, LLC | 4,097 | 252 | ||||||
| 2025-07-24 | 13F | Reuter James Wealth Management, Llc | 19,596 | -2.89 | 1,203 | -7.89 | ||||
| 2025-08-12 | 13F | Rhumbline Advisers | 30,568 | -1.01 | 1,877 | -6.06 | ||||
| 2025-08-11 | 13F | Nomura Asset Management Co Ltd | 0 | 0 | ||||||
| 2025-07-15 | 13F | Cardinal Capital Management | 43,959 | 2.14 | 2,740 | -2.84 | ||||
| 2025-04-17 | 13F | Vista Wealth Management Group, LLC | 4,210 | 11.67 | 272 | 32.68 | ||||
| 2025-07-21 | 13F | Zwj Investment Counsel Inc | 81,142 | -5.22 | 4,981 | -10.06 | ||||
| 2025-07-28 | 13F | Kiker Wealth Management, LLC | 0 | -100.00 | 0 | |||||
| 2025-05-12 | 13F | Eagle Global Advisors Llc | 0 | -100.00 | 0 | |||||
| 2025-07-17 | 13F | Genesis Private Wealth, Llc | 6,532 | -13.96 | 401 | -18.53 | ||||
| 2025-05-15 | 13F | Gwn Securities Inc. | 0 | -100.00 | 0 | |||||
| 2025-07-31 | 13F | Kathleen S. Wright Associates Inc. | 135 | 0.00 | 8 | 0.00 | ||||
| 2025-08-22 | NP | Columbia Funds Variable Series Trust II - CTIVP - MFS Value Fund Class 1 | 201,682 | 12,381 | ||||||
| 2025-07-16 | 13F | Augustine Asset Management Inc | 92,316 | 0.74 | 5,667 | -4.40 | ||||
| 2025-08-13 | 13F | Continuum Advisory, LLC | 0 | -100.00 | 0 | |||||
| 2025-07-29 | NP | RBB FUND, INC. - Aquarius International Fund | 8,970 | 0.00 | 526 | -2.59 | ||||
| 2025-08-12 | 13F | Willis Investment Counsel | 117,137 | 14.69 | 7,191 | 8.84 | ||||
| 2025-07-30 | 13F | Crewe Advisors LLC | 765 | -45.59 | 47 | -48.89 | ||||
| 2025-08-28 | NP | ABLOX - Alger Balanced Portfolio Class I-2 | 4,866 | 0.00 | 299 | -5.10 | ||||
| 2025-08-14 | 13F | Granite FO LLC | 39 | 0.00 | 2 | 0.00 | ||||
| 2025-08-25 | NP | MAINSTAY VP FUNDS TRUST - MainStay VP Epoch U.S. Equity Yield Portfolio Initial Class | 80,101 | -8.97 | 4,917 | -13.62 | ||||
| 2025-07-23 | 13F | Independent Solutions Wealth Management, LLC | 10,785 | 0.00 | 662 | -5.02 | ||||
| 2025-08-27 | NP | BBVLX - Bridge Builder Large Cap Value Fund | 161,584 | 0.00 | 9,920 | -5.10 | ||||
| 2025-08-11 | 13F | Knott David M Jr | 1,200 | 0.00 | 74 | -5.19 | ||||
| 2025-08-14 | 13F | Raymond James Financial Inc | 3,079,893 | -2.13 | 189,075 | -7.12 | ||||
| 2025-08-07 | 13F | Verus Capital Partners, Llc | 14,499 | 80.81 | 890 | 71.81 | ||||
| 2025-04-29 | 13F | Lee Danner & Bass Inc | 0 | -100.00 | 0 | -100.00 | ||||
| 2025-07-17 | 13F | Beacon Capital Management, LLC | 187 | 0.00 | 11 | -8.33 | ||||
| 2025-08-13 | 13F | Baird Financial Group, Inc. | 38,416 | -53.51 | 2,358 | -55.88 | ||||
| 2025-08-13 | 13F | Cary Street Partners Financial Llc | 8,939 | -12.23 | 549 | -16.72 | ||||
| 2025-08-12 | 13F | Franklin Resources Inc | 5,884,442 | 0.91 | 361,246 | -4.23 | ||||
| 2025-08-29 | 13F | Evolution Wealth Management Inc. | 1 | 0 | ||||||
| 2025-07-29 | 13F | Regions Financial Corp | 5,108 | 18.90 | 314 | 13.00 | ||||
| 2025-08-01 | 13F | May Hill Capital, LLC | 4,768 | 2.34 | 293 | -2.99 | ||||
| 2025-08-12 | 13F | Manchester Capital Management LLC | 3,084 | 15.51 | 189 | 9.88 | ||||
| 2025-07-25 | 13F | Verdence Capital Advisors LLC | 34,017 | 0.58 | 2,088 | -4.53 | ||||
| 2025-08-26 | NP | QAAHCX - T. Rowe Price Equity Income Portfolio This fund is a listed as child fund of Price T Rowe Associates Inc /md/ and if that institution has disclosed ownership in this security, then these positions will not be double counted when calculating total shares and total value | 31,412 | 0.00 | 1,928 | -5.12 | ||||
| 2025-06-24 | NP | FBLAX - Franklin Managed Income Fund CLASS A | 275,000 | 37.50 | 15,634 | 34.70 | ||||
| 2025-08-14 | 13F | Parallax Volatility Advisers, L.P. | Call | 31,300 | 0.00 | 1,922 | -5.09 | |||
| 2025-08-06 | 13F | True Wealth Design, LLC | 35 | -5.41 | 2 | 0.00 | ||||
| 2025-07-23 | 13F | Hardy Reed LLC | 5,535 | 0.00 | 340 | -5.31 | ||||
| 2025-07-16 | 13F | Lloyd Advisory Services, LLC. | 3,654 | -0.25 | 224 | -5.08 | ||||
| 2025-08-11 | 13F | TD Waterhouse Canada Inc. | 13,217 | 6.86 | 818 | 2.51 | ||||
| 2025-08-04 | 13F | Capital Performance Advisors Llp | 3,685 | 226 | ||||||
| 2025-05-15 | 13F | Edmond De Rothschild Holding S.a. | 0 | -100.00 | 0 | -100.00 | ||||
| 2025-07-07 | 13F | Good Steward Wealth Advisors,LLC | 4,649 | -49.81 | 285 | -52.42 | ||||
| 2025-08-08 | 13F | Gts Securities Llc | 10,943 | -34.04 | 672 | -37.47 | ||||
| 2025-07-29 | 13F | Harbor Asset Planning, Inc. | 72 | 4 | ||||||
| 2025-05-14 | 13F | Flow Traders U.s. Llc | 0 | -100.00 | 0 | |||||
| 2025-08-07 | 13F | Allworth Financial LP | 4,750 | 79.65 | 292 | 86.54 | ||||
| 2025-05-12 | 13F | Sandy Spring Bank | 0 | -100.00 | 0 | |||||
| 2025-08-12 | 13F | OneAscent Financial Services LLC | 3,336 | -12.78 | 0 | |||||
| 2025-08-14 | 13F | Atomi Financial Group, Inc. | 15,027 | 7.22 | 923 | 1.77 | ||||
| 2025-07-22 | 13F | Simplicity Wealth,LLC | 8,810 | 184.56 | 541 | 170.00 | ||||
| 2025-08-12 | 13F | Jacobi Capital Management LLC | 4,573 | -9.16 | 281 | -13.85 | ||||
| 2025-07-31 | 13F | Ingalls & Snyder Llc | 261,958 | 3.78 | 16 | 0.00 | ||||
| 2025-08-13 | 13F | Brandes Investment Partners, Lp | 662,773 | 2.39 | 40,688 | -2.83 | ||||
| 2025-07-28 | 13F | Ritholtz Wealth Management | 60,830 | -3.93 | 3,734 | -8.84 | ||||
| 2025-08-14 | 13F | Mariner, LLC | 220,999 | 9.22 | 13,567 | 3.66 | ||||
| 2025-07-18 | 13F | TruNorth Capital Management, LLC | 0 | -100.00 | 0 | |||||
| 2025-08-14 | 13F | Camden Capital, LLC | 14,473 | -0.24 | 889 | -5.33 | ||||
| 2025-08-15 | 13F | Provenance Wealth Advisors, LLC | 526 | -4.88 | 32 | -8.57 | ||||
| 2025-08-25 | NP | MFVAX - MassMutual Select Equity Opportunities Fund Class A | 19,100 | -21.40 | 1,173 | -25.40 | ||||
| 2025-08-12 | 13F | CIBC Private Wealth Group, LLC | 3,999 | -13.91 | 245 | -0.81 | ||||
| 2025-07-25 | 13F | Richardson Financial Services Inc. | 19 | 0.00 | 1 | 0.00 | ||||
| 2025-08-06 | 13F | Equity Investment Corp | 2,211,631 | 2.81 | 135,772 | -2.43 | ||||
| 2025-08-05 | 13F | KDT Advisors, LLC | 0 | -100.00 | 0 | |||||
| 2025-07-24 | 13F | Louisbourg Investments Inc. | 7,240 | 0.00 | 444 | -5.13 | ||||
| 2025-08-12 | 13F | Financial Advocates Investment Management | 0 | -100.00 | 0 | |||||
| 2025-04-02 | 13F | Marcum Wealth, LLC | 5,734 | 32.70 | 371 | 57.45 | ||||
| 2025-08-22 | NP | Columbia Funds Variable Series Trust II - CTIVP - T. Rowe Price Large Cap Value Fund Class 1 | 321,516 | -2.19 | 19,738 | -7.19 | ||||
| 2025-06-27 | NP | DIVD - Altrius Global Dividend ETF | 2,526 | 44.34 | 144 | 41.58 | ||||
| 2025-07-29 | 13F | Mattson Financial Services, LLC | 0 | -100.00 | 0 | |||||
| 2025-08-29 | NP | JAEEX - Equity Income Trust NAV | 29,915 | -85.20 | 1,836 | -85.90 | ||||
| 2025-08-13 | 13F | GeoWealth Management, LLC | 5,264 | -13.56 | 323 | -17.81 | ||||
| 2025-05-14 | 13F | Sig Brokerage, Lp | Call | 0 | -100.00 | 0 | ||||
| 2025-07-15 | 13F | Bfsg, Llc | 118,925 | 0.53 | 7,301 | -4.60 | ||||
| 2025-07-08 | 13F | Bard Financial Services, Inc. | 4,505 | 0.00 | 277 | -5.15 | ||||
| 2025-08-26 | NP | TFPN - Blueprint Chesapeake Multi-Asset Trend ETF | Short | -9,130 | -0.00 | -560 | -5.08 | |||
| 2025-08-06 | 13F | Founders Financial Securities Llc | 11,773 | 12.33 | 723 | 14.79 | ||||
| 2025-08-14 | 13F | Voya Financial Advisors, Inc. | 3,343 | -3.27 | 206 | -7.24 | ||||
| 2025-07-25 | 13F | Stephens Consulting, LLC | 312 | 14.71 | 19 | 11.76 | ||||
| 2025-07-24 | 13F | Cyndeo Wealth Partners, LLC | 35,125 | 0.50 | 2,156 | -4.60 | ||||
| 2025-07-22 | 13F | Cedar Mountain Advisors, LLC | 33 | 0.00 | 2 | 0.00 | ||||
| 2025-07-30 | 13F | Princeton Global Asset Management LLC | 37,799 | -6.96 | 2,320 | -11.72 | ||||
| 2025-07-30 | 13F | Townsend & Associates, Inc | 304,302 | -8.36 | 18,462 | -3.96 | ||||
| 2025-08-27 | NP | RYDEX VARIABLE TRUST - Europe 1.25x Strategy Fund Variable Annuity | 387 | -43.09 | 24 | -46.51 | ||||
| 2025-08-08 | 13F | Financial Gravity Companies, Inc. | 0 | -100.00 | 0 | |||||
| 2025-08-05 | 13F | Key FInancial Inc | 477 | 0.00 | 29 | -3.33 | ||||
| 2025-08-14 | 13F | Transamerica Financial Advisors, Inc. | 4,561 | -7.09 | 280 | |||||
| 2025-08-12 | 13F | American Century Companies Inc | 1,655,074 | 8.08 | 101,605 | 2.57 | ||||
| 2025-05-09 | 13F | Delta Financial Group, Inc. | 5,625 | 0.00 | 0 | |||||
| 2025-07-08 | 13F/A | Salem Investment Counselors Inc | 1,388 | -6.72 | 87 | -11.34 | ||||
| 2025-07-22 | 13F | Checchi Capital Advisers, LLC | 16,951 | -8.18 | 1,041 | -12.90 | ||||
| 2025-08-14 | 13F | Peapack Gladstone Financial Corp | 36,466 | -1.28 | 2 | 0.00 | ||||
| 2025-08-11 | 13F | Frank, Rimerman Advisors LLC | 8,678 | 533 | ||||||
| 2025-08-05 | 13F | Tsfg, Llc | 1,512 | 0.00 | 0 | |||||
| 2025-07-29 | 13F | Spirit Of America Management Corp/ny | 1,000 | 0.00 | 61 | -4.69 | ||||
| 2025-05-15 | 13F | American Trust Investment Advisors, LLC | 0 | -100.00 | 0 | |||||
| 2025-08-11 | 13F | Avantax Planning Partners, Inc. | 6,252 | -3.95 | 384 | -9.03 | ||||
| 2025-08-07 | 13F | McClarren Financial Advisors, Inc. | 0 | -100.00 | 0 | |||||
| 2025-08-21 | NP | HAP - VanEck Vectors Natural Resources ETF | 39,216 | 4.71 | 2,407 | -0.62 | ||||
| 2025-07-31 | 13F | Oppenheimer Asset Management Inc. | 49,966 | 1.08 | 3,067 | -4.07 | ||||
| 2025-08-28 | NP | IDVO - Amplify International Enhanced Dividend Income ETF | 37,601 | 37.18 | 2,308 | 30.17 | ||||
| 2025-06-26 | NP | Elevation Series Trust - The Opal International Dividend Income ETF | 22,034 | 40.78 | 1,253 | 37.89 | ||||
| 2025-08-11 | 13F | VSM Wealth Advisory, LLC | 0 | -100.00 | 0 | |||||
| 2025-07-16 | 13F | BOS Asset Management, LLC | 7,430 | 0.00 | 456 | -5.00 | ||||
| 2025-08-14 | 13F | Fiduciary Trust Co | 21,864 | 0.20 | 1,342 | -4.89 | ||||
| 2025-07-09 | 13F | Procyon Private Wealth Partners, LLC | 8,915 | -45.90 | 547 | -48.69 | ||||
| 2025-08-18 | NP | JAMEX - Jamestown Equity Fund | 9,500 | 0.00 | 583 | -5.05 | ||||
| 2025-08-26 | NP | Profunds - Profund Vp Europe 30 | 11,804 | 3.00 | 725 | -2.29 | ||||
| 2025-08-14 | 13F | Price T Rowe Associates Inc /md/ | 4,079,962 | -5.18 | 250 | -10.07 | ||||
| 2025-07-30 | 13F | Rehmann Capital Advisory Group | 0 | -100.00 | 0 | |||||
| 2025-08-11 | 13F | Lowe Brockenbrough & Co Inc | 70,179 | 1.90 | 4,308 | -4.54 | ||||
| 2025-07-16 | 13F | Old Port Advisors | 39,184 | -19.07 | 2,406 | -23.21 | ||||
| 2025-08-11 | 13F | GW&K Investment Management, LLC | 273 | 0.00 | 0 | |||||
| 2025-07-08 | 13F | Nbc Securities, Inc. | 13,597 | -1.27 | 1 | |||||
| 2025-08-13 | 13F | Hsbc Holdings Plc | 6,845 | -15.82 | 421 | -19.54 | ||||
| 2025-04-15 | 13F | BancFirst Trust & Investment Management | 0 | -100.00 | 0 | |||||
| 2025-08-14 | 13F | Integrated Wealth Concepts LLC | 16,164 | 1.44 | 992 | -3.69 | ||||
| 2025-08-11 | 13F | Integrated Quantitative Investments LLC | 17,900 | 0.00 | 1,099 | -5.10 | ||||
| 2025-05-05 | 13F | Eagle Bay Advisors LLC | 0 | -100.00 | 0 | |||||
| 2025-07-28 | 13F | Td Asset Management Inc | 208,280 | 0.56 | 12,786 | -4.57 | ||||
| 2025-08-13 | 13F | Natixis Advisors, L.p. | 2,136,551 | -1.09 | 131 | -5.76 | ||||
| 2025-08-13 | 13F | Cloverfields Capital Group, Lp | 61,262 | 3.51 | 3,761 | -1.78 | ||||
| 2025-07-17 | 13F | HB Wealth Management, LLC | 17,677 | -15.48 | 1,085 | -19.75 | ||||
| 2025-08-01 | 13F | Y-Intercept (Hong Kong) Ltd | 122,527 | 7,522 | ||||||
| 2025-08-15 | 13F | SkyView Investment Advisors, LLC | 8,054 | 2.22 | 0 | |||||
| 2025-08-13 | 13F/A | StoneX Group Inc. | 3,824 | -13.07 | 249 | -15.59 | ||||
| 2025-08-05 | 13F | Atlas Private Wealth Advisors | 5,034 | 0.00 | 309 | -4.92 | ||||
| 2025-08-11 | 13F | Raiffeisen Bank International AG | 193 | 0.00 | 12 | -8.33 | ||||
| 2025-08-11 | 13F | Annis Gardner Whiting Capital Advisors, LLC | 995 | 61 | ||||||
| 2025-07-31 | 13F | FSM Wealth Advisors, LLC | 6,035 | -2.74 | 365 | -9.23 | ||||
| 2025-08-13 | 13F | Invesco Ltd. | 198,215 | 7.33 | 12,168 | 1.86 | ||||
| 2025-07-25 | 13F | Sequoia Financial Advisors, LLC | 22,364 | 33.20 | 1,373 | 26.34 | ||||
| 2025-08-07 | 13F | Legacy Financial Advisors, Inc. | 0 | -100.00 | 0 | |||||
| 2025-08-19 | 13F/A | Pitcairn Co | 5,665 | -29.40 | 348 | -33.14 | ||||
| 2025-07-17 | 13F | Janney Montgomery Scott LLC | 162,866 | -2.47 | 10 | -10.00 | ||||
| 2025-08-11 | 13F | Independent Advisor Alliance | 12,198 | 7.73 | 749 | 2.19 | ||||
| 2025-07-10 | 13F | Wedmont Private Capital | 5,903 | -3.86 | 369 | 6.96 | ||||
| 2025-07-25 | 13F | Johnson Investment Counsel Inc | 5,485 | 0.00 | 337 | -5.08 | ||||
| 2025-08-08 | 13F | Hartland & Co., LLC | 910 | -10.34 | 56 | -15.38 | ||||
| 2025-08-11 | 13F | Rothschild Investment Llc | 780 | -10.24 | 48 | -16.07 | ||||
| 2025-08-07 | 13F | Guardian Capital Lp | 357,346 | 2.85 | 21,937 | -2.39 | ||||
| 2025-08-28 | NP | VALAX - Al Frank Fund Advisor Class | 16,000 | 0.00 | 982 | -5.12 | ||||
| 2025-07-07 | 13F | Versant Capital Management, Inc | 10,378 | 4.65 | 637 | -0.62 | ||||
| 2025-07-17 | 13F | BayBridge Capital Group, LLC | 3,956 | 7.62 | 243 | 2.11 | ||||
| 2025-08-14 | 13F | Recurrent Investment Advisors LLC | 15,038 | 0.00 | 923 | -5.04 | ||||
| 2025-08-13 | 13F | Cresset Asset Management, LLC | 6,057 | -38.21 | 378 | -41.28 | ||||
| 2025-08-14 | 13F | Hancock Whitney Corp | 17,318 | 0.81 | 1,063 | -4.32 | ||||
| 2025-08-13 | 13F | Townsquare Capital Llc | 5,712 | -82.76 | 351 | -83.67 | ||||
| 2025-05-02 | 13F | Concord Wealth Partners | 0 | -100.00 | 0 | |||||
| 2025-05-01 | 13F | Schechter Investment Advisors, LLC | 19,915 | 1.63 | 1,288 | 20.71 | ||||
| 2025-07-11 | 13F | Pinnacle Bancorp, Inc. | 116 | 0.00 | 7 | 0.00 | ||||
| 2025-07-21 | 13F | Ameriflex Group, Inc. | 200 | 0.00 | 12 | 0.00 | ||||
| 2025-08-13 | 13F | Cary Street Partner Investment Advisory Llc | 1,848 | 9.48 | 113 | 3.67 | ||||
| 2025-08-29 | NP | Gamco Global Gold, Natural Resources & Income Trust | 207,600 | 0.00 | 12,745 | -5.10 | ||||
| 2025-08-14 | 13F | BancorpSouth Bank | 114,108 | -3.90 | 7,005 | -25.34 | ||||
| 2025-08-14 | 13F/A | Barclays Plc | 704,679 | 137.45 | 43 | 126.32 | ||||
| 2025-07-17 | 13F | Wolff Wiese Magana Llc | 72 | 0.00 | 4 | 0.00 | ||||
| 2025-07-10 | 13F | Kozak & Associates, Inc. | 60 | 0.00 | 4 | 0.00 | ||||
| 2025-07-23 | 13F | Cohen Investment Advisors LLC | 6,850 | -5.20 | 421 | -10.06 | ||||
| 2025-07-24 | 13F | PDS Planning, Inc | 7,335 | -4.48 | 450 | -9.27 | ||||
| 2025-08-14 | 13F | Bridgefront Capital, LLC | 10,802 | 663 | ||||||
| 2025-07-25 | 13F | Apollon Wealth Management, LLC | 3,342 | -23.59 | 205 | -27.30 | ||||
| 2025-06-13 | NP | ADAVX - Aberdeen Dynamic Dividend Fund Class A | 14,000 | -2.10 | 796 | -4.10 | ||||
| 2025-04-25 | 13F | Smallwood Wealth Investment Management, LLC | 200 | 13 | ||||||
| 2025-07-29 | 13F | Wcm Investment Management, Llc | 0 | -100.00 | 0 | |||||
| 2025-07-14 | 13F | Abound Wealth Management | 18 | 0.00 | 1 | 0.00 | ||||
| 2025-07-02 | 13F | Crumly & Associates Inc. | 9,151 | -3.38 | 562 | -8.33 | ||||
| 2025-07-16 | 13F | Ipswich Investment Management Co., Inc. | 21,930 | -4.36 | 1,346 | -9.24 | ||||
| 2025-07-28 | 13F | Rosenberg Matthew Hamilton | 3,766 | 3.49 | 231 | -1.70 | ||||
| 2025-07-15 | 13F | Kentucky Trust Co | 150 | 0.00 | 9 | 0.00 | ||||
| 2025-07-18 | 13F | Bourgeon Capital Management Llc | 78,107 | 1.64 | 4,795 | -3.54 | ||||
| 2025-08-14 | 13F | Bluefin Capital Management, Llc | 4,300 | 264 | ||||||
| 2025-08-06 | 13F | Stone House Investment Management, LLC | 87 | 0.00 | 5 | 0.00 | ||||
| 2025-08-14 | 13F | Fmr Llc | 11,483,543 | -3.85 | 704,975 | -8.76 | ||||
| 2025-08-13 | 13F | MONECO Advisors, LLC | 7,051 | -1.16 | 433 | -6.29 | ||||
| 2025-08-14 | 13F | Principal Street Partners, LLC | 20,793 | 268.67 | 1,276 | 250.55 | ||||
| 2025-07-23 | 13F | WoodTrust Financial Corp | 5,875 | 0.00 | 0 | |||||
| 2025-08-05 | 13F | Mission Wealth Management, Lp | 9,751 | -2.40 | 599 | -7.43 | ||||
| 2025-07-22 | 13F | Belpointe Asset Management LLC | 4,220 | 0.00 | 259 | -4.78 | ||||
| 2025-07-15 | 13F | Mather Group, Llc. | 0 | -100.00 | 0 | |||||
| 2025-07-24 | 13F | Argyle Capital Management Inc. | 9,800 | 0.00 | 602 | -5.06 | ||||
| 2025-08-12 | 13F | BlackRock, Inc. | 1,742,294 | 6.18 | 106,959 | 0.76 | ||||
| 2025-08-19 | 13F | Anchor Investment Management, LLC | 942 | 0.00 | 58 | -5.00 | ||||
| 2025-08-12 | 13F | TCTC Holdings, LLC | 1,809 | 0.00 | 111 | -5.13 | ||||
| 2025-07-22 | 13F | Valeo Financial Advisors, LLC | 10,234 | 3.85 | 628 | -1.41 | ||||
| 2025-06-27 | NP | KEAT - Keating Active ETF | 39,264 | 2.24 | 2,232 | 0.18 | ||||
| 2025-08-07 | 13F | Campbell & CO Investment Adviser LLC | 8,054 | 84.01 | 494 | 74.56 | ||||
| 2025-08-12 | 13F | Foster Dykema Cabot & Partners, Llc | 422 | 0.00 | 26 | -3.70 | ||||
| 2025-08-13 | 13F | Fisher Asset Management, LLC | 20,486,665 | -3.24 | 1,257,676 | -8.18 | ||||
| 2025-06-26 | NP | FLPSX - Fidelity Low-Priced Stock Fund This fund is a listed as child fund of Fmr Llc and if that institution has disclosed ownership in this security, then these positions will not be double counted when calculating total shares and total value | 4,262,695 | -11.48 | 242,334 | -13.28 | ||||
| 2025-07-08 | 13F | Baker Ellis Asset Management LLC | 9,000 | -22.41 | 553 | -26.40 | ||||
| 2025-07-24 | 13F | Callan Family Office, LLC | 57,376 | 112.95 | 3,522 | 102.18 | ||||
| 2025-08-06 | 13F | Golden State Wealth Management, LLC | 1,220 | -28.40 | 75 | -32.73 | ||||
| 2025-08-08 | 13F | Bailard, Inc. | 17,838 | 6.60 | 1,095 | 1.20 | ||||
| 2025-08-26 | NP | PDIAX - Virtus Rampart Enhanced Core Equity Fund Class A | 45,023 | 4.66 | 2,764 | -0.68 | ||||
| 2025-08-12 | 13F | J.w. Cole Advisors, Inc. | 7,260 | -2.21 | 446 | -7.29 | ||||
| 2025-07-29 | 13F | Commons Capital, Llc | 0 | -100.00 | 0 | |||||
| 2025-08-26 | 13F/A | Thrivent Financial For Lutherans | 8,936 | 1 | ||||||
| 2025-08-07 | 13F | Atala Financial Inc | 0 | -100.00 | 0 | |||||
| 2025-07-24 | 13F | Us Bancorp \de\ | 103,707 | -16.79 | 6,367 | -21.04 | ||||
| 2025-07-17 | 13F | Venture Visionary Partners LLC | 3,562 | 219 | ||||||
| 2025-08-11 | 13F | Principal Securities, Inc. | 6,141 | 12.35 | 377 | 26.60 | ||||
| 2025-07-16 | 13F | Perigon Wealth Management, LLC | 15,476 | 0.24 | 950 | -4.81 | ||||
| 2025-08-29 | NP | GCAEX - The Gabelli Equity Income Fund Class A | 13,000 | 0.00 | 798 | -5.00 | ||||
| 2025-07-07 | 13F | Trust Co | 442 | 0.00 | 27 | -3.57 | ||||
| 2025-05-15 | 13F | Wolverine Trading, Llc | 0 | -100.00 | 0 | -100.00 | ||||
| 2025-08-13 | 13F | 1832 Asset Management L.P. | 115,681 | 0.00 | 7,102 | -5.10 | ||||
| 2025-07-16 | 13F | Signaturefd, Llc | 37,027 | -3.42 | 2,273 | -8.35 | ||||
| 2025-07-29 | 13F | Aull & Monroe Investment Management Corp | 10,565 | 0.00 | 649 | -5.12 | ||||
| 2025-06-25 | NP | EPDPX - EuroPac International Dividend Income Fund Class A | 40,000 | 0.00 | 2,274 | -2.02 | ||||
| 2025-08-07 | 13F | FDx Advisors, Inc. | 5,928 | -6.08 | 0 | |||||
| 2025-06-27 | NP | HAVLX - Harbor Large Cap Value Fund Institutional Class | 434,400 | -22.72 | 24,696 | -24.29 | ||||
| 2025-07-25 | 13F | Priebe Wealth Holdings LLC | 0 | -100.00 | 0 | |||||
| 2025-07-08 | 13F | Ransom Advisory, Ltd | 750 | -23.08 | 46 | -26.98 | ||||
| 2025-08-18 | 13F | Wolverine Trading, Llc | Put | 0 | -100.00 | 0 | ||||
| 2025-07-31 | 13F | Briaud Financial Planning, Inc | 70 | 0 | ||||||
| 2025-08-12 | 13F | Strategic Advisors LLC | 3,273 | -11.18 | 201 | -15.97 | ||||
| 2025-08-18 | 13F | Wolverine Trading, Llc | Call | 0 | -100.00 | 0 | ||||
| 2025-07-25 | 13F | LRI Investments, LLC | 2,963 | 7.67 | 182 | 1.69 | ||||
| 2025-07-29 | 13F | Private Trust Co Na | 4,002 | 1.44 | 246 | -3.92 | ||||
| 2025-08-13 | 13F | Gamco Investors, Inc. Et Al | 30,650 | 0.00 | 1,882 | -5.10 | ||||
| 2025-08-14 | 13F | Alyeska Investment Group, L.P. | 1,668,412 | 33.71 | 102,424 | 26.89 | ||||
| 2025-07-15 | 13F | Lynch & Associates/in | 31,046 | -0.95 | 1,906 | -6.02 | ||||
| 2025-08-12 | 13F | Boreal Capital Management LLC | 118 | 7 | ||||||
| 2025-08-14 | 13F | Smartleaf Asset Management LLC | 9,021 | -2.03 | 555 | -6.10 | ||||
| 2025-07-30 | 13F | Boit C F David | 0 | -100.00 | 0 | |||||
| 2025-07-16 | 13F | Banque Pictet & Cie Sa | 7,119 | 0.00 | 437 | -5.00 | ||||
| 2025-08-13 | 13F | Walleye Capital LLC | Put | 59,600 | -34.58 | 3,659 | -37.93 | |||
| 2025-08-14 | 13F | Henry James International Management Inc. | 9,923 | 0.00 | 609 | -4.99 | ||||
| 2025-07-29 | 13F | Aspiriant, Llc | 4,500 | -1.79 | 276 | -6.76 | ||||
| 2025-08-13 | 13F | Walleye Capital LLC | 4,730 | -91.68 | 290 | -92.12 | ||||
| 2025-08-13 | 13F | Hendershot Investments Inc. | 7,945 | -17.88 | 488 | -22.08 | ||||
| 2025-08-13 | 13F | Walleye Capital LLC | Call | 65,900 | 579.38 | 4,046 | 545.14 | |||
| 2025-08-12 | 13F | Argent Trust Co | 9,470 | -10.96 | 581 | -15.55 | ||||
| 2025-05-14 | 13F | BOK Financial Private Wealth, Inc. | 0 | -100.00 | 0 | |||||
| 2025-06-26 | NP | QUVU - Hartford Quality Value ETF | 42,971 | -17.08 | 2,443 | -18.79 | ||||
| 2025-07-16 | 13F | ORG Partners LLC | 3,696 | -7.58 | 229 | -11.28 | ||||
| 2025-08-05 | 13F | NewSquare Capital LLC | 495 | 141.46 | 30 | 130.77 | ||||
| 2025-07-07 | 13F | Northwest & Ethical Investments L.P. | 0 | -100.00 | 0 | |||||
| 2025-07-29 | 13F | Violich Capital Management, Inc. | 0 | -100.00 | 0 | |||||
| 2025-07-31 | 13F | Sentinel Trust Co Lba | 13,800 | 0.00 | 1 | |||||
| 2025-08-13 | 13F | West Family Investments, Inc. | 4,465 | 274 | ||||||
| 2025-08-14 | 13F | Css Llc/il | Call | 0 | -100.00 | 0 | -100.00 | |||
| 2025-08-06 | 13F | Harvest Portfolios Group Inc. | 25,267 | -18.81 | 1,551 | -22.95 | ||||
| 2025-08-15 | 13F | Lantern Wealth Advisors, LLC | 3,300 | 203 | ||||||
| 2025-07-15 | 13F | Ballentine Partners, LLC | 16,508 | 11.52 | 1,013 | 5.85 | ||||
| 2025-05-16 | 13F/A | Kestra Investment Management, LLC | 0 | -100.00 | 0 | |||||
| 2025-07-22 | 13F | Fortitude Advisory Group L.L.C. | 4,493 | -0.88 | 276 | 4.96 | ||||
| 2025-07-23 | 13F | Joel Isaacson & Co., LLC | 5,077 | 0.00 | 312 | -5.18 | ||||
| 2025-08-07 | 13F | Midwest Trust Co | 5,937 | 364 | ||||||
| 2025-07-08 | 13F | Martin Capital Partners, LLC | 63,764 | 211.73 | 4 | 200.00 | ||||
| 2025-06-25 | NP | FTLS - First Trust Long/Short Equity ETF This fund is a listed as child fund of First Trust Advisors Lp and if that institution has disclosed ownership in this security, then these positions will not be double counted when calculating total shares and total value | 100,849 | -15.67 | 5,733 | -25.01 | ||||
| 2025-07-17 | 13F | Halbert Hargrove Global Advisors, Llc | 63 | -79.94 | 4 | -85.00 | ||||
| 2025-08-26 | NP | RPAR - RPAR Risk Parity ETF | 32,328 | -4.09 | 1,985 | -8.99 | ||||
| 2025-08-14 | 13F | DRW Securities, LLC | Put | 0 | -100.00 | 0 | -100.00 | |||
| 2025-07-30 | 13F | Cullen/frost Bankers, Inc. | 2,401 | -37.72 | 147 | -40.96 | ||||
| 2025-08-11 | 13F | Aptus Capital Advisors, LLC | 10,463 | -0.13 | 648 | -4.28 | ||||
| 2025-08-13 | 13F | Centiva Capital, LP | 0 | -100.00 | 0 | |||||
| 2025-07-31 | 13F | 180 Wealth Advisors, Llc | 5,927 | 0.78 | 364 | -4.47 | ||||
| 2025-06-25 | NP | EICVX - EIC Value Fund Class A | 153,375 | -3.20 | 8,719 | -5.17 | ||||
| 2025-08-07 | 13F | Nwam Llc | 9,908 | 151.54 | 593 | 133.07 | ||||
| 2025-08-26 | NP | AEPIX - Allspring Managed Account CoreBuilder Shares Series EPI CoreBuilder Shares Series EPI | 993 | -6.32 | 61 | -11.76 | ||||
| 2025-07-07 | 13F | Thurston, Springer, Miller, Herd & Titak, Inc. | 947 | -17.44 | 58 | -21.62 | ||||
| 2025-08-04 | 13F | Field & Main Bank | 1,000 | 0.00 | 61 | -4.69 | ||||
| 2025-08-13 | 13F | Summit Financial, LLC | 5,531 | -1.13 | 345 | -4.43 | ||||
| 2025-08-05 | 13F | Cherry Tree Wealth Management, LLC | 0 | -100.00 | 0 | |||||
| 2025-08-11 | 13F | NewEdge Wealth, LLC | 25,919 | -29.38 | 1,576 | -33.66 | ||||
| 2025-07-30 | NP | APIE - ActivePassive International Equity ETF | 74,817 | -11.40 | 4,390 | -13.67 | ||||
| 2025-05-15 | 13F | DZ BANK AG Deutsche Zentral Genossenschafts Bank, Frankfurt am Main | 0 | -100.00 | 0 | |||||
| 2025-08-05 | 13F | Westside Investment Management, Inc. | 799 | 59.80 | 49 | 53.13 | ||||
| 2025-08-04 | 13F | Strs Ohio | 0 | -100.00 | 0 | |||||
| 2025-07-29 | 13F | Lesa Sroufe & Co | 0 | -100.00 | 0 | |||||
| 2025-08-07 | 13F | Sierra Ocean, Llc | 381 | 43.77 | 23 | 35.29 | ||||
| 2025-08-12 | 13F | Dimensional Fund Advisors Lp | 377,144 | 0.01 | 23,153 | -5.10 | ||||
| 2025-08-14 | 13F | Atom Investors LP | 59,775 | 292.35 | 3,670 | 272.49 | ||||
| 2025-08-14 | 13F | VPR Management LLC | 3,000 | 184 | ||||||
| 2025-04-30 | 13F | Sofos Investments, Inc. | 6 | 0 | ||||||
| 2025-08-14 | 13F | Stifel Financial Corp | 746,083 | 2.51 | 45,802 | -2.71 | ||||
| 2025-08-14 | 13F | Janus Henderson Group Plc | 4,766 | 25.12 | 293 | 19.67 | ||||
| 2025-08-14 | 13F | Silvercrest Asset Management Group Llc | 157,628 | 8.18 | 9,677 | 2.66 | ||||
| 2025-04-14 | 13F | IMC-Chicago, LLC | 0 | -100.00 | 0 | |||||
| 2025-08-12 | 13F | Pacer Advisors, Inc. | 0 | -100.00 | 0 | |||||
| 2025-08-05 | 13F | Huntington National Bank | 5,952 | 0.22 | 365 | -4.95 | ||||
| 2025-08-12 | 13F | Choate Investment Advisors | 5,859 | 360 | ||||||
| 2025-06-24 | NP | EPLIX - MainStay Epoch U.S. Equity Yield Fund Investor Class | 95,528 | -2.79 | 5,431 | -4.77 | ||||
| 2025-08-05 | 13F | Blue Barn Wealth, LLC | 4,352 | 0.07 | 267 | -4.98 | ||||
| 2025-07-21 | 13F | Credential Qtrade Securities Inc. | 37,735 | 3.28 | 2,597 | 5.53 | ||||
| 2025-08-13 | 13F | Brown Advisory Inc | 14,473 | -1.80 | 888 | -6.82 | ||||
| 2025-08-06 | 13F | Hallmark Capital Management Inc | 0 | -100.00 | 0 | |||||
| 2025-07-09 | 13F | Heritage Family Offices, LLP | 9,956 | 0.07 | 639 | -0.78 | ||||
| 2025-04-11 | 13F/A | Private Advisory Group LLC | 0 | -100.00 | 0 | -100.00 | ||||
| 2025-05-13 | 13F | Fca Corp /tx | 0 | -100.00 | 0 | |||||
| 2025-06-26 | NP | DFAX - Dimensional World ex U.S. Core Equity 2 ETF | 9,460 | 0.00 | 538 | -2.01 | ||||
| 2025-05-12 | 13F | Virtu Financial LLC | 0 | -100.00 | 0 | |||||
| 2025-08-14 | 13F | Ambassador Advisors, LLC | 4,591 | 6.30 | 282 | 0.72 | ||||
| 2025-07-01 | 13F | Harbor Investment Advisory, Llc | 56 | 0.00 | 3 | 0.00 | ||||
| 2025-08-07 | 13F | Americana Partners, LLC | 86,440 | 0.05 | 5,307 | -5.06 | ||||
| 2025-08-13 | 13F | Lido Advisors, LLC | 8,166 | -8.33 | 509 | -12.69 | ||||
| 2025-07-23 | 13F | Kingswood Wealth Advisors, Llc | 0 | -100.00 | 0 | -100.00 | ||||
| 2025-05-27 | NP | PRUDENTIAL SERIES FUND - GLOBAL PORTFOLIO Class I | 49,028 | 0.00 | 3,172 | 18.68 | ||||
| 2025-07-28 | 13F | Private Wealth Asset Management, LLC | 973 | -56.64 | 60 | -59.31 |